The same plot in 14 other libraries — JavaScript: Chart.js, D3.js, Apache ECharts, MUI X Charts; Python: Altair, Bokeh, lets-plot, Matplotlib, Plotly, plotnine, Pygal, Seaborn; R: ggplot2; Julia: Makie.jl. Compare all 15 side by side: Basic Polar Chart in Python, R, Julia and JavaScript.
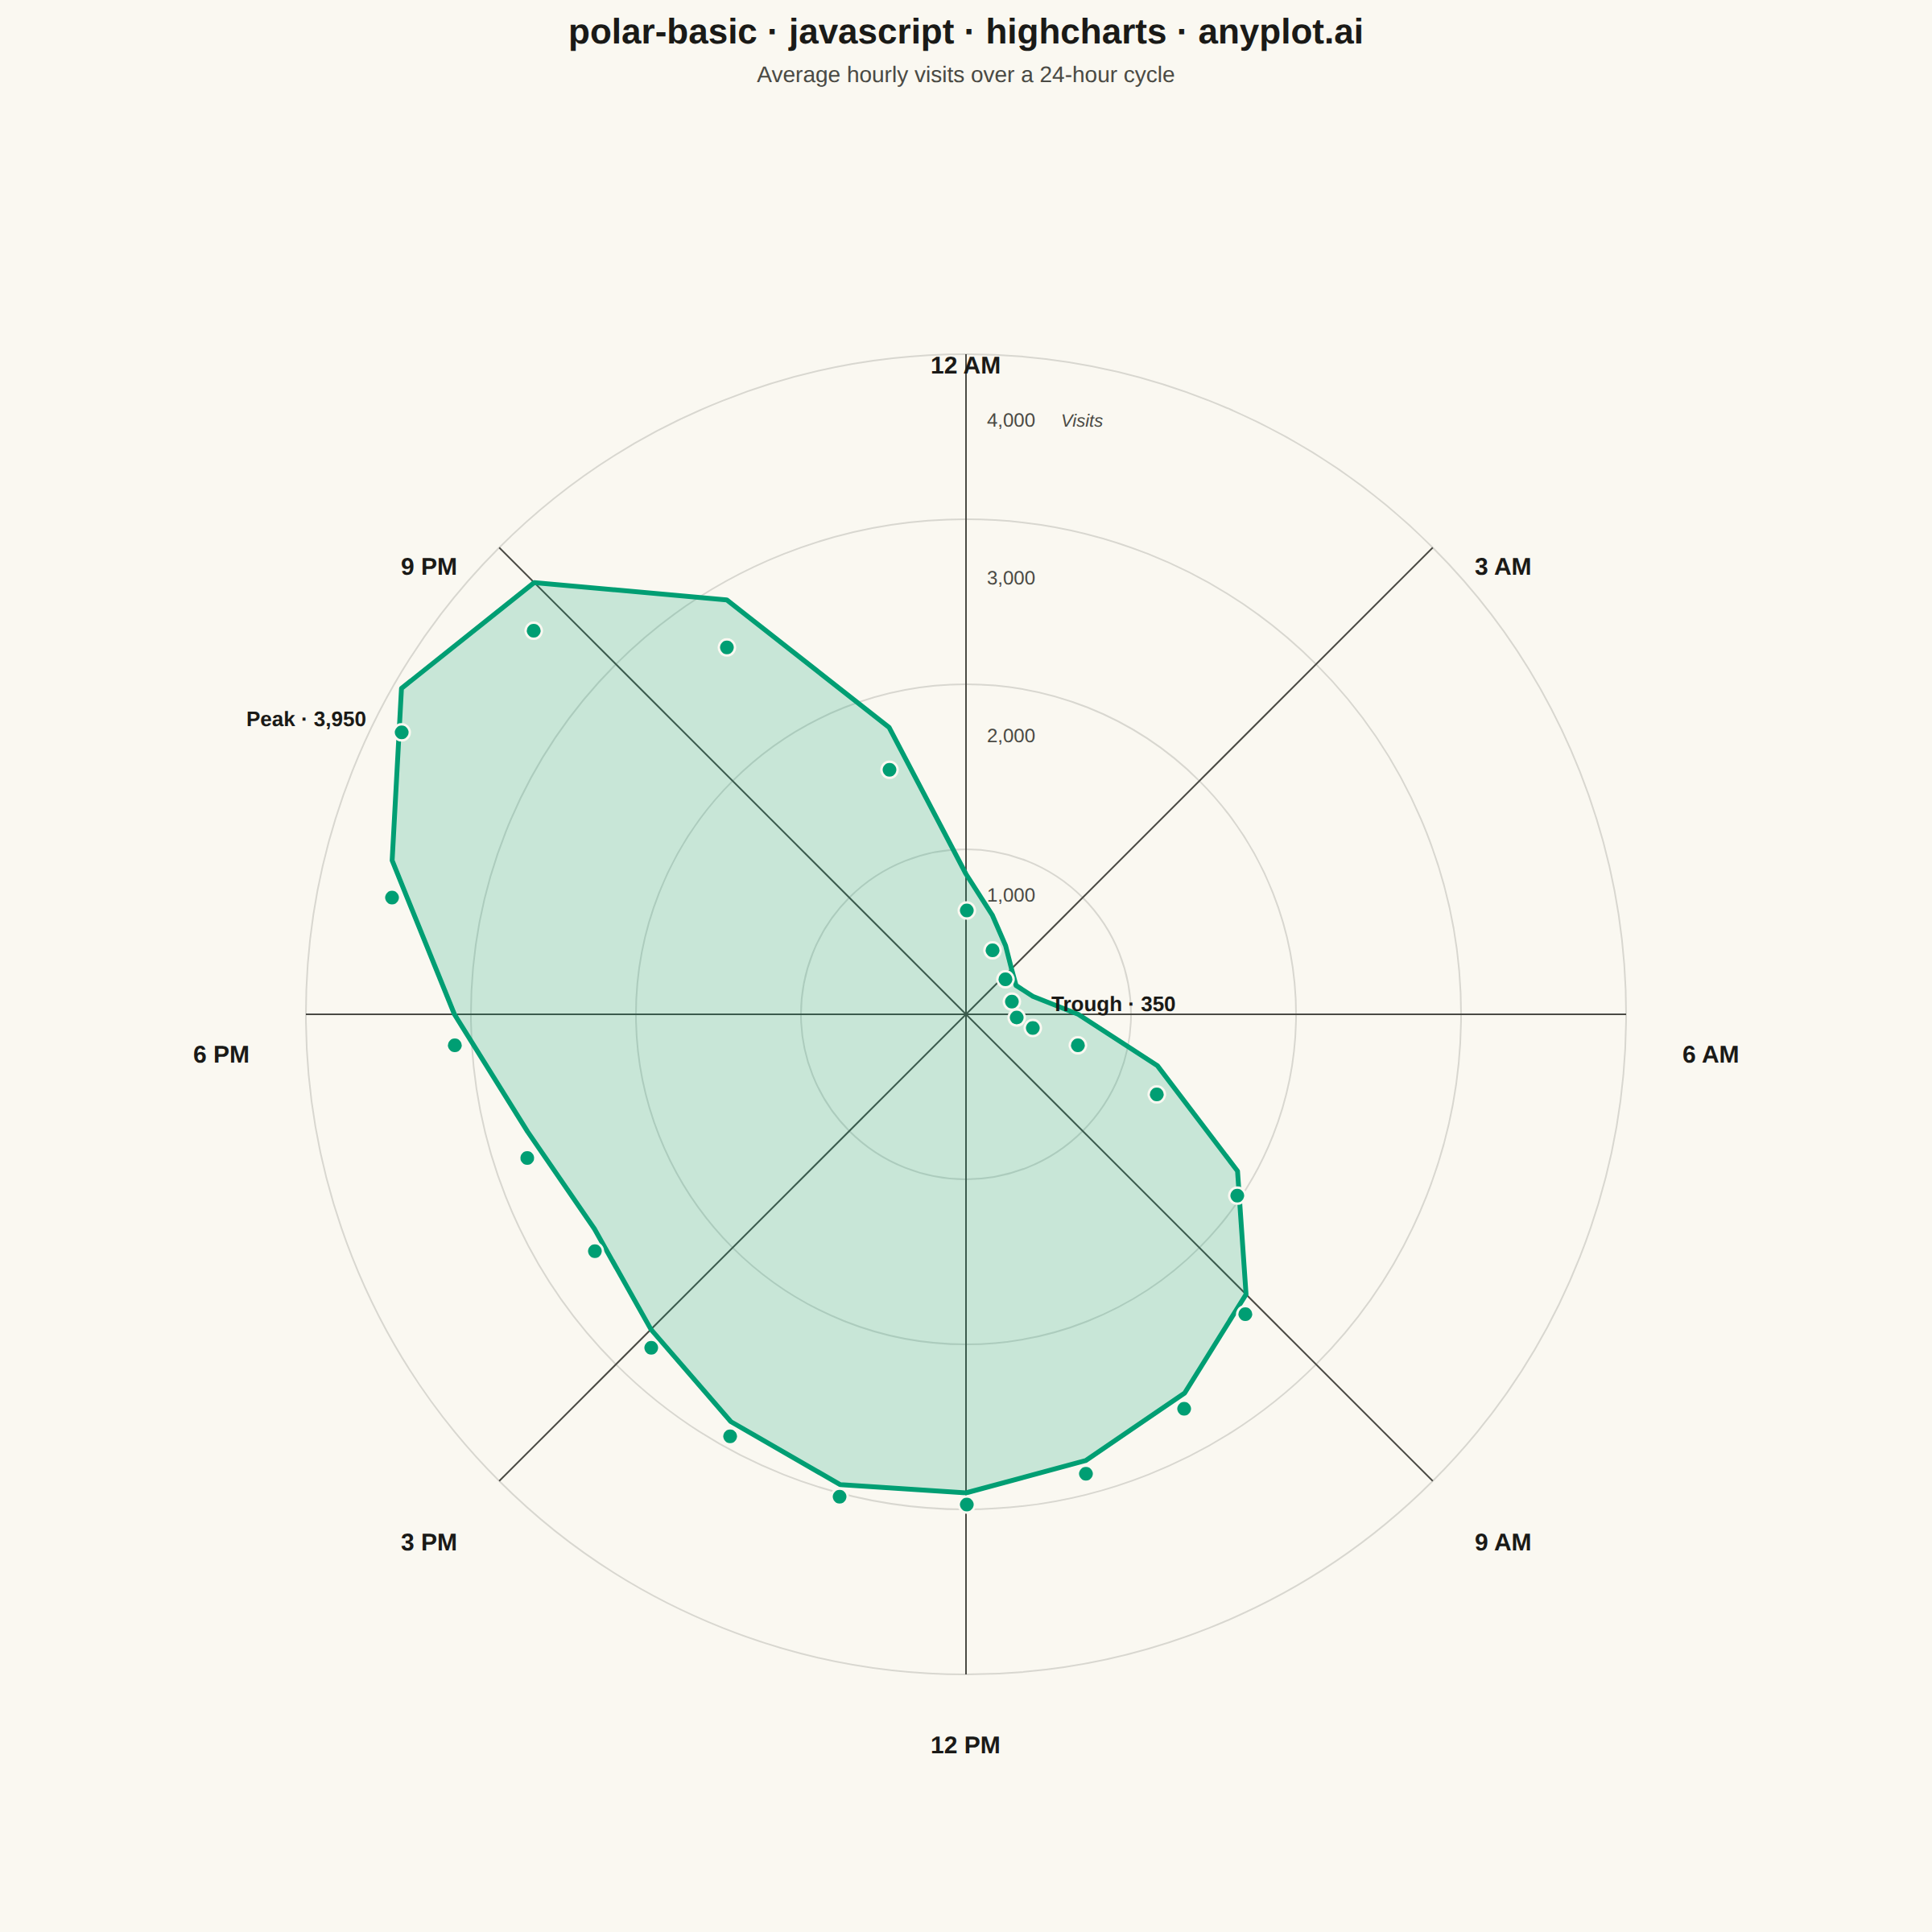
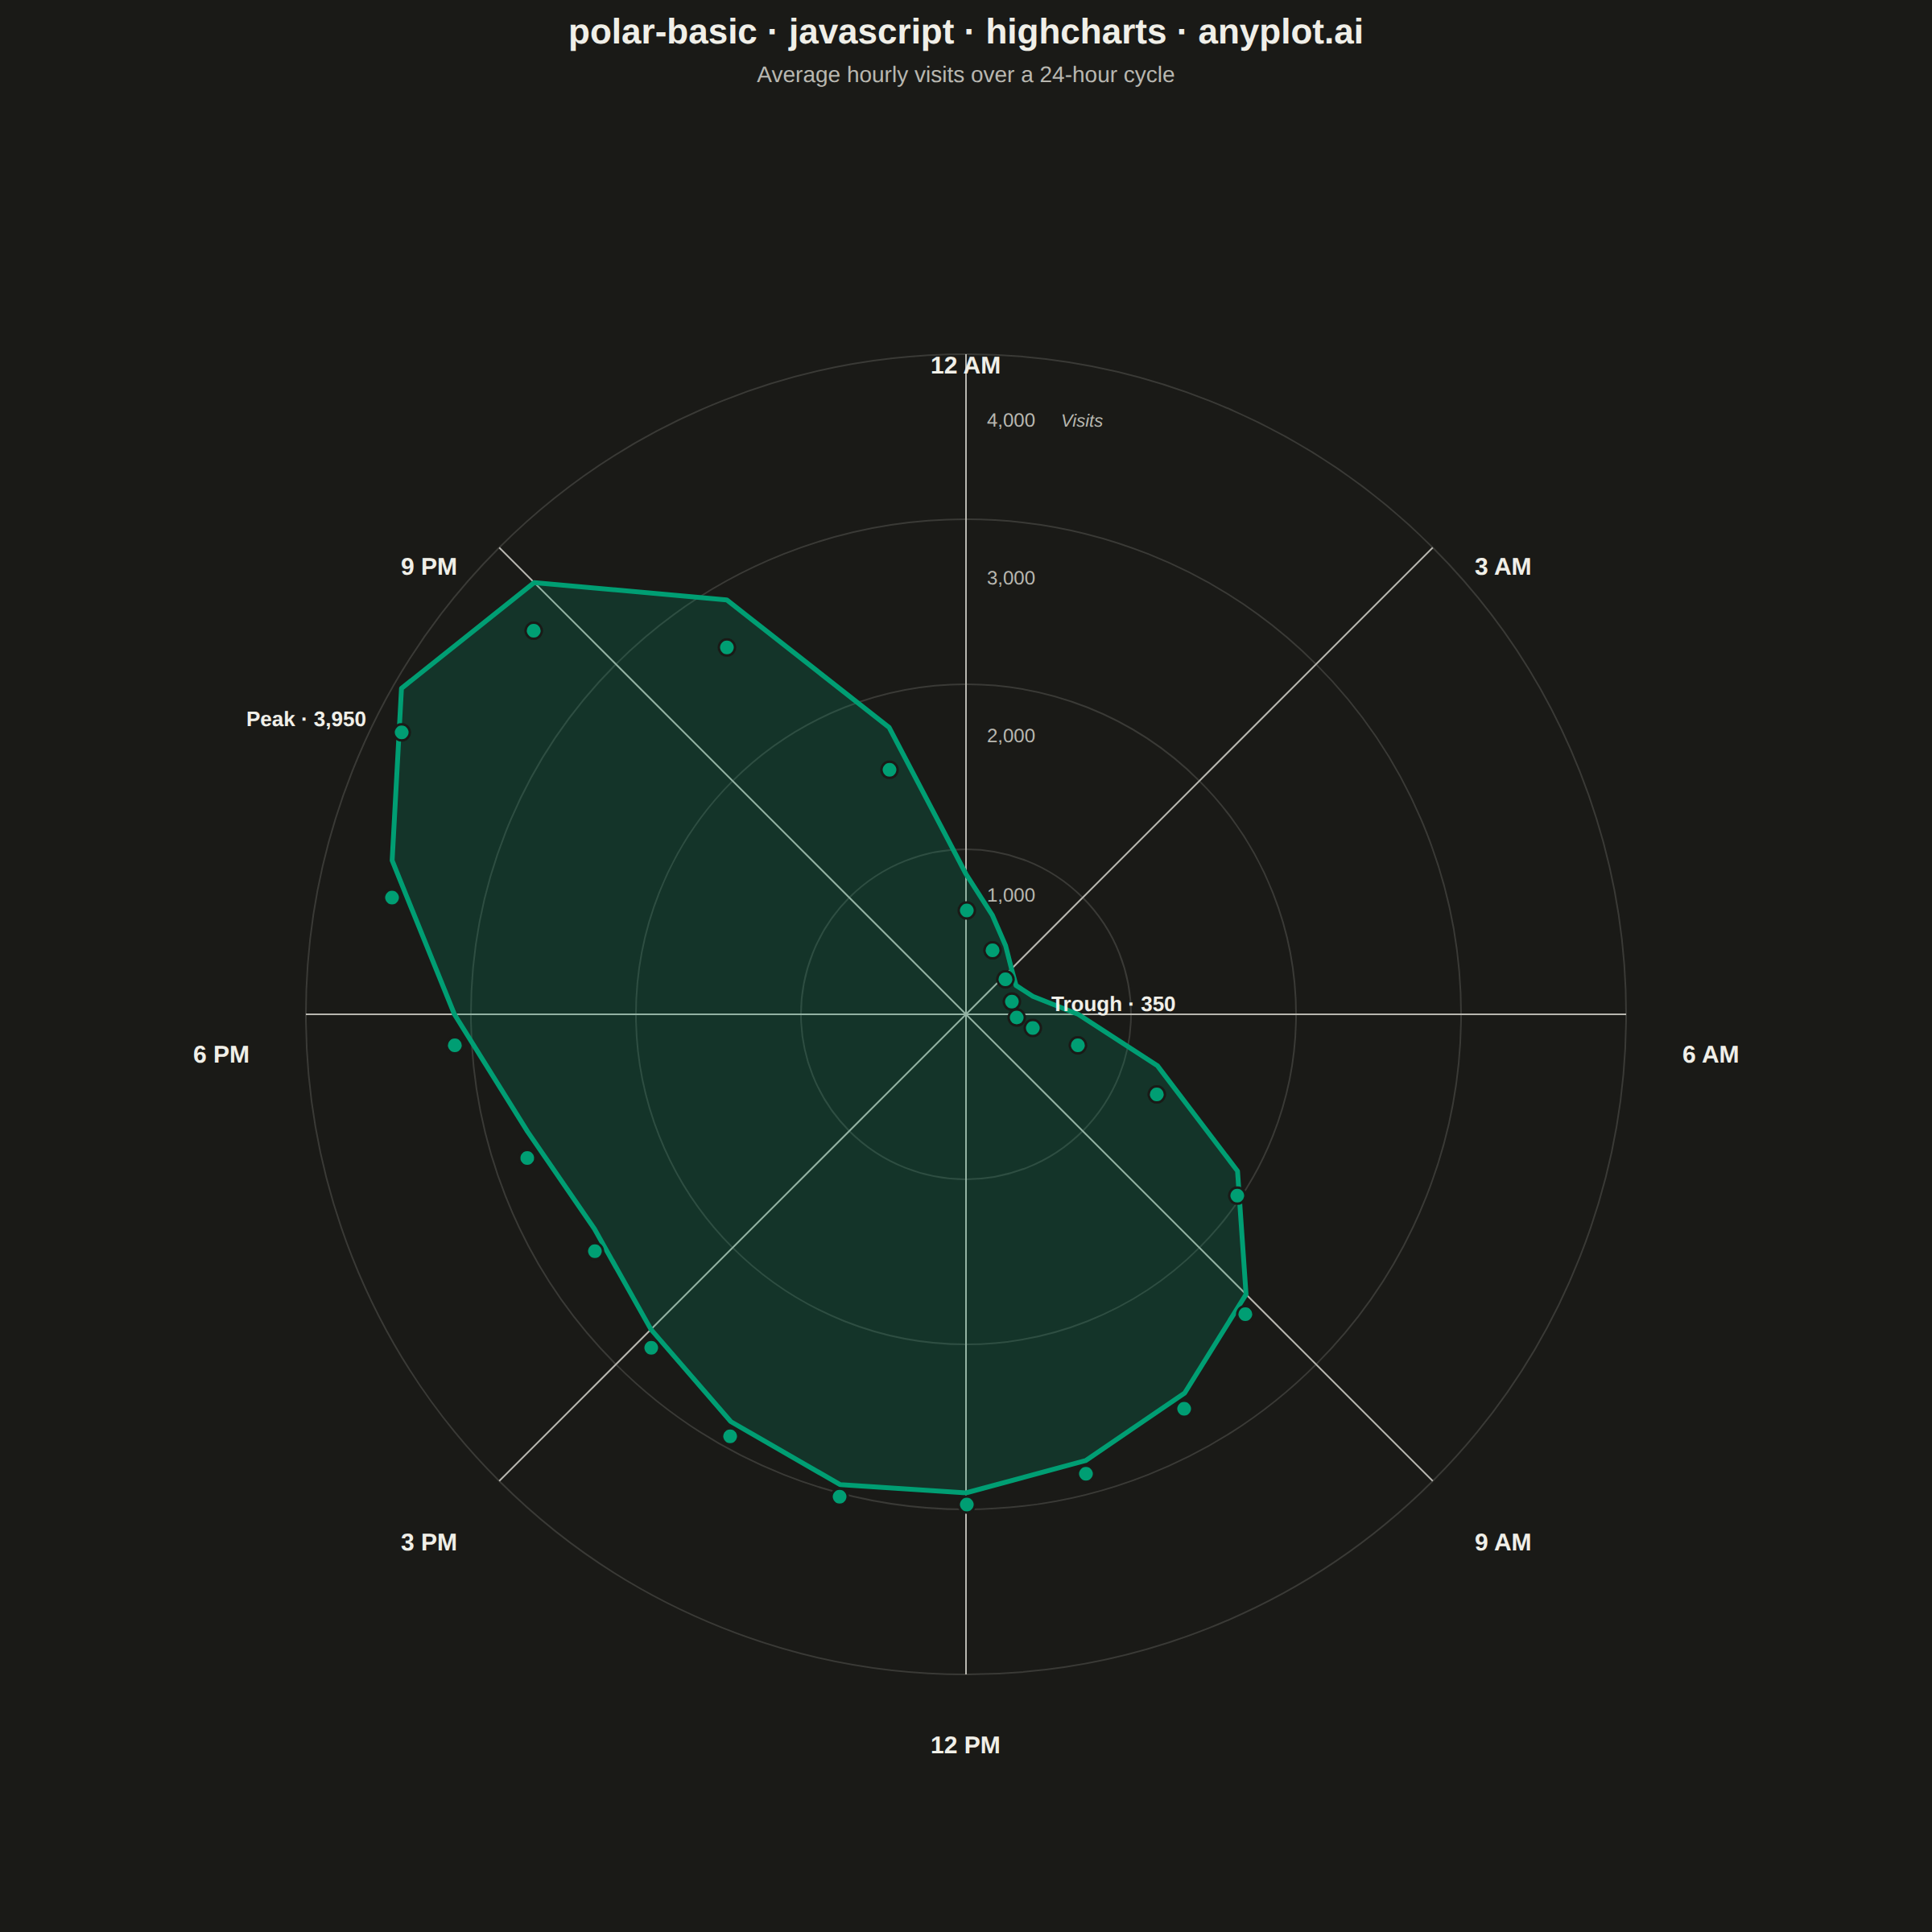
A polar chart displays data points on a circular coordinate system where position is determined by angle (theta) and distance from center (radius). This visualization is ideal for cyclical patterns, directional data, or any dataset where angular relationships are meaningful. It reveals periodic trends and directional distributions that would be obscured in Cartesian coordinates.
// anyplot.ai
// polar-basic: Basic Polar Chart
// Library: highcharts 12.6.0 | JavaScript 22.23.1
// Quality: 89/100 | Updated: 2026-07-25
//# anyplot-orientation: square

// Only the core `highcharts` bundle is loaded (no highcharts-more), so the
// native polar chart type isn't available. We project each (hour, visits)
// polar coordinate to Cartesian ourselves. The grid rings, spokes, and the
// translucent data area still need the core SVG renderer (there is no
// native equivalent without highcharts-more), but the data markers, the
// radial-scale numbers, and the hour labels are all real Highcharts series
// bound to the projected coordinates — native marker/dataLabels APIs
// instead of renderer text/circles — same polar-projection technique the
// radar-basic implementation uses, with more of the chrome on real APIs.
const t = window.ANYPLOT_TOKENS;

// --- Data (average website visits by hour of day, 24-hour cycle) -----------
const HOURS = Array.from({ length: 24 }, (_, i) => i);
const VISITS = [
  850, 620, 480, 390, 350, 420, 680, 1200, 1900, 2400, 2650, 2800, 2900, 2950,
  2850, 2700, 2600, 2750, 3100, 3600, 3950, 3700, 2900, 1800,
];
const MAX_VALUE = 4000;
const RING_LEVELS = [1000, 2000, 3000, 4000];
const SPOKE_HOURS = [0, 3, 6, 9, 12, 15, 18, 21];
const SPOKE_LABELS = ["12 AM", "3 AM", "6 AM", "9 AM", "12 PM", "3 PM", "6 PM", "9 PM"];
const PEAK_HOUR = VISITS.indexOf(Math.max(...VISITS));
const TROUGH_HOUR = VISITS.indexOf(Math.min(...VISITS));

const formatHour = (hour) => {
  const period = hour < 12 ? "AM" : "PM";
  const h12 = hour % 12 === 0 ? 12 : hour % 12;
  return `${h12}:00 ${period}`;
};

const TITLE = "polar-basic · javascript · highcharts · anyplot.ai";
const titleFs = Math.round(22 * Math.min(1, 67 / TITLE.length)) + "px";

// --- Chart (empty core chart used as a canvas for the renderer overlay) ----
const chart = Highcharts.chart("container", {
  chart: {
    backgroundColor: "transparent",
    animation: false,
    style: { fontFamily: "inherit" },
    margin: [150, 90, 90, 90],
  },
  credits: { enabled: false },
  title: {
    text: TITLE,
    style: { color: t.ink, fontSize: titleFs, fontWeight: "600" },
  },
  subtitle: {
    text: "Average hourly visits over a 24-hour cycle",
    style: { color: t.inkSoft, fontSize: "14px" },
  },
  xAxis: { visible: false, gridLineWidth: 0, lineWidth: 0, tickLength: 0 },
  yAxis: { visible: false, gridLineWidth: 0, lineWidth: 0, tickLength: 0 },
  legend: { enabled: false },
  tooltip: {
    enabled: true,
    backgroundColor: t.elevatedBg,
    borderColor: t.grid,
    style: { color: t.ink },
    formatter() {
      return `<b>${this.point.name}</b><br/>${this.point.custom.actualValue.toLocaleString()} visits`;
    },
  },
  plotOptions: { series: { animation: false } },
  series: [],
});

// Fix the (visible: false) axes to a known pixel-space extent so real series
// can be data-bound at the same polar-projected coordinates the renderer
// overlay uses below — this keeps the PNG output stable while giving the
// interactive HTML genuine Highcharts series/tooltip/dataLabels usage.
chart.xAxis[0].setExtremes(0, chart.plotWidth, false);
chart.yAxis[0].setExtremes(0, chart.plotHeight, false);

// --- Geometry ----------------------------------------------------------------
const cx = chart.plotLeft + chart.plotWidth / 2;
const cy = chart.plotTop + chart.plotHeight / 2;
const outerR = Math.min(chart.plotWidth, chart.plotHeight) / 2 - 70;

// hour 0 points straight up (midnight); hours proceed clockwise like a clock face
const angleOf = (hour) => -Math.PI / 2 + (hour / 24) * (2 * Math.PI);
const pointAt = (hour, radiusFrac) => {
  const angle = angleOf(hour);
  return [cx + outerR * radiusFrac * Math.cos(angle), cy + outerR * radiusFrac * Math.sin(angle)];
};
// project a renderer-space [x, y] pixel into the fixed-extent axis coordinates
// the data-bound series below use (yAxis increases upward, so flip y).
const toAxisXY = ([sx, sy]) => [sx - chart.plotLeft, chart.plotTop + chart.plotHeight - sy];

// --- Radial grid rings (no native polar axis without highcharts-more) ----------
RING_LEVELS.forEach((level) => {
  chart.renderer
    .circle(cx, cy, outerR * (level / MAX_VALUE))
    .attr({ stroke: t.grid, "stroke-width": 1, fill: "none", zIndex: 1 })
    .add();
});

// --- Angular spokes (geometry only; hour labels below are a real series) -------
SPOKE_HOURS.forEach((hour) => {
  const [ox, oy] = pointAt(hour, 1);
  chart.renderer
    .path(["M", cx, cy, "L", ox, oy])
    .attr({ stroke: t.inkSoft, "stroke-width": 1, zIndex: 1 })
    .add();
});

// --- Data curve (closed loop — hour 23 wraps back to hour 0) -------------------
const vertices = HOURS.map((hour) => pointAt(hour, VISITS[hour] / MAX_VALUE));
const path = ["M"];
vertices.forEach(([x, y], i) => path.push(...(i === 0 ? [x, y] : ["L", x, y])));
path.push("Z");

chart.renderer
  .path(path)
  .attr({
    fill: t.palette[0],
    "fill-opacity": 0.2,
    stroke: t.palette[0],
    "stroke-width": 3,
    "stroke-linejoin": "round",
    zIndex: 2,
  })
  .add();

// --- Real Highcharts series ---------------------------------------------------
// 1) Hourly visits: native scatter markers at the projected vertices (replaces
//    a manual renderer-circle loop), with the peak/trough called out via the
//    series' own dataLabels API instead of a static annotation.
const hourlyData = HOURS.map((hour, i) => {
  const [ax, ay] = toAxisXY(vertices[i]);
  const point = {
    x: ax,
    y: ay,
    name: formatHour(hour),
    custom: { actualValue: VISITS[hour] },
  };
  if (hour === PEAK_HOUR || hour === TROUGH_HOUR) {
    const angle = angleOf(hour);
    point.dataLabels = {
      enabled: true,
      format: `${hour === PEAK_HOUR ? "Peak" : "Trough"} · ${VISITS[hour].toLocaleString()}`,
      align: Math.cos(angle) >= 0 ? "left" : "right",
      verticalAlign: "middle",
      x: Math.cos(angle) * 20,
      y: Math.sin(angle) * 20,
      style: { color: t.ink, fontSize: "13px", fontWeight: "700", textOutline: "none" },
    };
  }
  return point;
});

chart.addSeries(
  {
    type: "scatter",
    name: "Hourly visits",
    zIndex: 1,
    color: t.palette[0],
    enableMouseTracking: true,
    stickyTracking: false,
    animation: false,
    marker: {
      enabled: true,
      radius: 5,
      fillColor: t.palette[0],
      lineColor: t.pageBg,
      lineWidth: 1.5,
      states: { hover: { enabled: true, radius: 6, lineWidth: 1.5, lineColor: t.pageBg } },
    },
    dataLabels: { enabled: false, crop: false, overflow: "allow" },
    data: hourlyData,
  },
  false
);

// 2) Radial scale: the ring numbers plus one explicit "Visits" unit label
//    (VQ-06), rendered via dataLabels bound to real (invisible-marker) points
//    instead of chart.renderer.text.
const ringLabelData = RING_LEVELS.map((level) => {
  const [ax, ay] = toAxisXY(pointAt(0, level / MAX_VALUE));
  return {
    x: ax,
    y: ay,
    dataLabels: { format: level.toLocaleString(), align: "left", verticalAlign: "middle", x: 8, y: 4 },
  };
});
const [unitAx, unitAy] = toAxisXY(pointAt(0, RING_LEVELS[RING_LEVELS.length - 1] / MAX_VALUE));
ringLabelData.push({
  x: unitAx,
  y: unitAy,
  dataLabels: {
    format: "Visits",
    align: "left",
    verticalAlign: "middle",
    x: 54,
    y: 4,
    style: { color: t.inkSoft, fontSize: "11px", fontStyle: "italic", fontWeight: "400", textOutline: "none" },
  },
});

chart.addSeries(
  {
    type: "scatter",
    name: "Radial scale",
    zIndex: 2,
    enableMouseTracking: false,
    animation: false,
    marker: { enabled: false },
    dataLabels: {
      enabled: true,
      crop: false,
      overflow: "allow",
      style: { color: t.inkSoft, fontSize: "12px", fontWeight: "400", textOutline: "none" },
    },
    data: ringLabelData,
  },
  false
);

// 3) Hour of day: the 8 compass-style hour labels, again via dataLabels bound
//    to real points instead of chart.renderer.text.
const hourLabelData = SPOKE_HOURS.map((hour, i) => {
  const angle = angleOf(hour);
  const cos = Math.cos(angle);
  const sin = Math.sin(angle);
  const [ax, ay] = toAxisXY(pointAt(hour, 1 + 30 / outerR));
  const align = cos > 0.3 ? "left" : cos < -0.3 ? "right" : "center";
  return {
    x: ax,
    y: ay,
    dataLabels: { format: SPOKE_LABELS[i], align, verticalAlign: "middle", y: sin * 6 + 5 },
  };
});

chart.addSeries(
  {
    type: "scatter",
    name: "Hour of day",
    zIndex: 3,
    enableMouseTracking: false,
    animation: false,
    marker: { enabled: false },
    dataLabels: {
      enabled: true,
      crop: false,
      overflow: "allow",
      style: { color: t.ink, fontSize: "15px", fontWeight: "600", textOutline: "none" },
    },
    data: hourLabelData,
  },
  false
);

chart.redraw();
Runnable source as JSON, for any HTTP client: https://api.anyplot.ai/specs/polar-basic/highcharts/code. Any spec id and library id listed in llms-full.txt fit the same URL shape; every URL below is complete and callable.
{
  "spec_id": "polar-basic",
  "language": "javascript",
  "library": "highcharts",
  "page": "https://anyplot.ai/polar-basic/javascript/highcharts",
  "hub": "https://anyplot.ai/polar-basic",
  "code_json": "https://api.anyplot.ai/specs/polar-basic/highcharts/code",
  "spec_json": "https://api.anyplot.ai/specs/polar-basic",
  "render_light_png": "https://storage.googleapis.com/anyplot-images/plots/polar-basic/javascript/highcharts/plot-light.png",
  "render_dark_png": "https://storage.googleapis.com/anyplot-images/plots/polar-basic/javascript/highcharts/plot-dark.png",
  "interactive_light_html": "https://storage.googleapis.com/anyplot-images/plots/polar-basic/javascript/highcharts/plot-light.html",
  "interactive_dark_html": "https://storage.googleapis.com/anyplot-images/plots/polar-basic/javascript/highcharts/plot-dark.html",
  "quality_score": 89.0,
  "license": "MIT",
  "guide": "https://anyplot.ai/llms.txt"
}
Part of Basic Polar Chart on anyplot.ai.