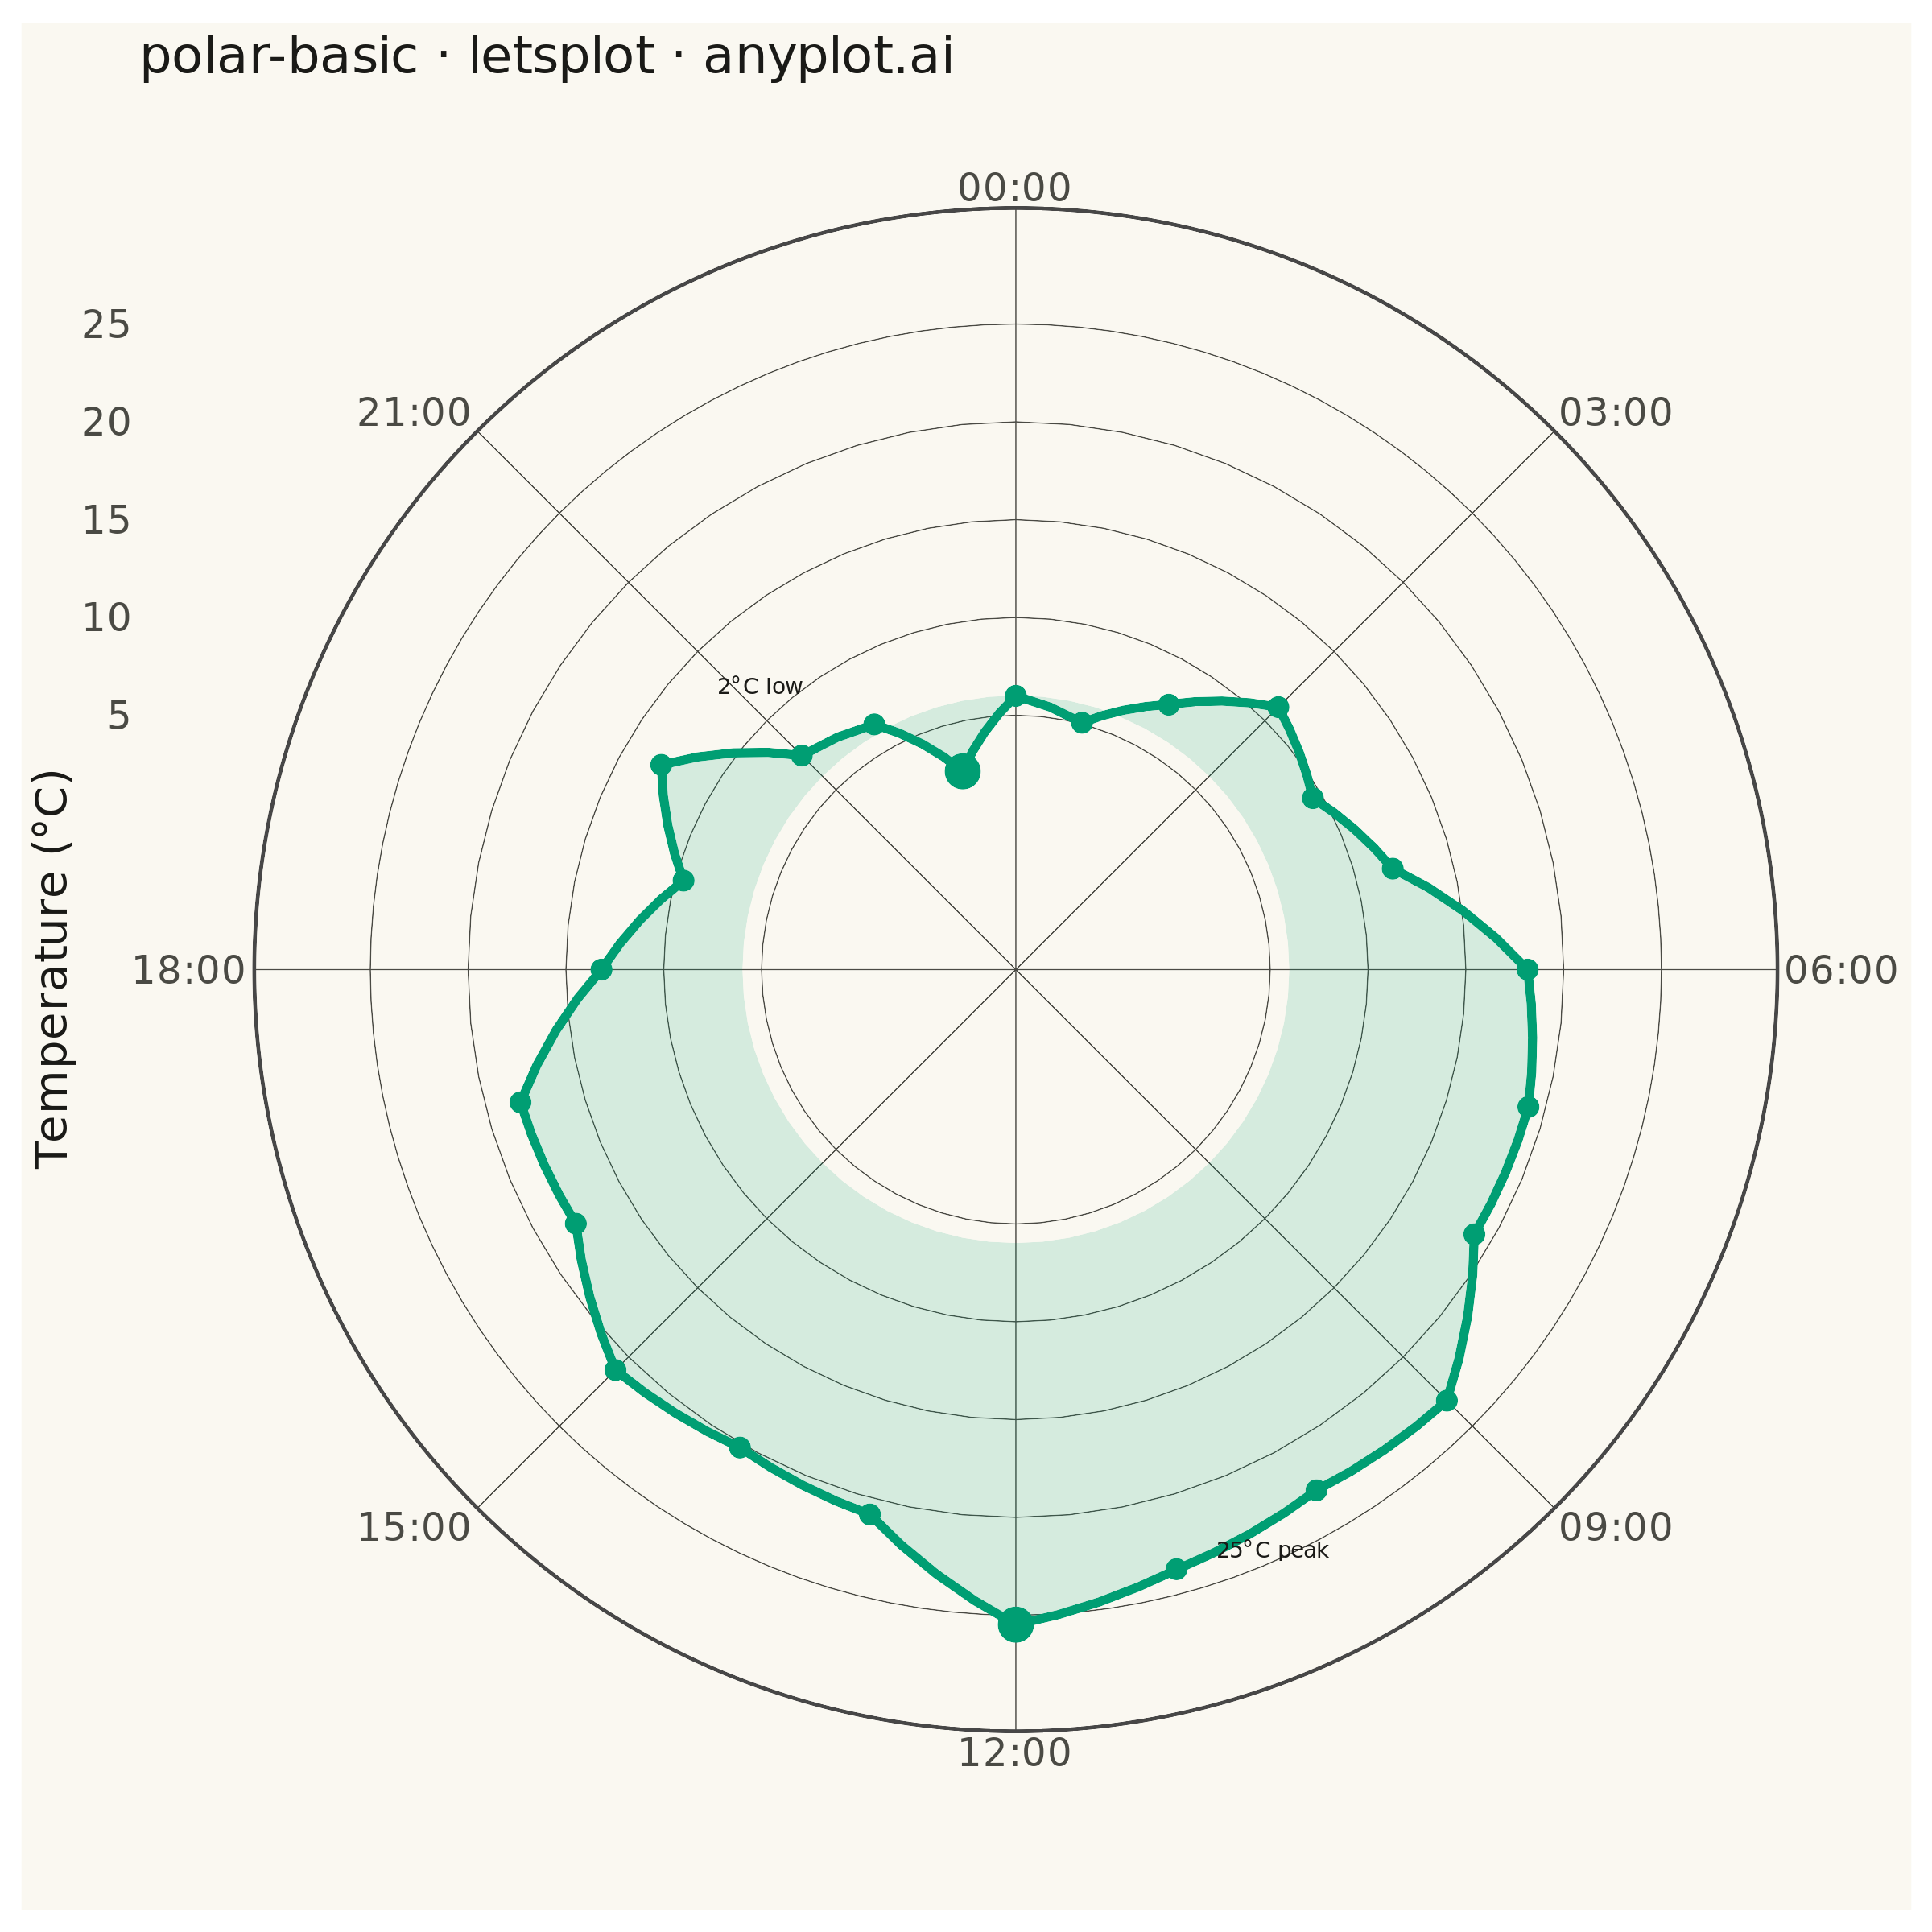
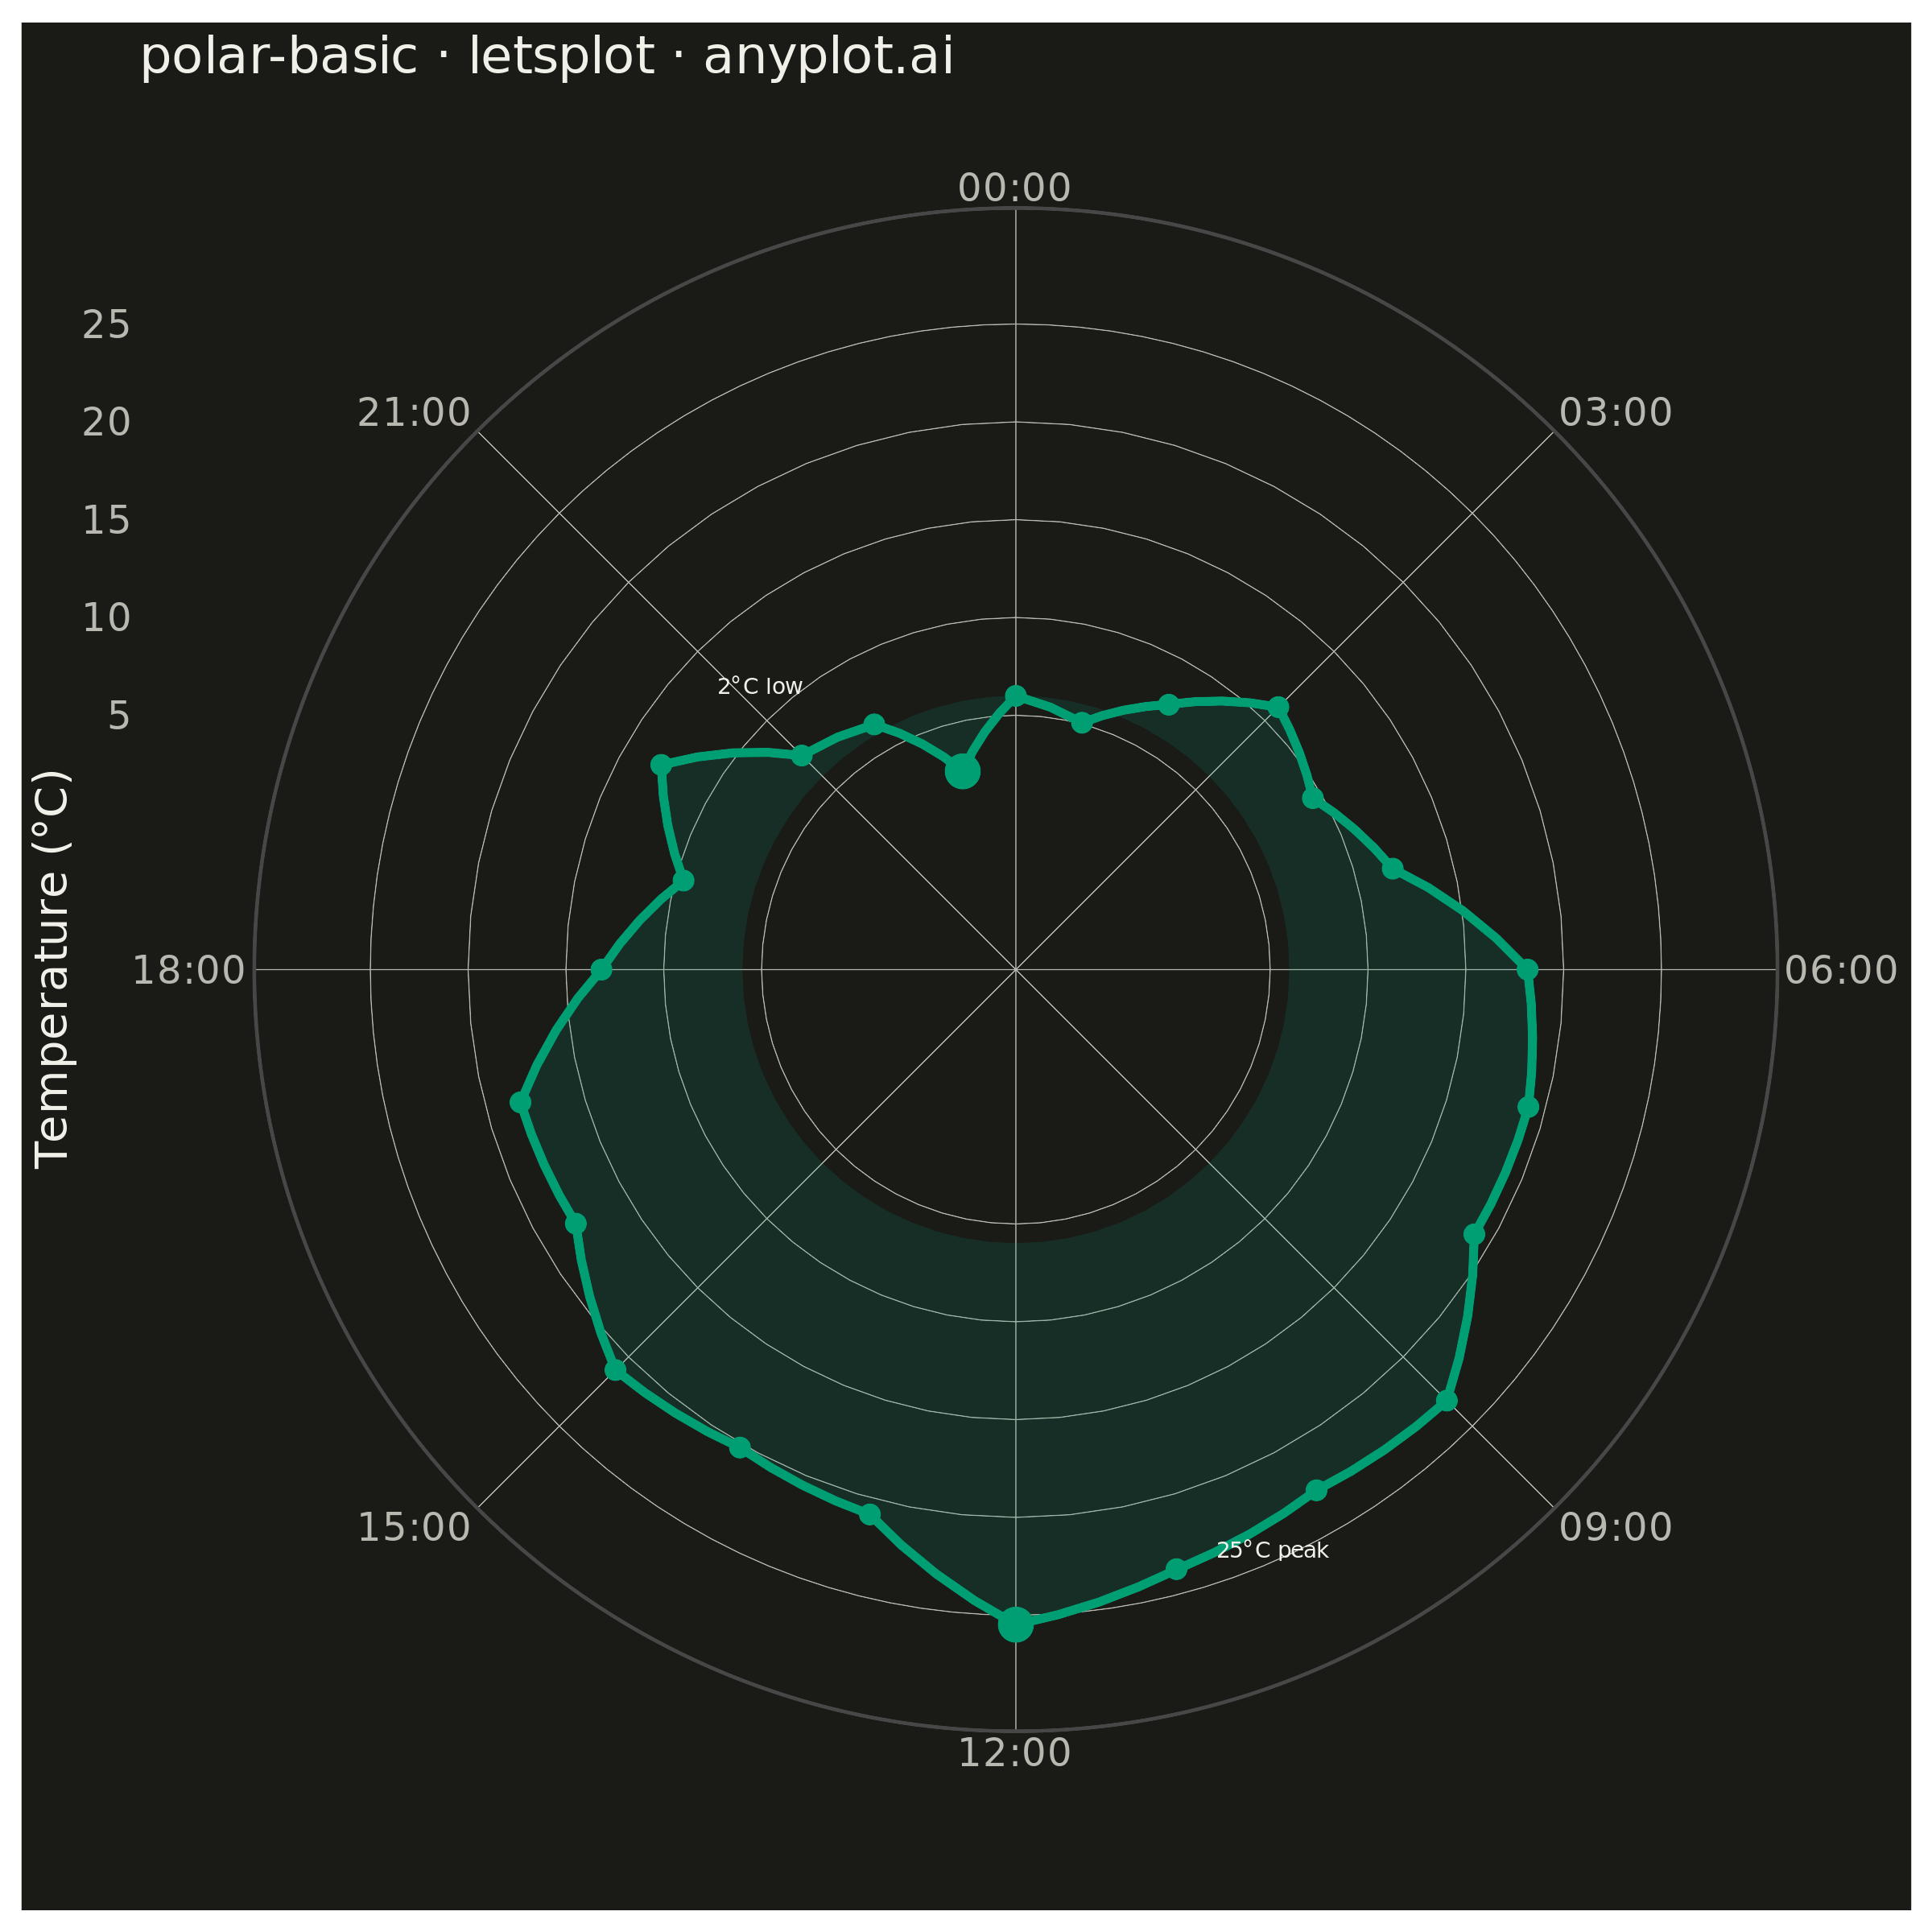
A polar chart displays data points on a circular coordinate system where position is determined by angle (theta) and distance from center (radius). This visualization is ideal for cyclical patterns, directional data, or any dataset where angular relationships are meaningful. It reveals periodic trends and directional distributions that would be obscured in Cartesian coordinates.
""" anyplot.ai
polar-basic: Basic Polar Chart
Library: letsplot 4.11.0 | Python 3.13.14
Quality: 89/100 | Updated: 2026-07-24
"""

import math
import os

import numpy as np
import pandas as pd
from lets_plot import (
    LetsPlot,
    aes,
    coord_polar,
    element_blank,
    element_line,
    element_rect,
    element_text,
    geom_path,
    geom_point,
    geom_polygon,
    geom_text,
    ggplot,
    ggsize,
    labs,
    layer_tooltips,
    position_nudge,
    scale_x_continuous,
    scale_y_continuous,
    theme,
)
from lets_plot.export import ggsave


LetsPlot.setup_html()

# Theme tokens (Imprint palette — theme-adaptive chrome)
THEME = os.getenv("ANYPLOT_THEME", "light")
PAGE_BG = "#FAF8F1" if THEME == "light" else "#1A1A17"
INK = "#1A1A17" if THEME == "light" else "#F0EFE8"
INK_SOFT = "#4A4A44" if THEME == "light" else "#B8B7B0"
BRAND = "#009E73"  # Imprint palette position 1

# Data - hourly temperature readings over a 24-hour diurnal cycle
np.random.seed(42)
hours = np.arange(0, 24)
base_temp = 15 + 10 * np.sin((hours - 6) * math.pi / 12)
temperatures = base_temp + np.random.randn(24) * 2

df = pd.DataFrame({"hour": hours, "temperature": temperatures})
# Duplicate the first point at hour=24 to close the loop in polar coordinates
df_path = pd.concat([df, df.iloc[[0]].assign(hour=24)], ignore_index=True)

# Focal points — call out the diurnal peak and overnight low
peak = df.loc[df["temperature"].idxmax()]
trough = df.loc[df["temperature"].idxmin()]
highlights = pd.DataFrame(
    {
        "hour": [peak["hour"], trough["hour"]],
        "temperature": [peak["temperature"], trough["temperature"]],
        "label": [f"{peak['temperature']:.0f}°C peak", f"{trough['temperature']:.0f}°C low"],
    }
)
peak_label = highlights.iloc[[0]]
trough_label = highlights.iloc[[1]]

# Hour labels at standard 3-hour intervals
hour_breaks = [0, 3, 6, 9, 12, 15, 18, 21]
hour_labels = ["00:00", "03:00", "06:00", "09:00", "12:00", "15:00", "18:00", "21:00"]

# Donut-hole radial scale: the lower limit sits well below the coldest reading so
# no hour collapses onto the origin where the 8 angular gridlines converge.
radius_breaks = [5, 10, 15, 20, 25]
radius_limits = [-8, 29]

# Distinctive lets-plot touch: formatted hover tooltips on each hourly reading
point_tooltips = (
    layer_tooltips()
    .format("@hour", "{}:00")
    .format("@temperature", ".1f")
    .line("Hour|@hour")
    .line("Temperature|@temperature°C")
)

# Theme
anyplot_theme = theme(
    plot_background=element_rect(fill=PAGE_BG, color=PAGE_BG),
    panel_background=element_rect(fill=PAGE_BG),
    panel_grid_major=element_line(color=INK_SOFT, size=0.3),
    panel_grid_minor=element_blank(),
    axis_title=element_text(color=INK, size=14),
    axis_text=element_text(color=INK_SOFT, size=12),
    axis_ticks=element_blank(),
    axis_line=element_blank(),
    plot_title=element_text(color=INK, size=16),
)

# Plot using coord_polar for an idiomatic lets-plot polar chart
plot = (
    ggplot(df_path, aes(x="hour", y="temperature"))
    + geom_polygon(fill=BRAND, color=BRAND, size=0, alpha=0.15)
    + geom_path(color=BRAND, size=1.2)
    + geom_point(data=df, color=BRAND, size=3, tooltips=point_tooltips)
    + geom_point(data=highlights, color=BRAND, size=5)
    + geom_text(data=peak_label, mapping=aes(label="label"), color=INK, size=3.5, position=position_nudge(x=-1.6, y=-1))
    + geom_text(
        data=trough_label, mapping=aes(label="label"), color=INK, size=3.5, position=position_nudge(x=-1.8, y=9)
    )
    + scale_x_continuous(breaks=hour_breaks, labels=hour_labels, limits=[0, 24], expand=[0, 0])
    + scale_y_continuous(breaks=radius_breaks, limits=radius_limits, expand=[0, 0])
    + coord_polar(theta="x", start=0, direction=1)
    + labs(title="polar-basic · letsplot · anyplot.ai", x="", y="Temperature (°C)")
    + ggsize(600, 600)
    + anyplot_theme
)

# Save
ggsave(plot, f"plot-{THEME}.png", path=".", scale=4)
ggsave(plot, f"plot-{THEME}.html", path=".")
Runnable source as JSON, for any HTTP client: https://api.anyplot.ai/specs/polar-basic/letsplot/code. Any spec id and library id listed in llms-full.txt fit the same URL shape; every URL below is complete and callable.
{
  "spec_id": "polar-basic",
  "language": "python",
  "library": "letsplot",
  "page": "https://anyplot.ai/polar-basic/python/letsplot",
  "hub": "https://anyplot.ai/polar-basic",
  "code_json": "https://api.anyplot.ai/specs/polar-basic/letsplot/code",
  "spec_json": "https://api.anyplot.ai/specs/polar-basic",
  "render_light_png": "https://storage.googleapis.com/anyplot-images/plots/polar-basic/python/letsplot/plot-light.png",
  "render_dark_png": "https://storage.googleapis.com/anyplot-images/plots/polar-basic/python/letsplot/plot-dark.png",
  "interactive_light_html": "https://storage.googleapis.com/anyplot-images/plots/polar-basic/python/letsplot/plot-light.html",
  "interactive_dark_html": "https://storage.googleapis.com/anyplot-images/plots/polar-basic/python/letsplot/plot-dark.html",
  "quality_score": 89.0,
  "license": "MIT",
  "guide": "https://anyplot.ai/llms.txt"
}
Part of Basic Polar Chart on anyplot.ai.