The same plot in 14 other libraries — JavaScript: Chart.js, D3.js, Apache ECharts, Highcharts; Python: Altair, Bokeh, lets-plot, Matplotlib, Plotly, plotnine, Pygal, Seaborn; R: ggplot2; Julia: Makie.jl. Compare all 15 side by side: Basic Polar Chart in Python, R, Julia and JavaScript.
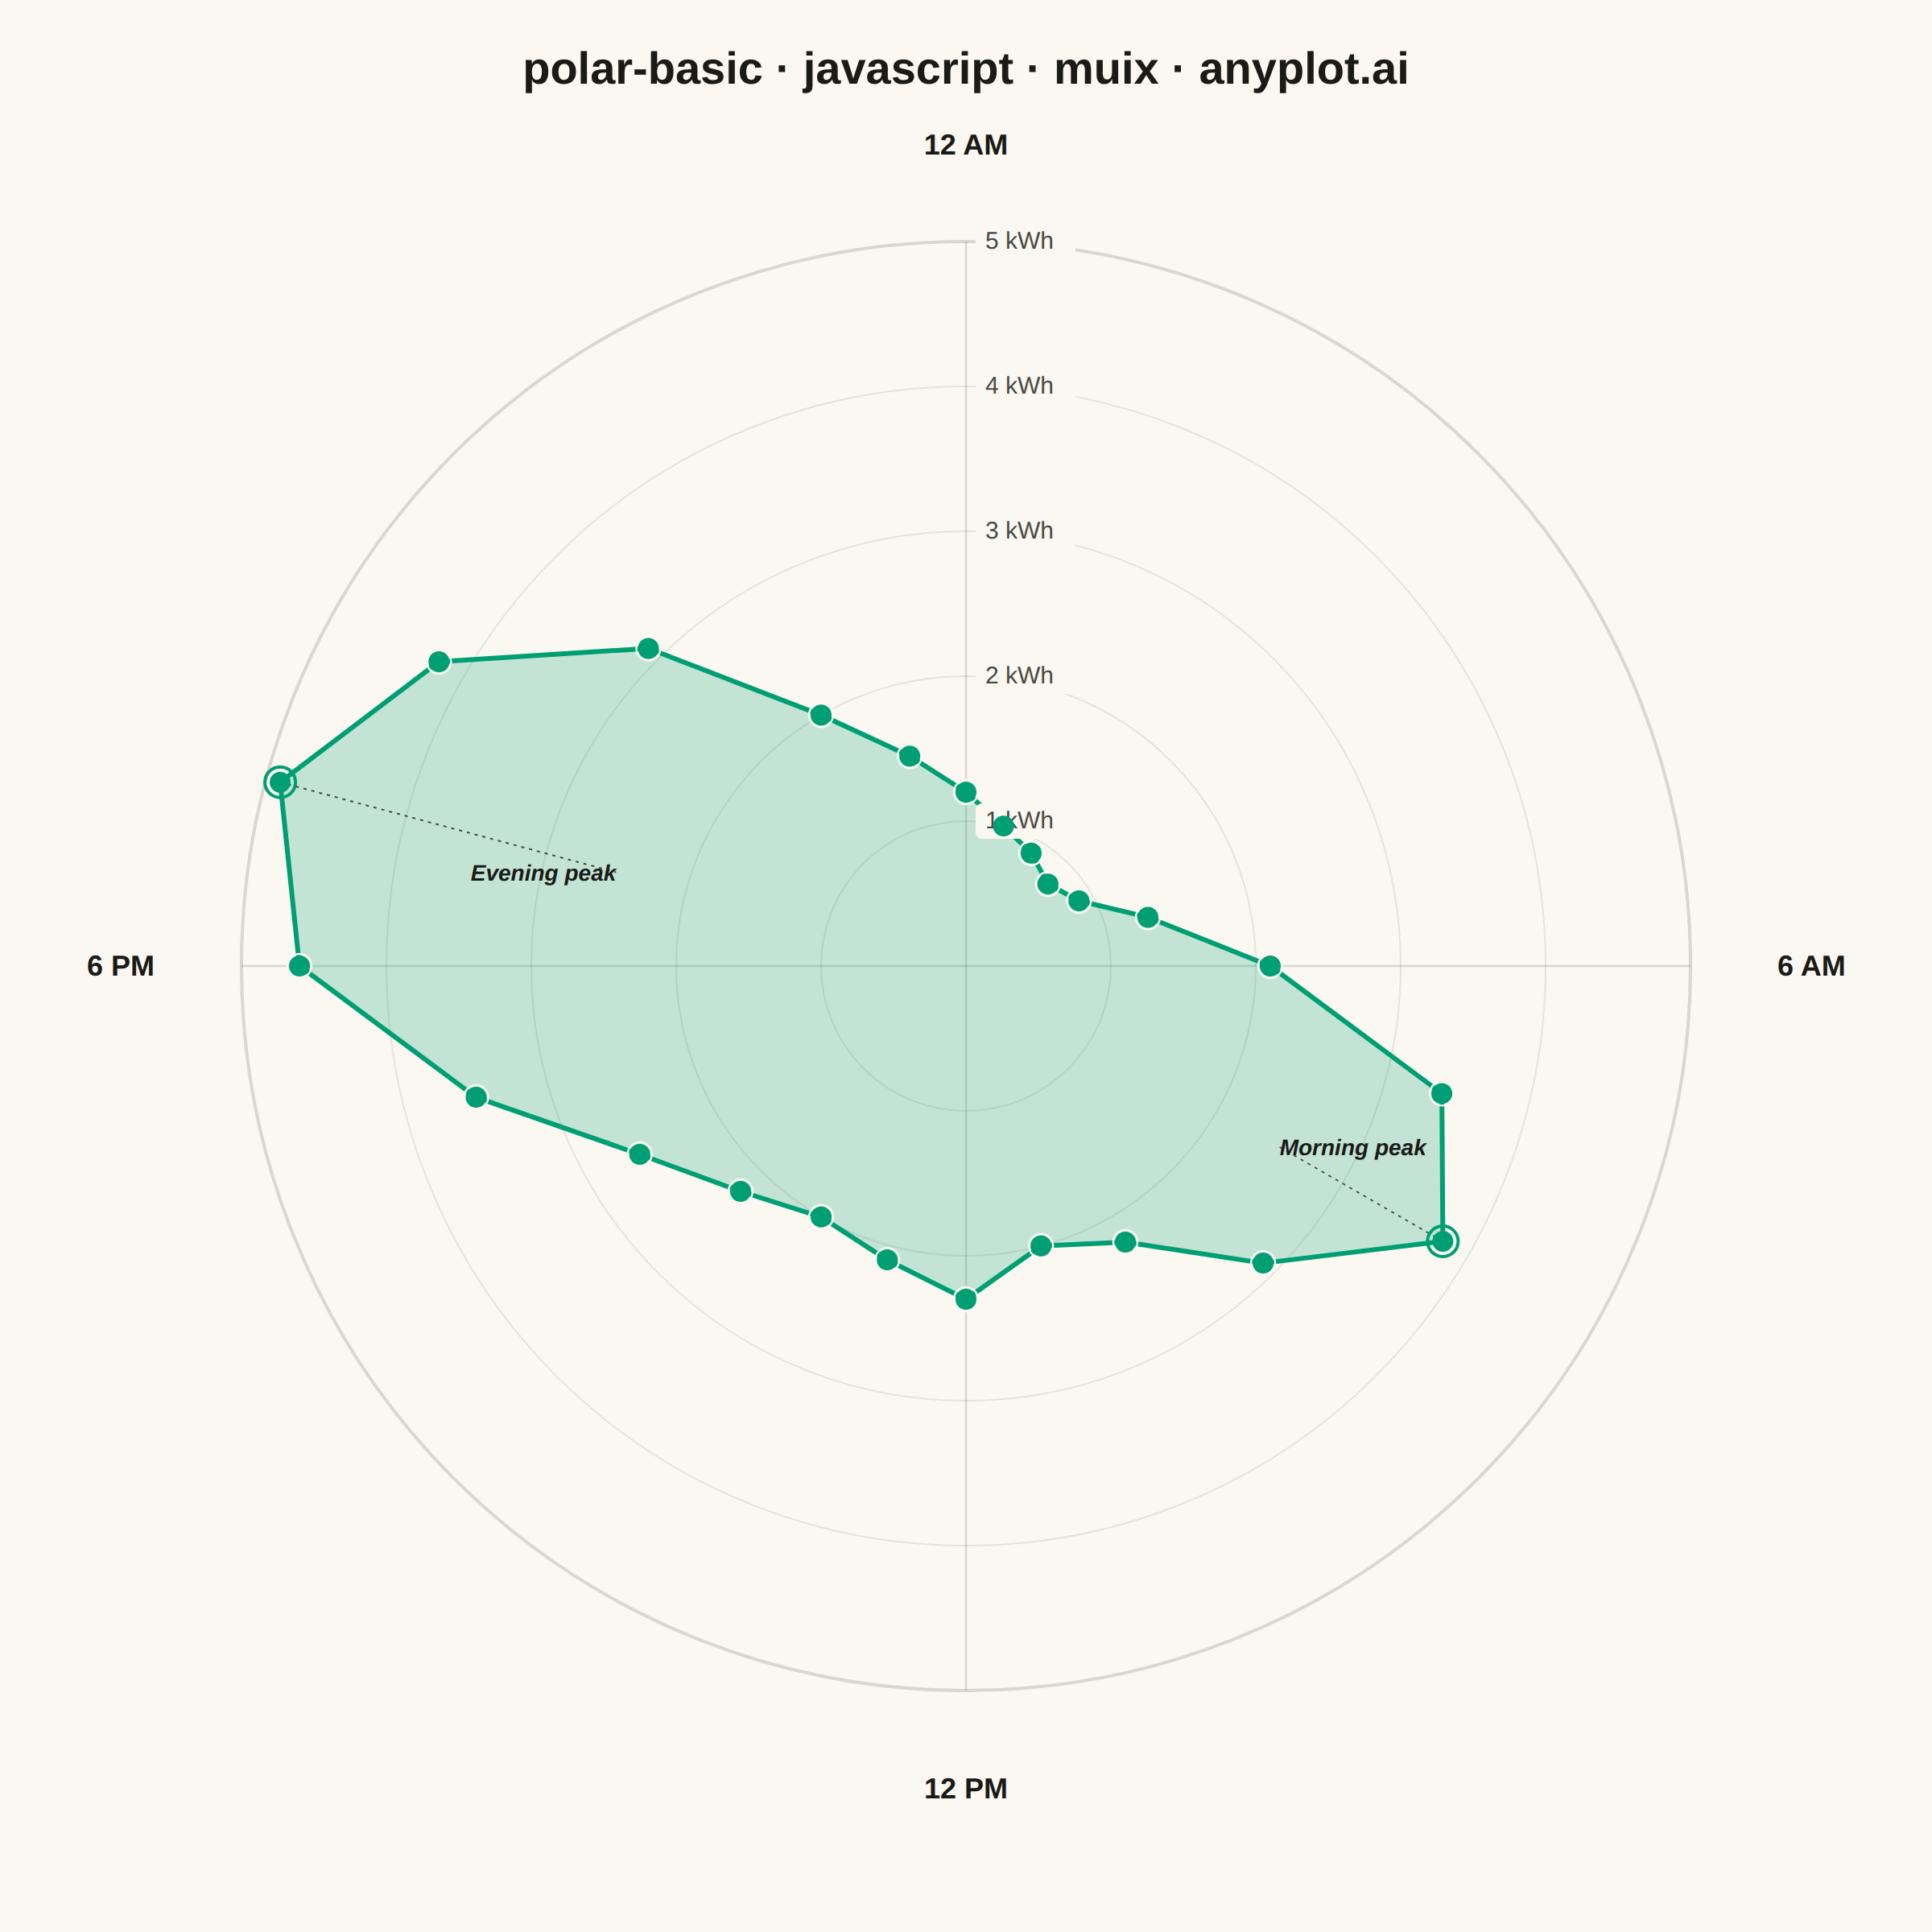
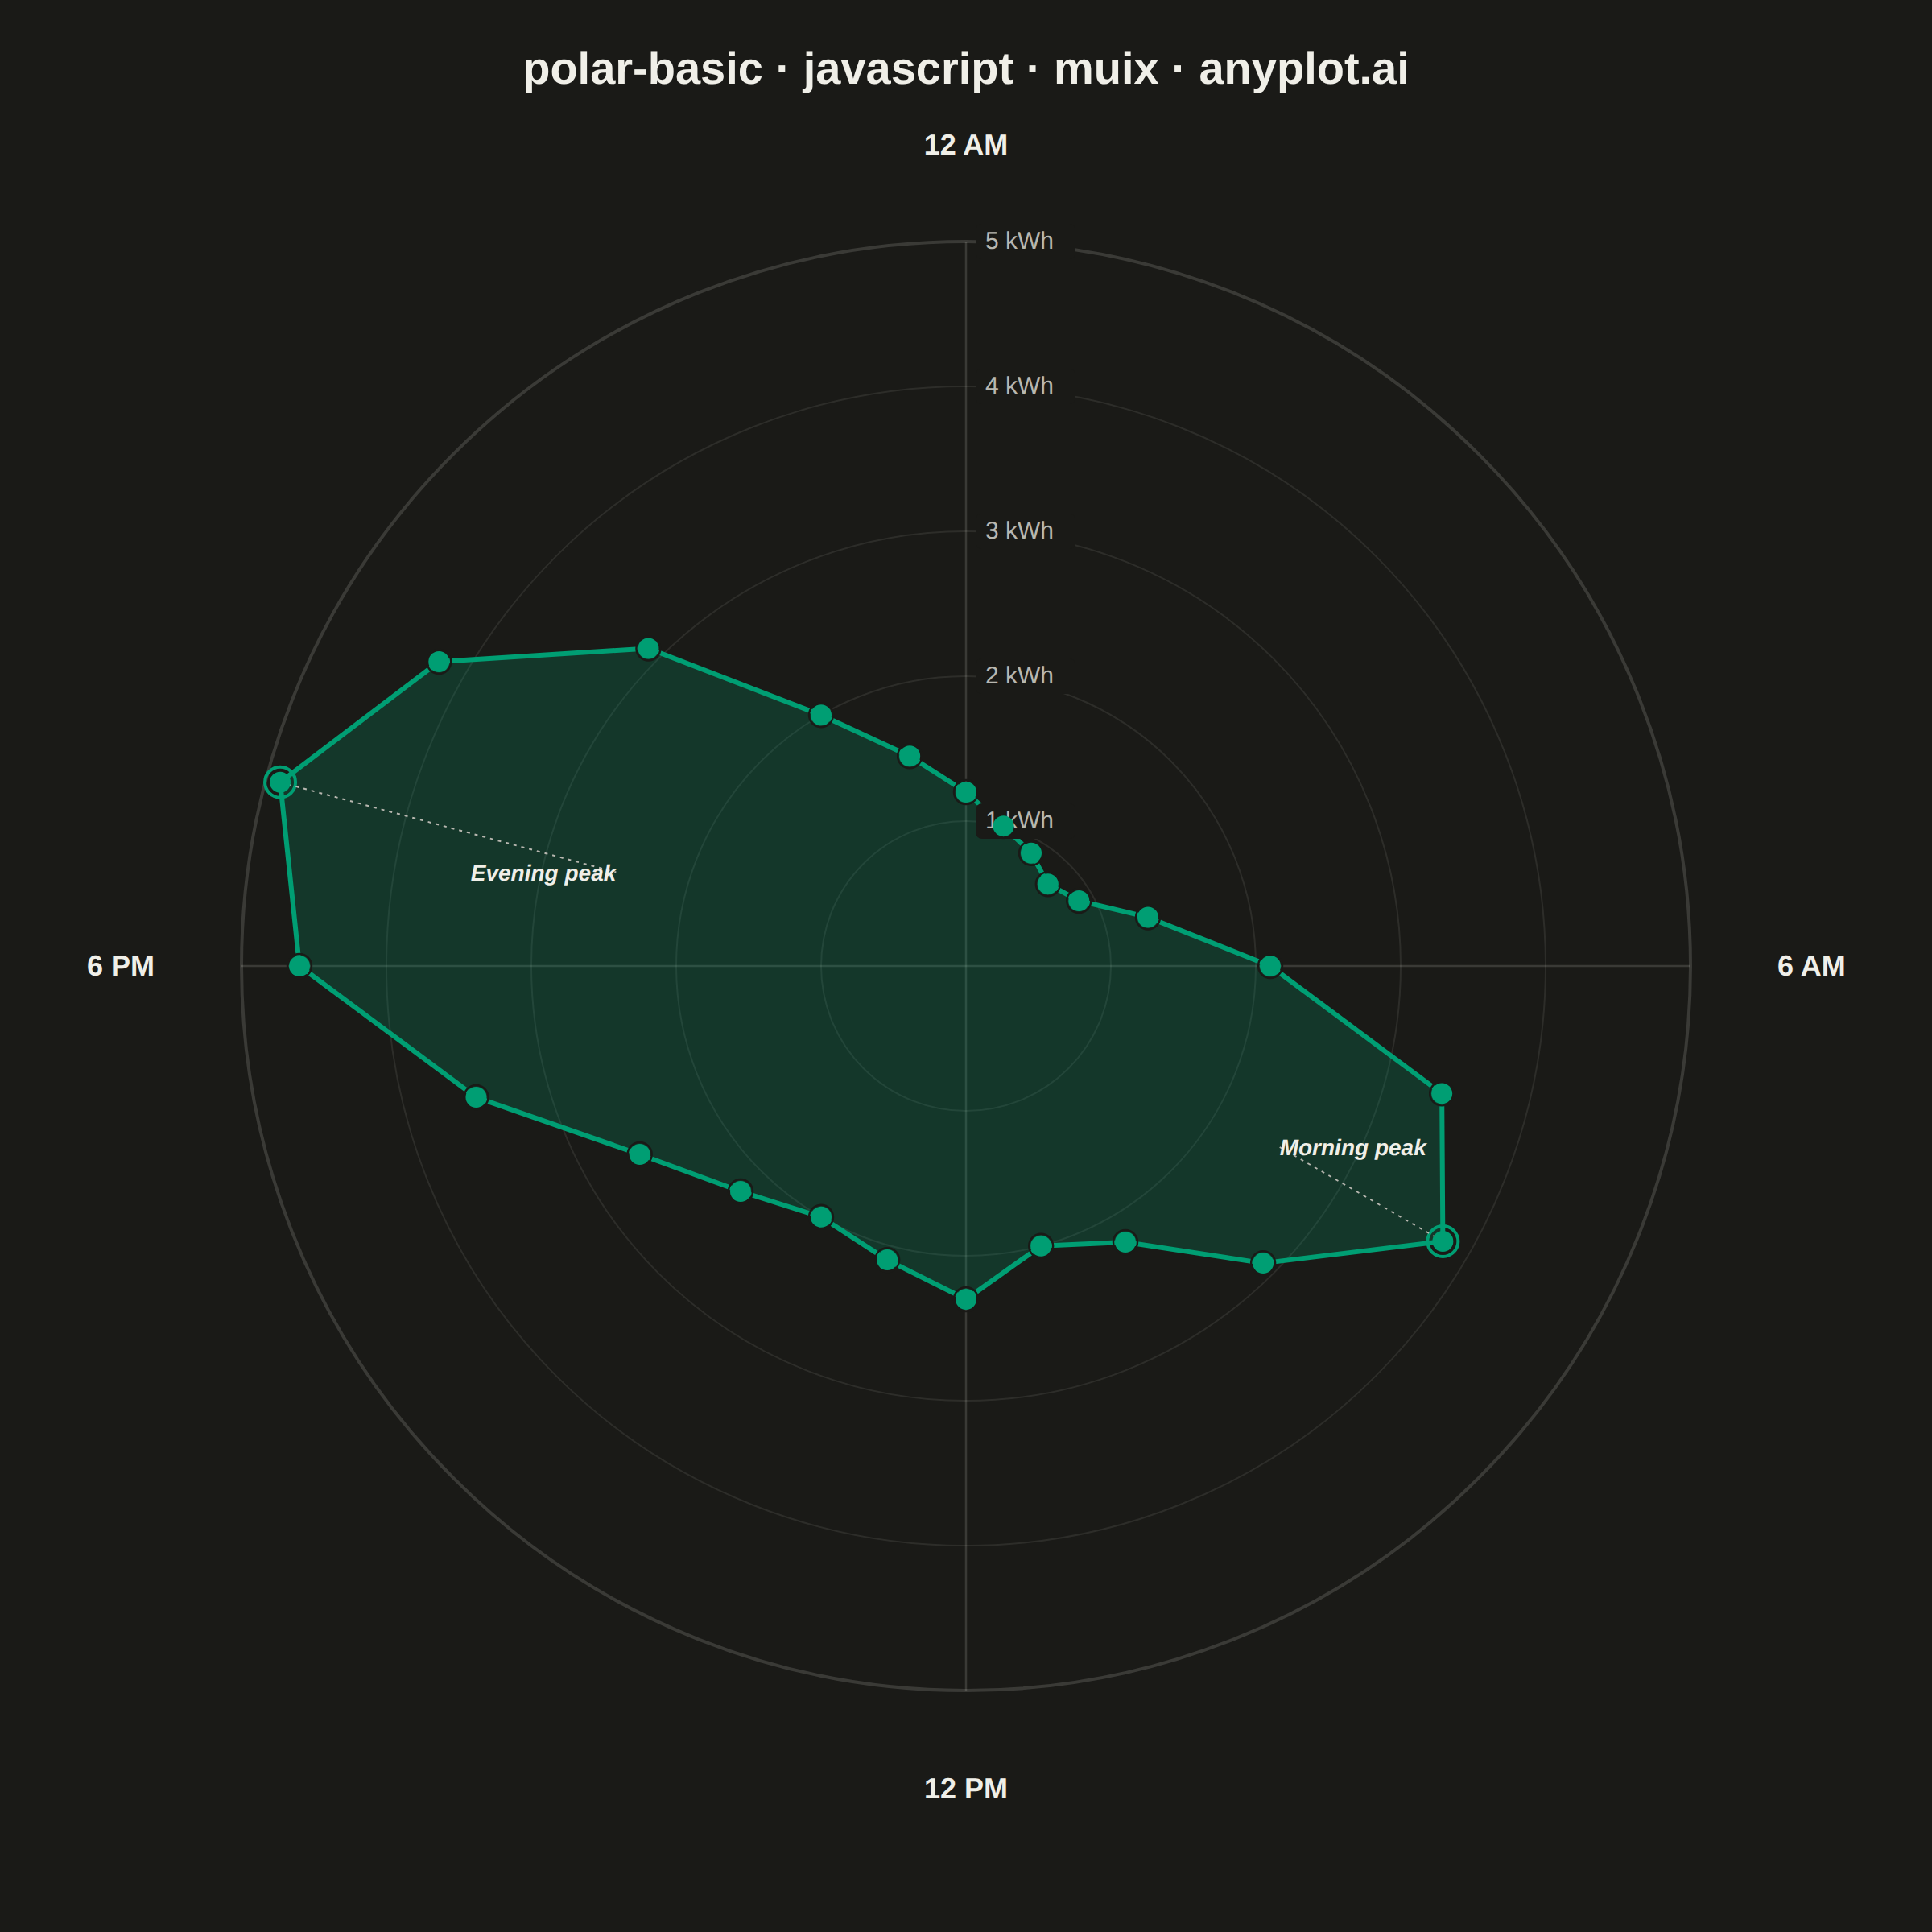
A polar chart displays data points on a circular coordinate system where position is determined by angle (theta) and distance from center (radius). This visualization is ideal for cyclical patterns, directional data, or any dataset where angular relationships are meaningful. It reveals periodic trends and directional distributions that would be obscured in Cartesian coordinates.
// anyplot.ai
// polar-basic: Basic Polar Chart
// Library: muix 7.29.1 | JavaScript 22.23.1
// Quality: 91/100 | Updated: 2026-07-25
//# anyplot-orientation: square
import { ChartContainer } from "@mui/x-charts/ChartContainer";
import { ScatterPlot } from "@mui/x-charts/ScatterChart";
import { ChartsTooltip } from "@mui/x-charts/ChartsTooltip";
import { useDrawingArea } from "@mui/x-charts/hooks";

// @mui/x-charts 7.x community has no polar/radial chart component (a PolarProvider
// exists internally but isn't part of the public export surface), so the polar
// plot is composed on MUI X's own charting surface: ChartContainer sizes the
// <svg> + theme, and useDrawingArea() gives the plot rect the custom ring/spoke/
// polygon geometry is mapped onto. The 24 hourly points are ALSO registered as a
// genuine `scatter` series (mapped through a matching linear xAxis/yAxis so the
// pixels line up exactly with the hand-drawn geometry) so ChartsTooltip and MUI's
// own hover-highlight are real, not decorative — nothing here is faked chrome.

const t = window.ANYPLOT_TOKENS;
const size = window.ANYPLOT_SIZE;

// Theme-adaptive chrome (ThemeProvider handles MUI text; these are for our SVG).
const INK = t.ink;
const INK_SOFT = t.inkSoft;
const GRID = t.grid;
const PAGE_BG = t.pageBg;
const BRAND = t.palette[0]; // Imprint palette position 1 — always first series

// --- Data (in-memory, deterministic) -------------------------------------------
// Smart-home electricity draw across a 24h cycle: a commuter-hours morning peak
// and a larger evening peak, low overnight — the cyclical pattern polar coords
// are meant to reveal, invisible as a simple bump in a cartesian line chart.
const HOURS = 24;
const kwh = [
  1.2, 1.0, 0.9, 0.8, 0.9, 1.3, 2.1, 3.4, 3.8, 2.9, 2.2, 2.0, 2.3, 2.1, 2.0, 2.2,
  2.6, 3.5, 4.6, 4.9, 4.2, 3.1, 2.0, 1.5,
];
const MAX_KWH = 5;
const RINGS = [1, 2, 3, 4, 5];
const LABELED_HOURS = [0, 6, 12, 18];
const HOUR_LABELS = { 0: "12 AM", 6: "6 AM", 12: "12 PM", 18: "6 PM" };
// The two daily bulges the circular layout is meant to reveal (morning commute,
// evening peak) — called out explicitly with an accent ring + leader label below.
const PEAKS = [
  { hour: 8, label: "Morning peak" },
  { hour: 19, label: "Evening peak" },
];
const MARKER_R = 6.5;

// Hour 0 points to the top (-90°); angle grows clockwise as the day progresses.
const angleOf = (hour) => (-90 + (hour / HOURS) * 360) * (Math.PI / 180);
const hourLabel = (hour) => {
  const period = hour < 12 ? "AM" : "PM";
  const h12 = hour % 12 === 0 ? 12 : hour % 12;
  return `${h12}:00 ${period}`;
};

// --- Real MUI X scatter series for the hourly points ----------------------------
// A linear xAxis/yAxis pair whose domain is sized so that value 1 (frac = 1, i.e.
// MAX_KWH) lands exactly `DATA_R` px from centre — the same radius the hand-drawn
// rings/polygon below use (both derive from the same MARGIN/size constants) — so
// the real MUI scatter dots register precisely on top of the custom SVG geometry.
const MARGIN = 90;
const HALF = Math.min(size.width, size.height) / 2 - MARGIN;
const DATA_R = HALF - 60;
const DOMAIN = HALF / DATA_R;
const SERIES_DATA = kwh.map((v, hour) => {
  const a = angleOf(hour);
  const frac = v / MAX_KWH;
  return { x: frac * Math.cos(a), y: -frac * Math.sin(a), id: hour, hour, kwh: v };
});
const SERIES = [
  {
    type: "scatter",
    data: SERIES_DATA,
    color: BRAND,
    markerSize: MARKER_R,
    label: "Electricity draw",
    valueFormatter: (v) => `${hourLabel(v.hour)} · ${v.kwh.toFixed(1)} kWh`,
  },
];

// --- Polar layer: rendered as children inside MUI X's ChartsSurface ------------
function PolarLayer() {
  const area = useDrawingArea();
  const cx = area.left + area.width / 2;
  const cy = area.top + area.height / 2;
  const half = Math.min(area.width, area.height) / 2;
  const R = half - 60; // data radius; margin between R and half holds labels
  const labelR = half - 6;

  const point = (frac, hour) => {
    const a = angleOf(hour);
    return [cx + frac * R * Math.cos(a), cy + frac * R * Math.sin(a)];
  };

  const linePoints = kwh
    .map((v, hour) => point(v / MAX_KWH, hour).join(","))
    .join(" ");

  return (
    <g>
      {/* Concentric radius gridlines, one per kWh ring — outer ring solid,
          inner rings lighter so the nested grid stays subtle near the center */}
      {RINGS.map((level) => (
        <circle
          key={`ring-${level}`}
          cx={cx}
          cy={cy}
          r={(level / MAX_KWH) * R}
          fill="none"
          stroke={GRID}
          strokeWidth={level === MAX_KWH ? 2 : 1}
          strokeOpacity={level === MAX_KWH ? 1 : 0.6}
        />
      ))}

      {/* Angular spokes + labels at the four standard clock positions */}
      {LABELED_HOURS.map((hour) => {
        const [ox, oy] = point(1, hour);
        const a = angleOf(hour);
        const lx = cx + labelR * Math.cos(a);
        const ly = cy + labelR * Math.sin(a);
        const cos = Math.cos(a);
        const anchor = cos > 0.3 ? "start" : cos < -0.3 ? "end" : "middle";
        const sin = Math.sin(a);
        const baseline = sin > 0.5 ? "hanging" : sin < -0.5 ? "auto" : "central";
        return (
          <g key={`spoke-${hour}`}>
            <line x1={cx} y1={cy} x2={ox} y2={oy} stroke={GRID} strokeWidth={1.25} />
            <text
              x={lx}
              y={ly}
              fill={INK}
              fontSize={18}
              fontWeight={600}
              textAnchor={anchor}
              dominantBaseline={baseline}
            >
              {HOUR_LABELS[hour]}
            </text>
          </g>
        );
      })}

      {/* Closed polygon: translucent fill + solid outline. The hourly markers
          themselves are a real <ScatterPlot> series (sibling of this layer,
          registered on a matching xAxis/yAxis) — this halo ring just gives each
          dot a light separation from the polygon fill/stroke underneath it. */}
      <polygon
        points={linePoints}
        fill={BRAND}
        fillOpacity={0.22}
        stroke={BRAND}
        strokeWidth={3}
        strokeLinejoin="round"
      />
      {kwh.map((v, hour) => {
        const [px, py] = point(v / MAX_KWH, hour);
        const isPeak = PEAKS.some((p) => p.hour === hour);
        return (
          <circle
            key={`halo-${hour}`}
            cx={px}
            cy={py}
            r={isPeak ? MARKER_R + 3 : MARKER_R + 1}
            fill="none"
            stroke={isPeak ? BRAND : PAGE_BG}
            strokeWidth={isPeak ? 2 : 1.2}
          />
        );
      })}

      {/* Explicit callouts for the two daily peaks — a dashed leader from the
          peak point to an italic label, so the story reads immediately instead
          of only being implicit in the polygon's shape. */}
      {PEAKS.map(({ hour, label }) => {
        const a = angleOf(hour);
        const [peakX, peakY] = point(kwh[hour] / MAX_KWH, hour);
        const lx = cx + 0.5 * R * Math.cos(a);
        const ly = cy + 0.5 * R * Math.sin(a);
        const cos = Math.cos(a);
        const anchor = cos > 0.15 ? "start" : cos < -0.15 ? "end" : "middle";
        return (
          <g key={`peak-${hour}`}>
            <line
              x1={peakX}
              y1={peakY}
              x2={lx}
              y2={ly}
              stroke={INK_SOFT}
              strokeWidth={1}
              strokeDasharray="2,3"
            />
            <text
              x={lx}
              y={ly}
              fill={INK}
              fontSize={14}
              fontWeight={600}
              fontStyle="italic"
              textAnchor={anchor}
              dominantBaseline="central"
            >
              {label}
            </text>
          </g>
        );
      })}

      {/* Radius (kWh) tick labels, offset off the top spoke, drawn LAST so they
          sit above the data polygon. Theta is continuous here (unlike a radar
          chart's fixed high-value axis), so the polygon crosses this spoke too
          at low-value hours — each label gets an opaque backing chip to stay
          legible regardless of what's underneath. */}
      {RINGS.map((level) => {
        const ty = cy - (level / MAX_KWH) * R;
        return (
          <g key={`tick-${level}`}>
            <rect x={cx + 6} y={ty - 11} width={62} height={22} rx={4} fill={PAGE_BG} />
            <text
              x={cx + 12}
              y={ty}
              fill={INK_SOFT}
              fontSize={15}
              textAnchor="start"
              dominantBaseline="central"
            >
              {`${level} kWh`}
            </text>
          </g>
        );
      })}
    </g>
  );
}

// --- Title drawn on the surface, then the polar layer ---------------------------
function Chrome() {
  return (
    <text
      x={size.width / 2}
      y={52}
      fill={INK}
      fontSize={28}
      fontWeight={700}
      textAnchor="middle"
    >
      polar-basic · javascript · muix · anyplot.ai
    </text>
  );
}

// --- Chart (default-exported component — the harness mounts it) ----------------
export default function Chart() {
  return (
    <ChartContainer
      width={size.width}
      height={size.height}
      series={SERIES}
      xAxis={[{ scaleType: "linear", min: -DOMAIN, max: DOMAIN }]}
      yAxis={[{ scaleType: "linear", min: -DOMAIN, max: DOMAIN }]}
      margin={{ top: MARGIN, bottom: MARGIN, left: MARGIN, right: MARGIN }}
      skipAnimation
    >
      <Chrome />
      <PolarLayer />
      <ScatterPlot />
      <ChartsTooltip trigger="item" />
    </ChartContainer>
  );
}
Runnable source as JSON, for any HTTP client: https://api.anyplot.ai/specs/polar-basic/muix/code. Any spec id and library id listed in llms-full.txt fit the same URL shape; every URL below is complete and callable.
{
  "spec_id": "polar-basic",
  "language": "javascript",
  "library": "muix",
  "page": "https://anyplot.ai/polar-basic/javascript/muix",
  "hub": "https://anyplot.ai/polar-basic",
  "code_json": "https://api.anyplot.ai/specs/polar-basic/muix/code",
  "spec_json": "https://api.anyplot.ai/specs/polar-basic",
  "render_light_png": "https://storage.googleapis.com/anyplot-images/plots/polar-basic/javascript/muix/plot-light.png",
  "render_dark_png": "https://storage.googleapis.com/anyplot-images/plots/polar-basic/javascript/muix/plot-dark.png",
  "interactive_light_html": "https://storage.googleapis.com/anyplot-images/plots/polar-basic/javascript/muix/plot-light.html",
  "interactive_dark_html": "https://storage.googleapis.com/anyplot-images/plots/polar-basic/javascript/muix/plot-dark.html",
  "quality_score": 91.0,
  "license": "MIT",
  "guide": "https://anyplot.ai/llms.txt"
}
Part of Basic Polar Chart on anyplot.ai.