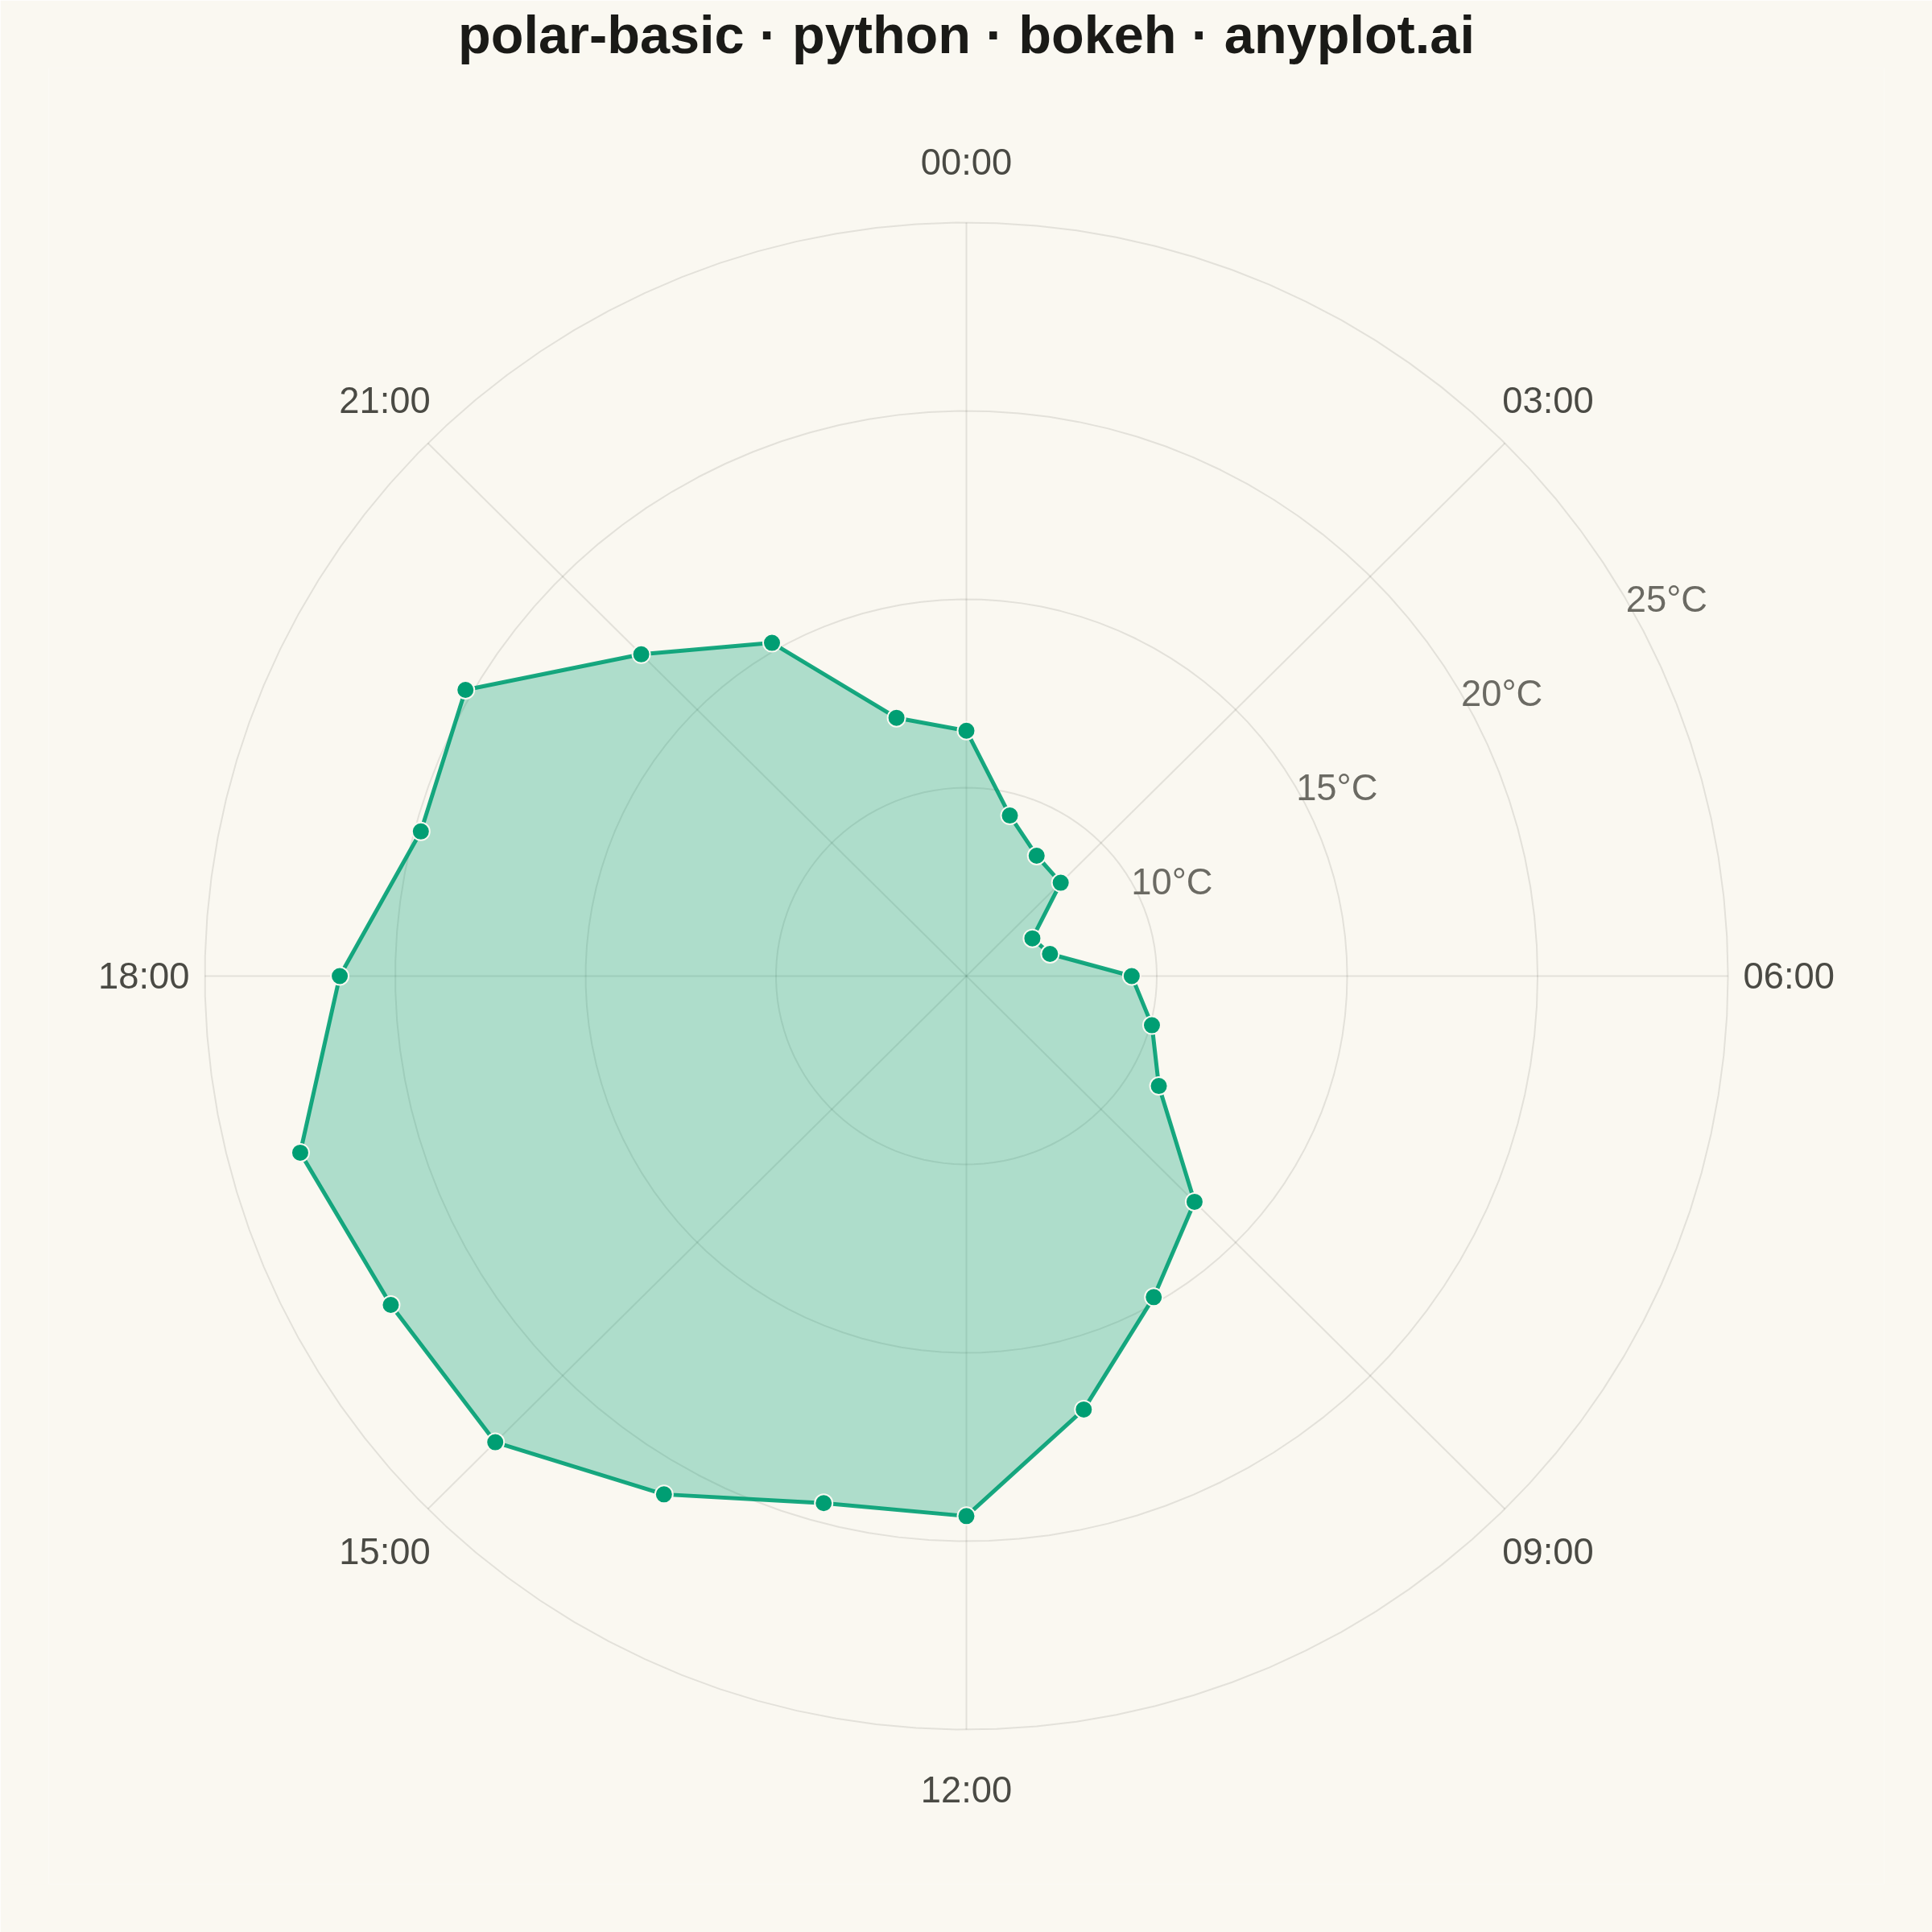
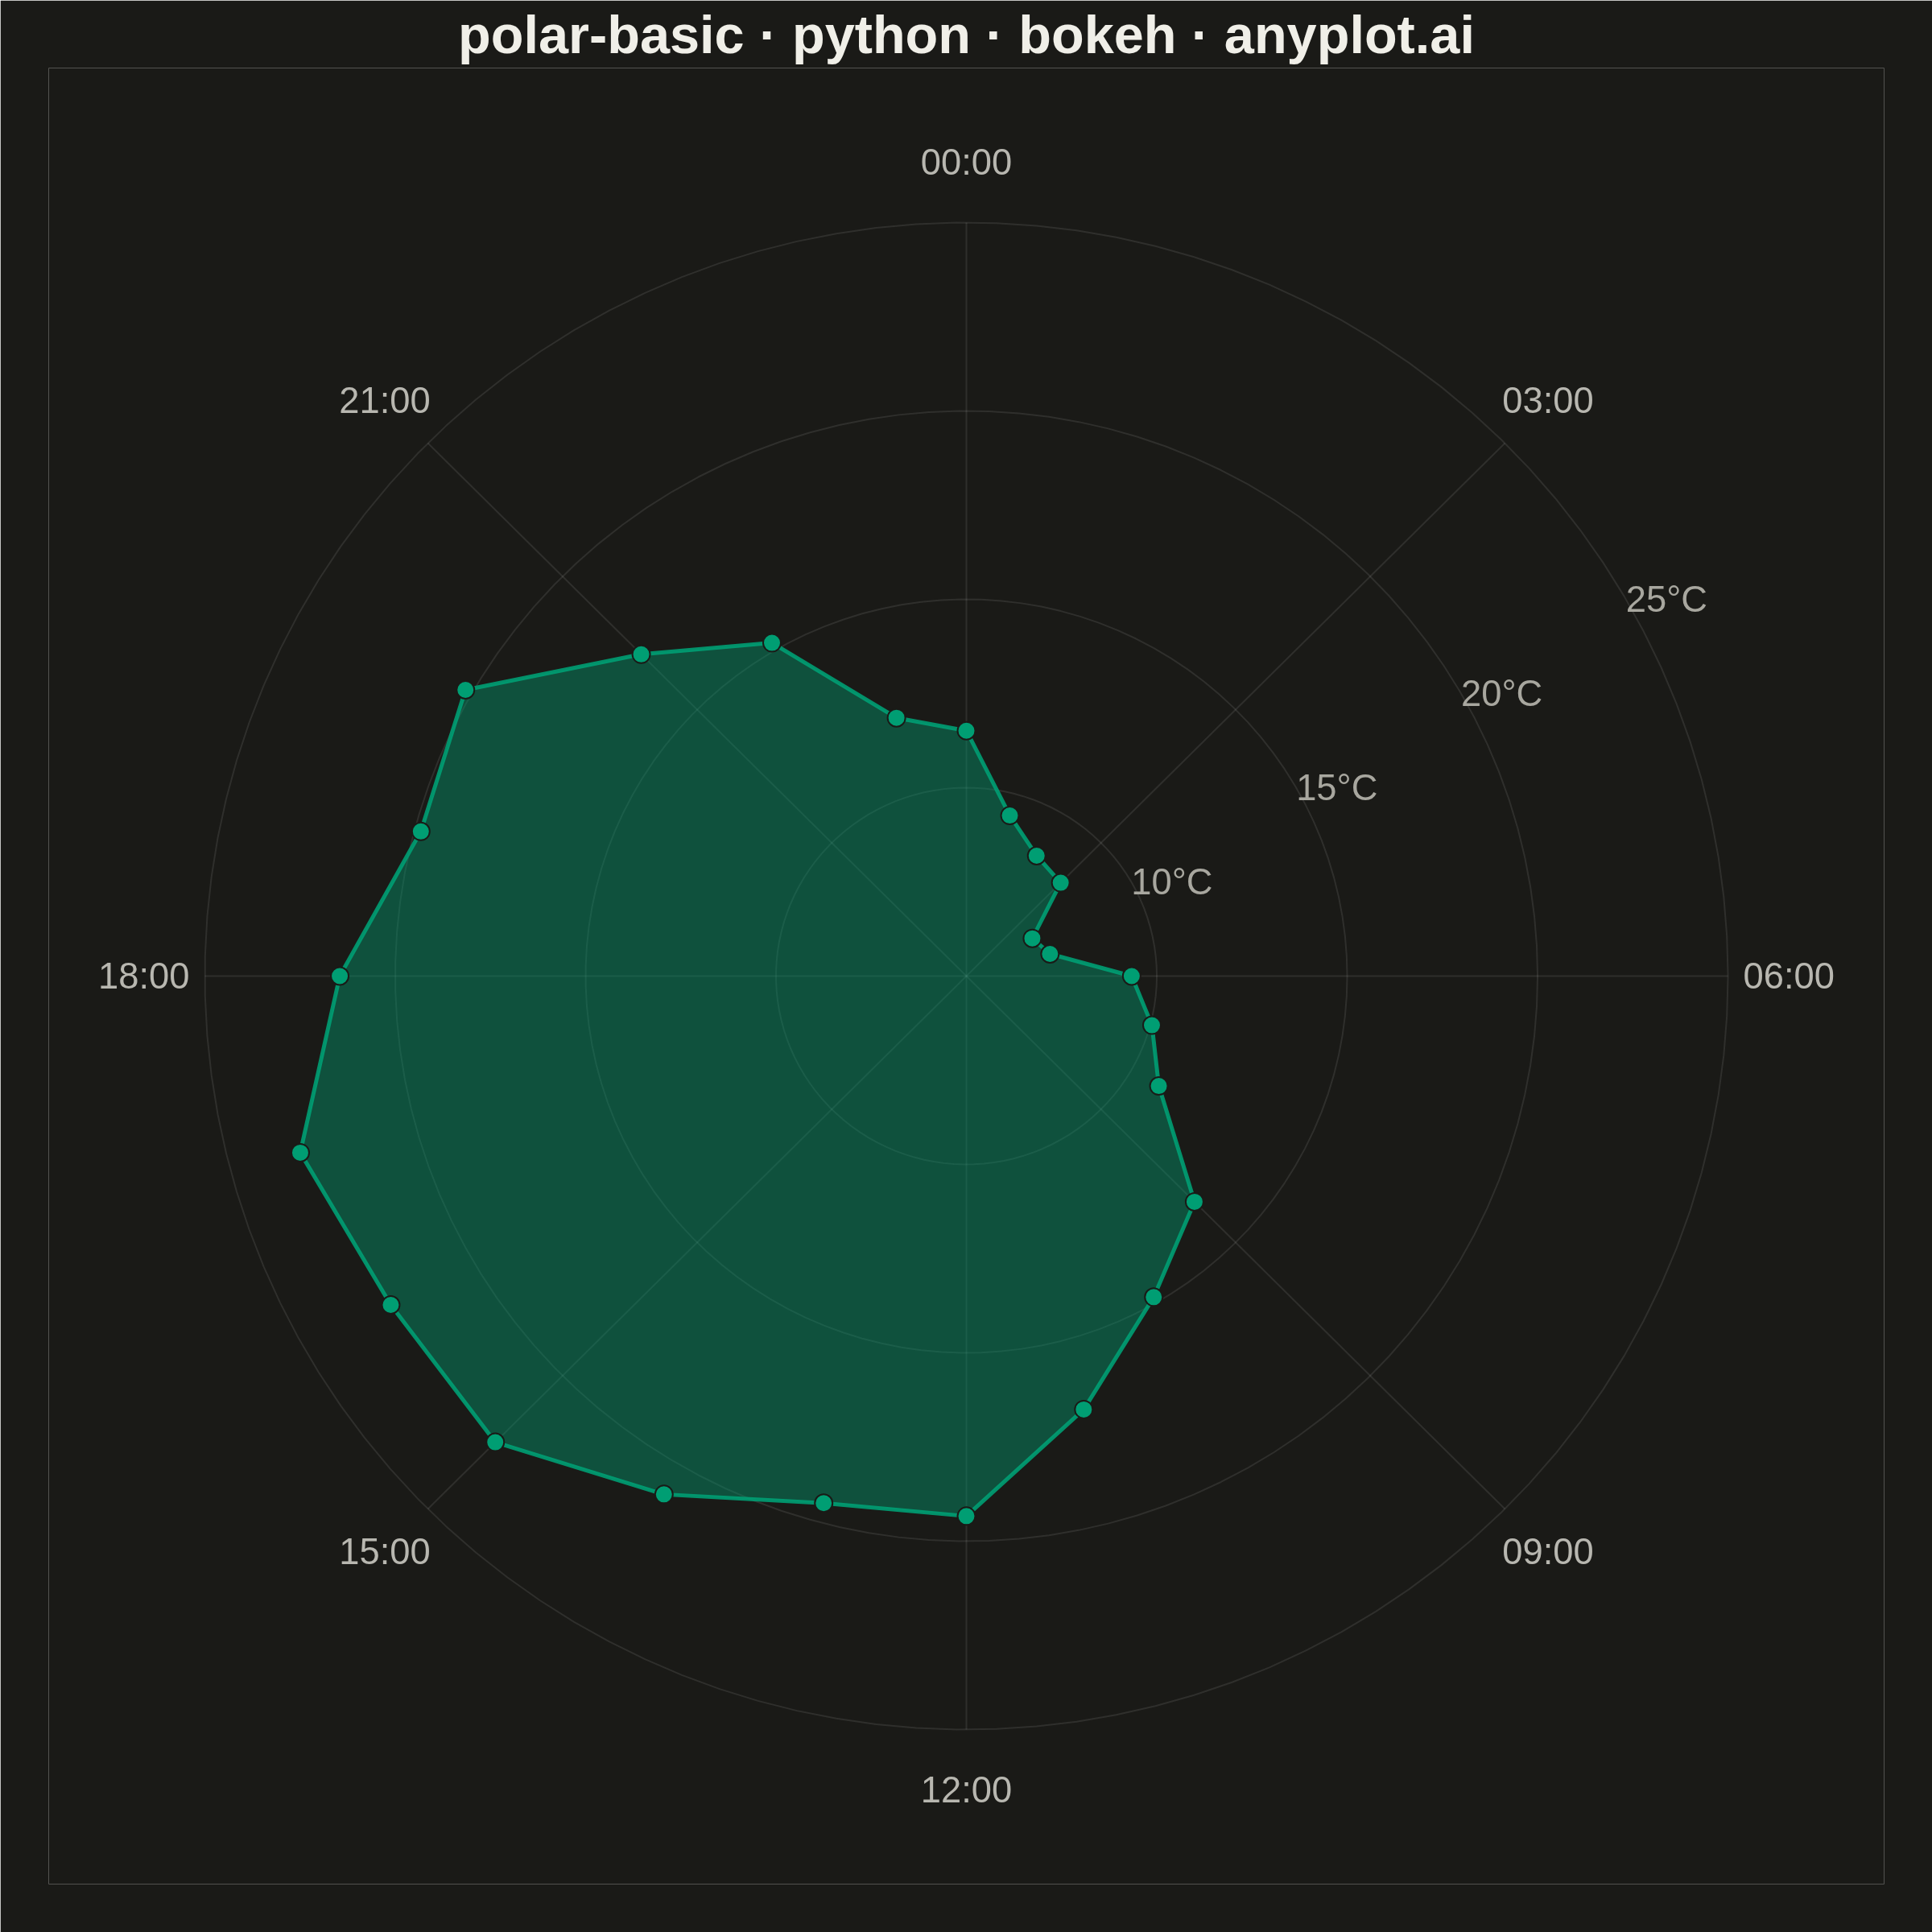
A polar chart displays data points on a circular coordinate system where position is determined by angle (theta) and distance from center (radius). This visualization is ideal for cyclical patterns, directional data, or any dataset where angular relationships are meaningful. It reveals periodic trends and directional distributions that would be obscured in Cartesian coordinates.
""" anyplot.ai
polar-basic: Basic Polar Chart
Library: bokeh 3.9.1 | Python 3.13.14
Quality: 91/100 | Updated: 2026-07-24
"""

import os
import sys


# Prevent this file (bokeh.py) from shadowing the installed bokeh package
_here = os.path.normpath(os.path.abspath(os.path.dirname(__file__)))
sys.path = [p for p in sys.path if os.path.normpath(os.path.abspath(p or ".")) != _here]

import time
from pathlib import Path

import numpy as np
from bokeh.io import output_file, save
from bokeh.models import ColumnDataSource, HoverTool, TapTool
from bokeh.plotting import figure
from selenium import webdriver
from selenium.webdriver.chrome.options import Options


# Theme tokens (see prompts/default-style-guide.md "Theme-adaptive Chrome")
THEME = os.getenv("ANYPLOT_THEME", "light")
PAGE_BG = "#FAF8F1" if THEME == "light" else "#1A1A17"
INK = "#1A1A17" if THEME == "light" else "#F0EFE8"
INK_SOFT = "#4A4A44" if THEME == "light" else "#B8B7B0"
INK_MUTED = "#6B6A63" if THEME == "light" else "#A8A79F"
IMPRINT_PALETTE = ["#009E73", "#C475FD", "#4467A3", "#BD8233", "#AE3030", "#2ABCCD", "#954477", "#99B314"]
BRAND = IMPRINT_PALETTE[0]  # Imprint palette position 1 — ALWAYS first series

IMPL_DIR = os.path.dirname(os.path.abspath(__file__))

# Data — hourly outdoor temperature over a 24-hour cycle
np.random.seed(42)
hours = np.arange(24)
theta = hours * (2 * np.pi / 24)
base_temp = 15 + 8 * np.sin(theta - 5 * np.pi / 6)  # peak ~16:00, trough ~04:00
temperature = base_temp + np.random.normal(0, 0.7, 24)
min_temp = temperature.min()
radius = temperature - min_temp + 2  # shift to strictly positive values

# Bokeh has no native polar projection — convert to Cartesian manually.
# Midnight (0h) sits at the top and hours advance clockwise, like a clock face.
angle = np.pi / 2 - theta
x = radius * np.cos(angle)
y = radius * np.sin(angle)
x_closed = np.append(x, x[0])
y_closed = np.append(y, y[0])

source = ColumnDataSource(data={"x": x, "y": y, "hour": [f"{h:02d}:00" for h in hours], "temp": temperature.round(1)})

# Plot — square canvas suits the chart's radial symmetry
max_radius = np.ceil(radius.max()) + 1
label_r = max_radius + 1.6
canvas_limit = label_r + 2.5

p = figure(
    width=2400,
    height=2400,
    title="polar-basic · python · bokeh · anyplot.ai",
    x_range=(-canvas_limit, canvas_limit),
    y_range=(-canvas_limit, canvas_limit),
    match_aspect=True,
    toolbar_location=None,
    min_border=60,
)

# Concentric radial gridlines with temperature scale labels — placed along the
# lowest-value spoke so the label column stays clear of the filled area no
# matter where the curve's minimum happens to fall.
label_angle = angle[np.argmin(radius)]
label_align = "left" if np.cos(label_angle) >= 0 else "right"
grid_radii = np.linspace(0, max_radius, 5)[1:]
circle_theta = np.linspace(0, 2 * np.pi, 120)
for r in grid_radii:
    p.line(r * np.cos(circle_theta), r * np.sin(circle_theta), line_color=INK, line_width=2, line_alpha=0.10)
    p.text(
        x=[r * np.cos(label_angle)],
        y=[r * np.sin(label_angle)],
        text=[f"{r + min_temp - 2:.0f}°C"],
        text_align=label_align,
        text_baseline="middle",
        text_font_size="34pt",
        text_color=INK_MUTED,
    )

# Spoke gridlines + hour labels at 3-hour intervals
for h in range(0, 24, 3):
    a = np.pi / 2 - h * (2 * np.pi / 24)
    p.line([0, max_radius * np.cos(a)], [0, max_radius * np.sin(a)], line_color=INK, line_width=2, line_alpha=0.10)
    p.text(
        x=[label_r * np.cos(a)],
        y=[label_r * np.sin(a)],
        text=[f"{h:02d}:00"],
        text_align="center",
        text_baseline="middle",
        text_font_size="34pt",
        text_color=INK_SOFT,
    )

# Filled area under the temperature curve — stronger fill on dark bg for contrast
p.patch(x_closed, y_closed, fill_color=BRAND, fill_alpha=0.30 if THEME == "light" else 0.42, line_color=None)

# Closed data line + points (points carry the ColumnDataSource for hover + tap)
p.line(x_closed, y_closed, line_color=BRAND, line_width=5, line_alpha=0.9)
points = p.scatter(
    x="x",
    y="y",
    source=source,
    size=22,
    color=BRAND,
    line_color=PAGE_BG,
    line_width=2,
    # TapTool selection styling — clicking an hour makes it pop, dims the rest
    selection_fill_color=IMPRINT_PALETTE[3],
    selection_line_color=INK,
    nonselection_fill_alpha=0.55,
    nonselection_line_alpha=0.55,
)

p.add_tools(HoverTool(renderers=[points], tooltips=[("Hour", "@hour"), ("Temperature", "@temp °C")]))
p.add_tools(TapTool(renderers=[points]))

# Style
p.title.text_font_size = "50pt"
p.title.align = "center"
p.title.text_color = INK
p.background_fill_color = PAGE_BG
p.border_fill_color = PAGE_BG
p.outline_line_color = None
p.xaxis.visible = False
p.yaxis.visible = False
p.xgrid.visible = False
p.ygrid.visible = False

# Save — HTML (interactive, with hover) + PNG (headless Chrome screenshot)
output_file(os.path.join(IMPL_DIR, f"plot-{THEME}.html"), title="polar-basic · python · bokeh · anyplot.ai")
save(p)

W, H = 2400, 2400
opts = Options()
for arg in (
    "--headless=new",
    "--no-sandbox",
    "--disable-dev-shm-usage",
    "--disable-gpu",
    f"--window-size={W},{H}",
    "--hide-scrollbars",
):
    opts.add_argument(arg)
driver = webdriver.Chrome(options=opts)
driver.set_window_size(W, H)
driver.get(f"file://{Path(os.path.join(IMPL_DIR, f'plot-{THEME}.html')).resolve()}")
# headless Chrome's --window-size sets the OUTER window; pin the viewport via CDP.
driver.execute_cdp_cmd(
    "Emulation.setDeviceMetricsOverride", {"width": W, "height": H, "deviceScaleFactor": 1, "mobile": False}
)
time.sleep(3)  # let bokeh's JS render the canvas
driver.save_screenshot(os.path.join(IMPL_DIR, f"plot-{THEME}.png"))
driver.quit()
Runnable source as JSON, for any HTTP client: https://api.anyplot.ai/specs/polar-basic/bokeh/code. Any spec id and library id listed in llms-full.txt fit the same URL shape; every URL below is complete and callable.
{
  "spec_id": "polar-basic",
  "language": "python",
  "library": "bokeh",
  "page": "https://anyplot.ai/polar-basic/python/bokeh",
  "hub": "https://anyplot.ai/polar-basic",
  "code_json": "https://api.anyplot.ai/specs/polar-basic/bokeh/code",
  "spec_json": "https://api.anyplot.ai/specs/polar-basic",
  "render_light_png": "https://storage.googleapis.com/anyplot-images/plots/polar-basic/python/bokeh/plot-light.png",
  "render_dark_png": "https://storage.googleapis.com/anyplot-images/plots/polar-basic/python/bokeh/plot-dark.png",
  "interactive_light_html": "https://storage.googleapis.com/anyplot-images/plots/polar-basic/python/bokeh/plot-light.html",
  "interactive_dark_html": "https://storage.googleapis.com/anyplot-images/plots/polar-basic/python/bokeh/plot-dark.html",
  "quality_score": 91.0,
  "license": "MIT",
  "guide": "https://anyplot.ai/llms.txt"
}
Part of Basic Polar Chart on anyplot.ai.