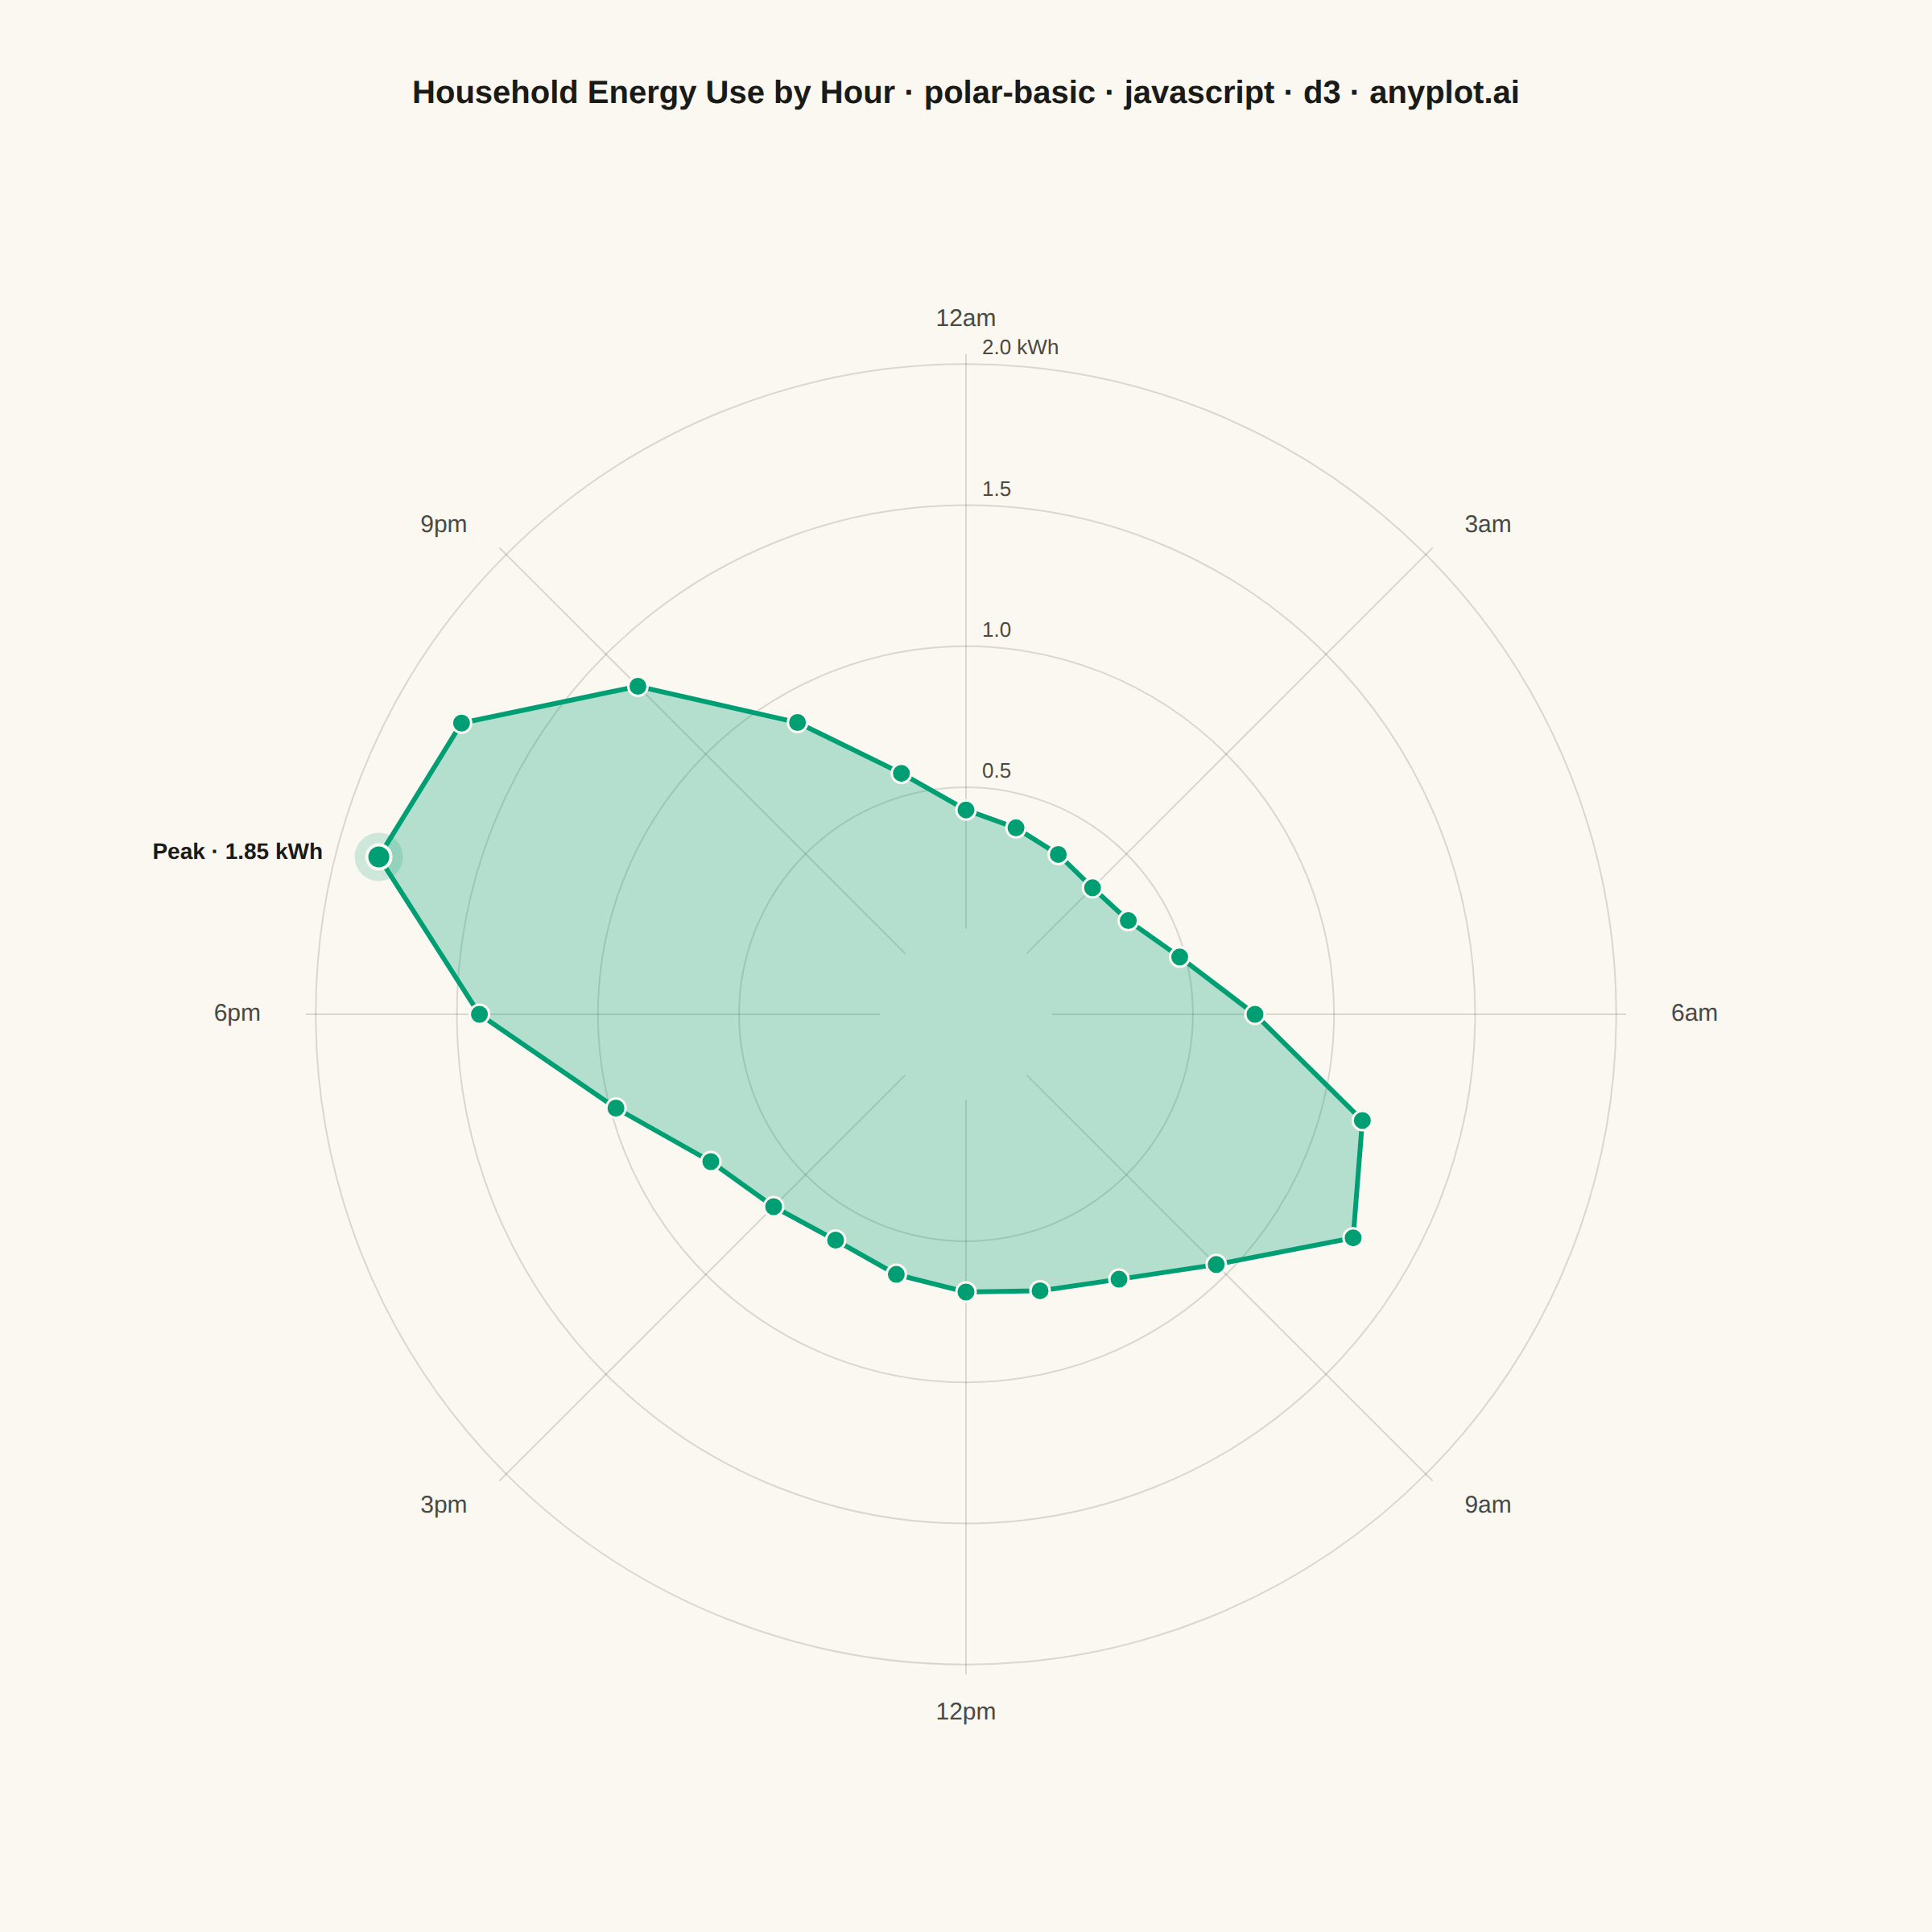
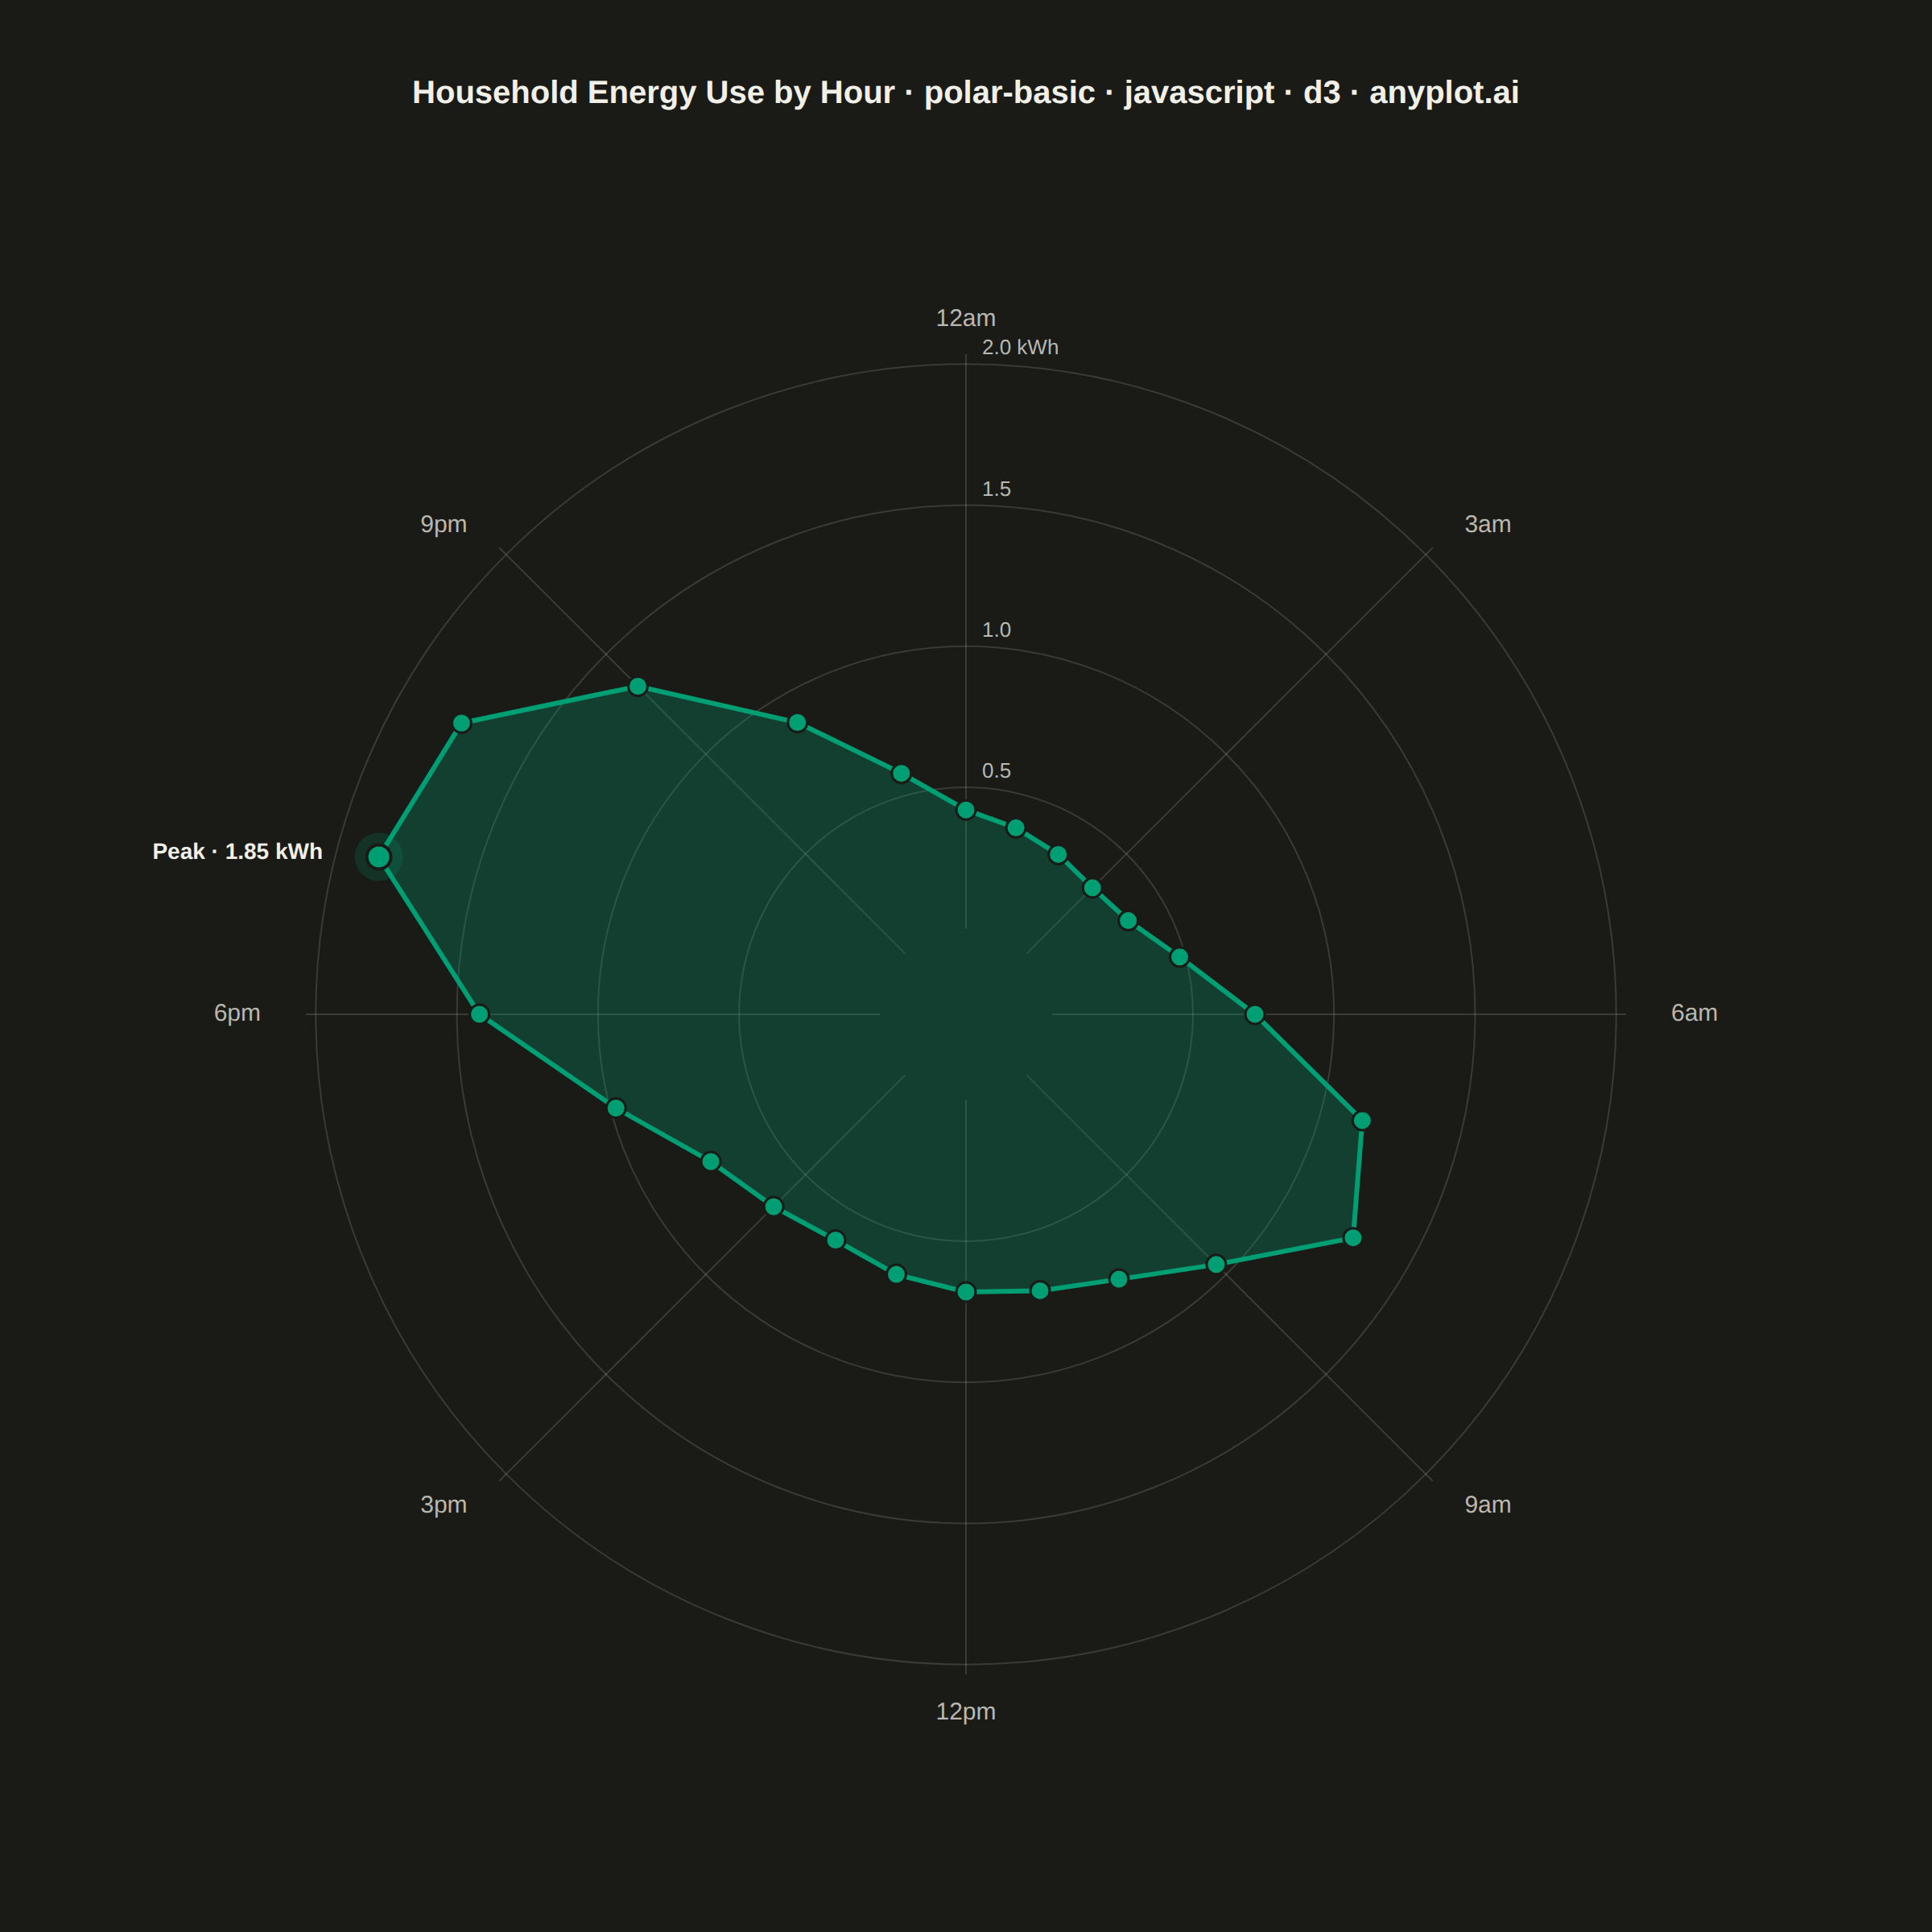
The same plot in 14 other libraries — JavaScript: Chart.js, Apache ECharts, Highcharts, MUI X Charts; Python: Altair, Bokeh, lets-plot, Matplotlib, Plotly, plotnine, Pygal, Seaborn; R: ggplot2; Julia: Makie.jl. Compare all 15 side by side: Basic Polar Chart in Python, R, Julia and JavaScript.
A polar chart displays data points on a circular coordinate system where position is determined by angle (theta) and distance from center (radius). This visualization is ideal for cyclical patterns, directional data, or any dataset where angular relationships are meaningful. It reveals periodic trends and directional distributions that would be obscured in Cartesian coordinates.
// anyplot.ai
// polar-basic: Basic Polar Chart
// Library: d3 7.9.0 | JavaScript 22.23.1
// Quality: 93/100 | Updated: 2026-07-25

//# anyplot-orientation: square

const t = window.ANYPLOT_TOKENS;
const { width, height } = window.ANYPLOT_SIZE;

// Data — household energy consumption (kWh) by hour of day, a cyclical pattern
const hourlyConsumption = [
  0.42, 0.38, 0.35, 0.33, 0.36, 0.48, 0.72, 1.15, 1.28, 0.95, 0.78, 0.71, 0.68,
  0.65, 0.62, 0.66, 0.74, 0.98, 1.42, 1.85, 1.76, 1.34, 0.89, 0.58,
];
const data = hourlyConsumption.map((value, hour) => ({ hour, value }));

const hourLabels = {
  0: "12am",
  3: "3am",
  6: "6am",
  9: "9am",
  12: "12pm",
  15: "3pm",
  18: "6pm",
  21: "9pm",
};

// Layout — circle centered in the square mount, room reserved for the title
// and the hour labels ringed just outside the plot circle
const margin = { top: 170, right: 110, bottom: 110, left: 110 };
const iw = width - margin.left - margin.right;
const ih = height - margin.top - margin.bottom;
const cx = margin.left + iw / 2;
const cy = margin.top + ih / 2;
const outerRadius = Math.min(iw, ih) / 2 - 50;
const innerRadius = outerRadius * 0.13;

// Scales — angle 0 at top (12 o'clock), increasing clockwise through the day.
// A small inner-radius offset (donut-style start) keeps low overnight values
// from compressing into the exact center.
const angle = (hour) => (hour / 24) * 2 * Math.PI;
const radiusScale = d3
  .scaleLinear()
  .domain([0, d3.max(data, (d) => d.value) * 1.1])
  .range([innerRadius, outerRadius]);
const pointAt = (rad, r) => [r * Math.sin(rad), -r * Math.cos(rad)];
const anchorFor = (rad) => {
  const s = Math.sin(rad);
  return Math.abs(s) < 0.01 ? "middle" : s > 0 ? "start" : "end";
};
const baselineFor = (rad) => {
  const c = Math.cos(rad);
  return Math.abs(c) < 0.01 ? "middle" : c > 0 ? "hanging" : "auto";
};

const svg = d3.select("#container").append("svg").attr("width", width).attr("height", height);
const plot = svg.append("g").attr("transform", `translate(${cx},${cy})`);

// Radial gradient — subtle depth cue, fill grows denser toward the outer edge
const gradient = svg
  .append("defs")
  .append("radialGradient")
  .attr("id", "areaFill")
  .attr("gradientUnits", "userSpaceOnUse")
  .attr("cx", cx)
  .attr("cy", cy)
  .attr("r", outerRadius);
gradient.append("stop").attr("offset", "0%").attr("stop-color", t.palette[0]).attr("stop-opacity", 0.05);
gradient.append("stop").attr("offset", "100%").attr("stop-color", t.palette[0]).attr("stop-opacity", 0.28);

// Radial gridlines (concentric circles) with value labels along the top spoke
const radiusTicks = radiusScale.ticks(4).filter((v) => v > 0);
plot
  .selectAll(".radial-grid")
  .data(radiusTicks)
  .join("circle")
  .attr("class", "radial-grid")
  .attr("r", (d) => radiusScale(d))
  .attr("fill", "none")
  .attr("stroke", t.grid)
  .attr("stroke-width", 1);

plot
  .selectAll(".radial-tick-label")
  .data(radiusTicks)
  .join("text")
  .attr("class", "radial-tick-label")
  .attr("x", 10)
  .attr("y", (d) => -radiusScale(d) - 6)
  .attr("fill", t.inkSoft)
  .style("font-size", "13px")
  .text((d, i) => (i === radiusTicks.length - 1 ? `${d.toFixed(1)} kWh` : d.toFixed(1)));

// Angular gridlines (spokes) every 3 hours, drawn from the inner-radius hole
// out to the rim, with hour labels ringed outside
const spokeHours = Object.keys(hourLabels).map(Number);
plot
  .selectAll(".angular-grid")
  .data(spokeHours)
  .join("line")
  .attr("class", "angular-grid")
  .attr("x1", (h) => pointAt(angle(h), innerRadius)[0])
  .attr("y1", (h) => pointAt(angle(h), innerRadius)[1])
  .attr("x2", (h) => pointAt(angle(h), outerRadius)[0])
  .attr("y2", (h) => pointAt(angle(h), outerRadius)[1])
  .attr("stroke", t.grid)
  .attr("stroke-width", 1);

plot
  .selectAll(".angular-label")
  .data(spokeHours)
  .join("text")
  .attr("class", "angular-label")
  .attr("x", (h) => pointAt(angle(h), outerRadius + 28)[0])
  .attr("y", (h) => pointAt(angle(h), outerRadius + 28)[1])
  .attr("text-anchor", (h) => anchorFor(angle(h)))
  .attr("dominant-baseline", (h) => baselineFor(angle(h)))
  .attr("fill", t.inkSoft)
  .style("font-size", "15px")
  .text((h) => hourLabels[h]);

// Data — closed radial line with a gradient fill (denser toward the rim) and marker dots
const radialLine = d3
  .lineRadial()
  .angle((d) => angle(d.hour))
  .radius((d) => radiusScale(d.value))
  .curve(d3.curveLinearClosed);

plot
  .append("path")
  .datum(data)
  .attr("d", radialLine)
  .attr("fill", "url(#areaFill)")
  .attr("stroke", t.palette[0])
  .attr("stroke-width", 3);

plot
  .selectAll(".data-point")
  .data(data)
  .join("circle")
  .attr("class", "data-point")
  .attr("cx", (d) => pointAt(angle(d.hour), radiusScale(d.value))[0])
  .attr("cy", (d) => pointAt(angle(d.hour), radiusScale(d.value))[1])
  .attr("r", 6)
  .attr("fill", t.palette[0])
  .attr("stroke", t.pageBg)
  .attr("stroke-width", 1.5);

// Highlight the evening peak — a soft halo behind a larger marker, plus a callout label
const peak = data.reduce((a, b) => (b.value > a.value ? b : a));
const peakAngle = angle(peak.hour);
const peakRadius = radiusScale(peak.value);
const [peakX, peakY] = pointAt(peakAngle, peakRadius);

plot
  .append("circle")
  .attr("cx", peakX)
  .attr("cy", peakY)
  .attr("r", 15)
  .attr("fill", t.palette[0])
  .attr("fill-opacity", 0.18);

plot
  .append("circle")
  .attr("cx", peakX)
  .attr("cy", peakY)
  .attr("r", 7.5)
  .attr("fill", t.palette[0])
  .attr("stroke", t.pageBg)
  .attr("stroke-width", 2);

const [peakLabelX, peakLabelY] = pointAt(peakAngle, peakRadius + 36);
plot
  .append("text")
  .attr("x", peakLabelX)
  .attr("y", peakLabelY)
  .attr("text-anchor", anchorFor(peakAngle))
  .attr("dominant-baseline", baselineFor(peakAngle))
  .attr("fill", t.ink)
  .style("font-size", "14px")
  .style("font-weight", "600")
  .text(`Peak · ${peak.value.toFixed(2)} kWh`);

// Title
svg
  .append("text")
  .attr("x", width / 2)
  .attr("y", 64)
  .attr("text-anchor", "middle")
  .attr("fill", t.ink)
  .style("font-size", "20px")
  .style("font-weight", "600")
  .text("Household Energy Use by Hour · polar-basic · javascript · d3 · anyplot.ai");
Runnable source as JSON, for any HTTP client: https://api.anyplot.ai/specs/polar-basic/d3/code. Any spec id and library id listed in llms-full.txt fit the same URL shape; every URL below is complete and callable.
{
  "spec_id": "polar-basic",
  "language": "javascript",
  "library": "d3",
  "page": "https://anyplot.ai/polar-basic/javascript/d3",
  "hub": "https://anyplot.ai/polar-basic",
  "code_json": "https://api.anyplot.ai/specs/polar-basic/d3/code",
  "spec_json": "https://api.anyplot.ai/specs/polar-basic",
  "render_light_png": "https://storage.googleapis.com/anyplot-images/plots/polar-basic/javascript/d3/plot-light.png",
  "render_dark_png": "https://storage.googleapis.com/anyplot-images/plots/polar-basic/javascript/d3/plot-dark.png",
  "interactive_light_html": "https://storage.googleapis.com/anyplot-images/plots/polar-basic/javascript/d3/plot-light.html",
  "interactive_dark_html": "https://storage.googleapis.com/anyplot-images/plots/polar-basic/javascript/d3/plot-dark.html",
  "quality_score": 93.0,
  "license": "MIT",
  "guide": "https://anyplot.ai/llms.txt"
}
Part of Basic Polar Chart on anyplot.ai.