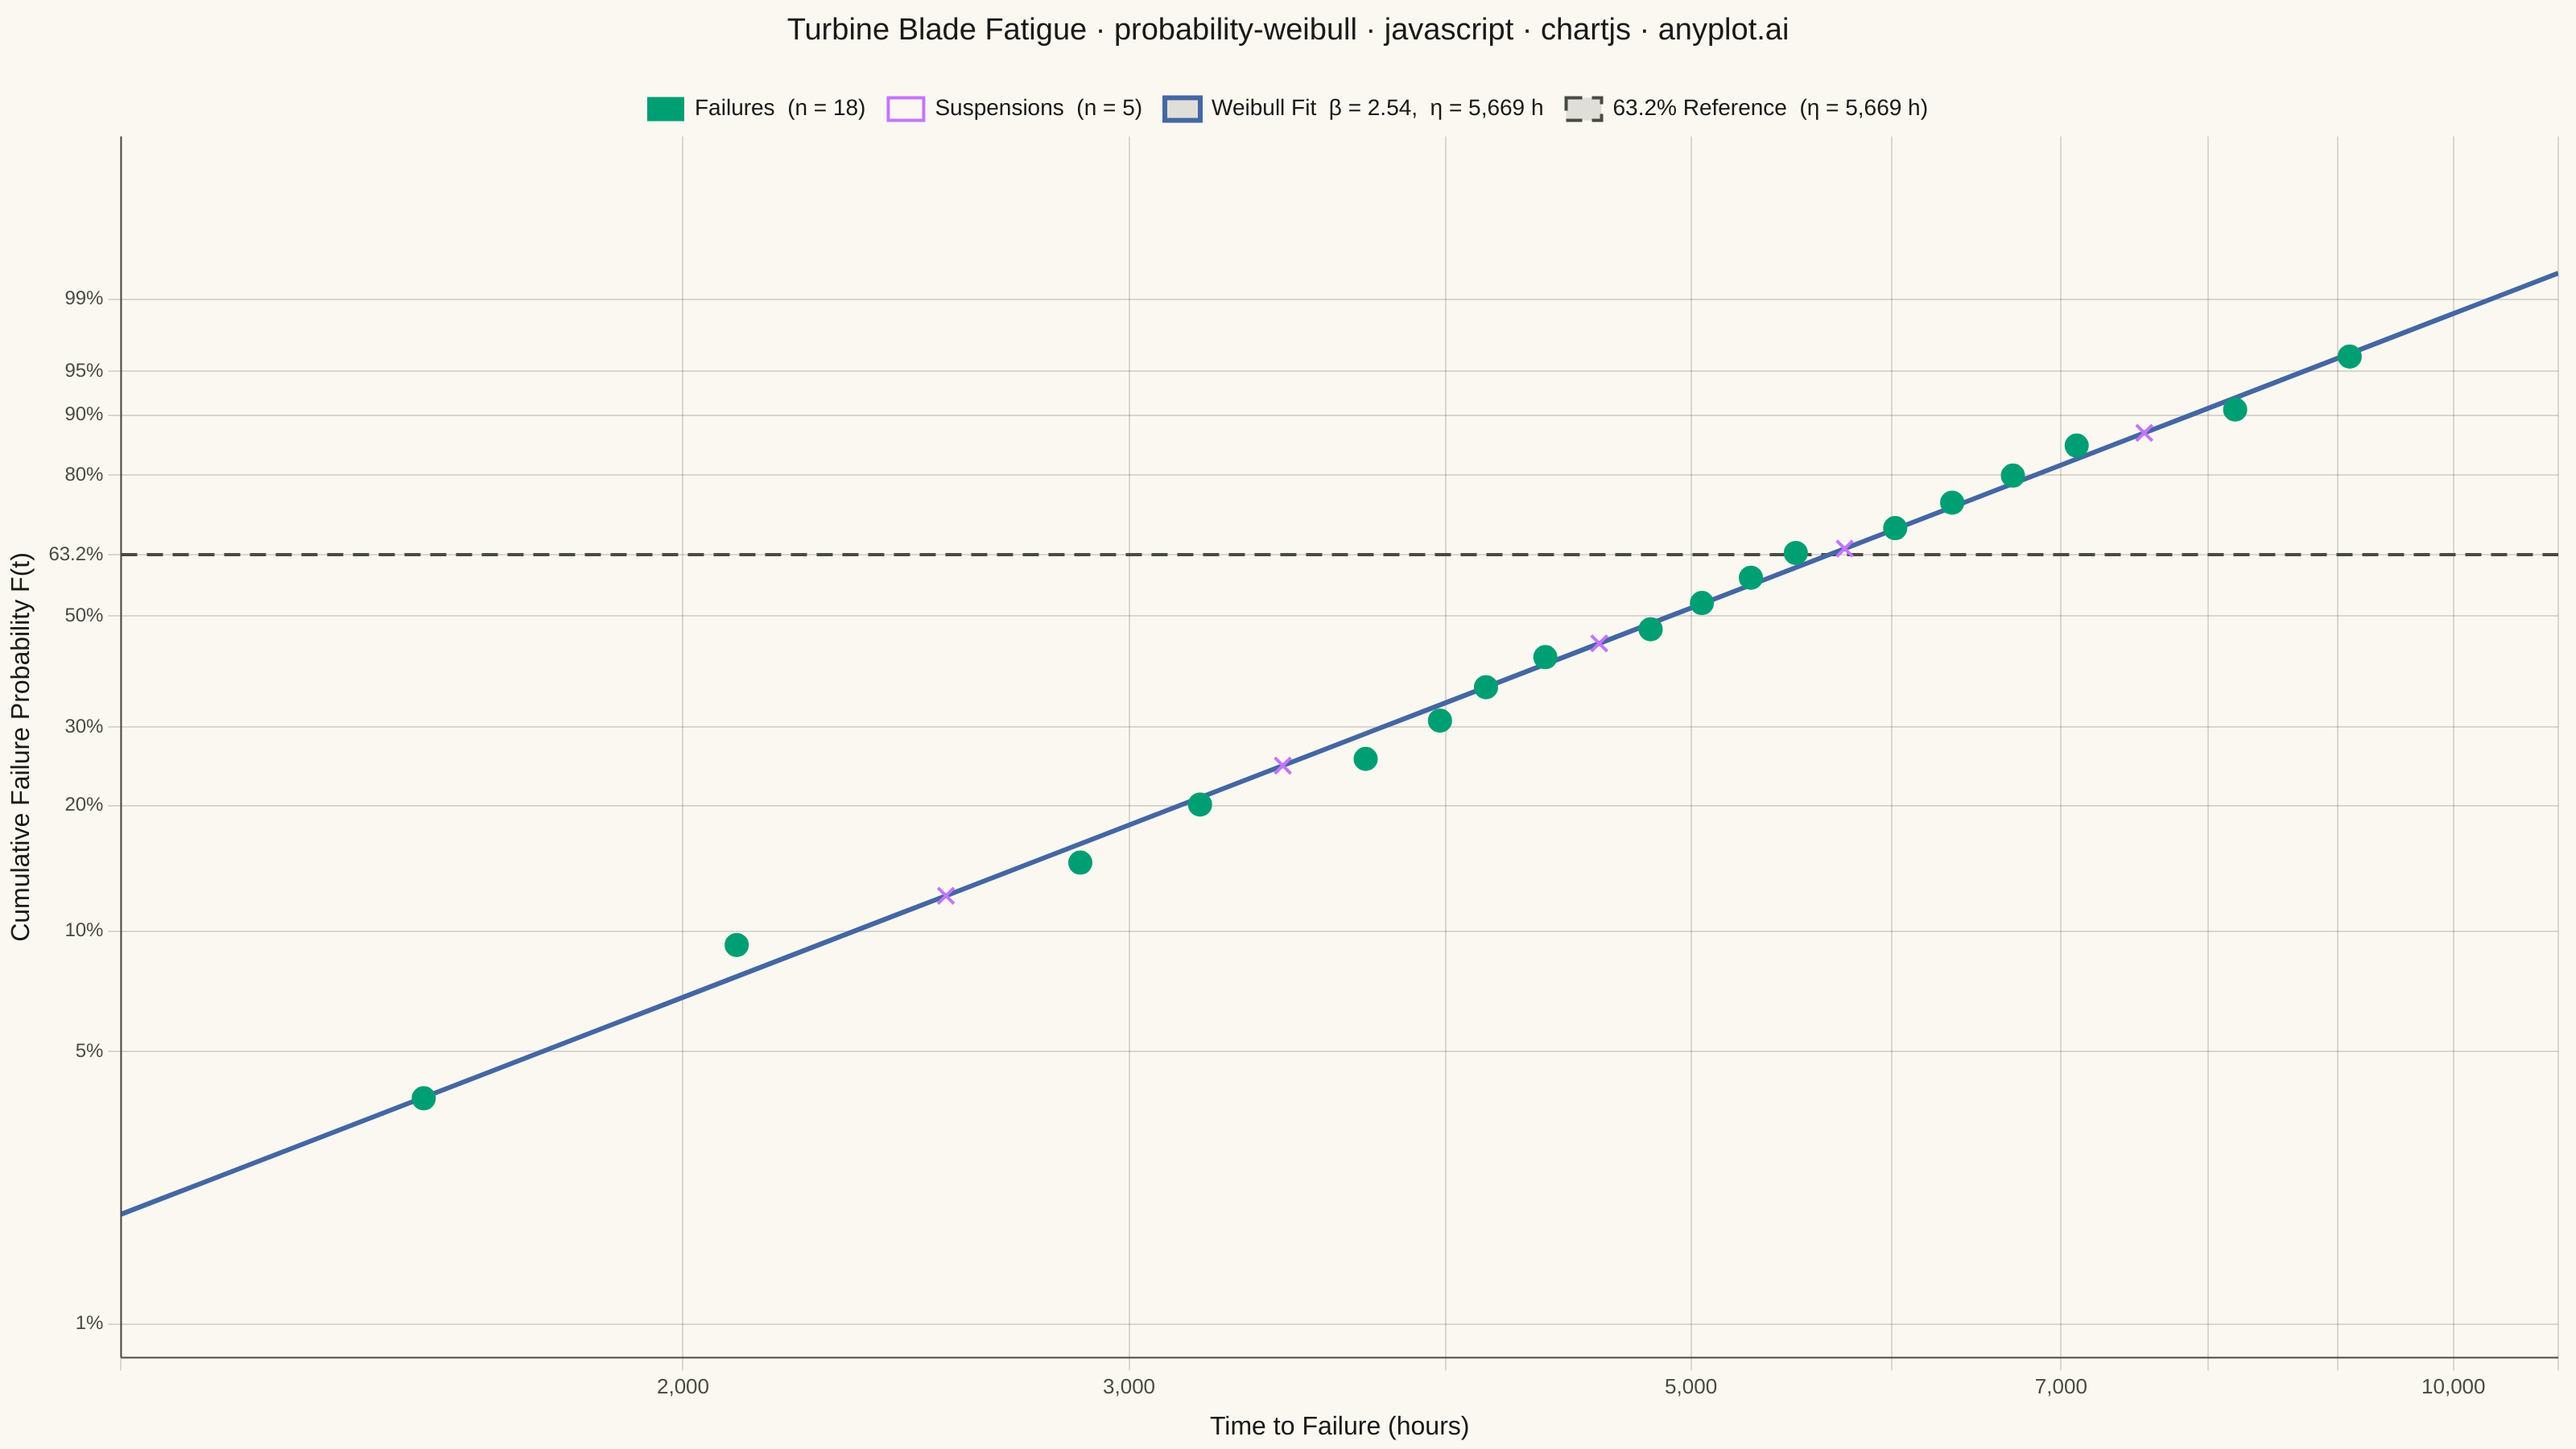
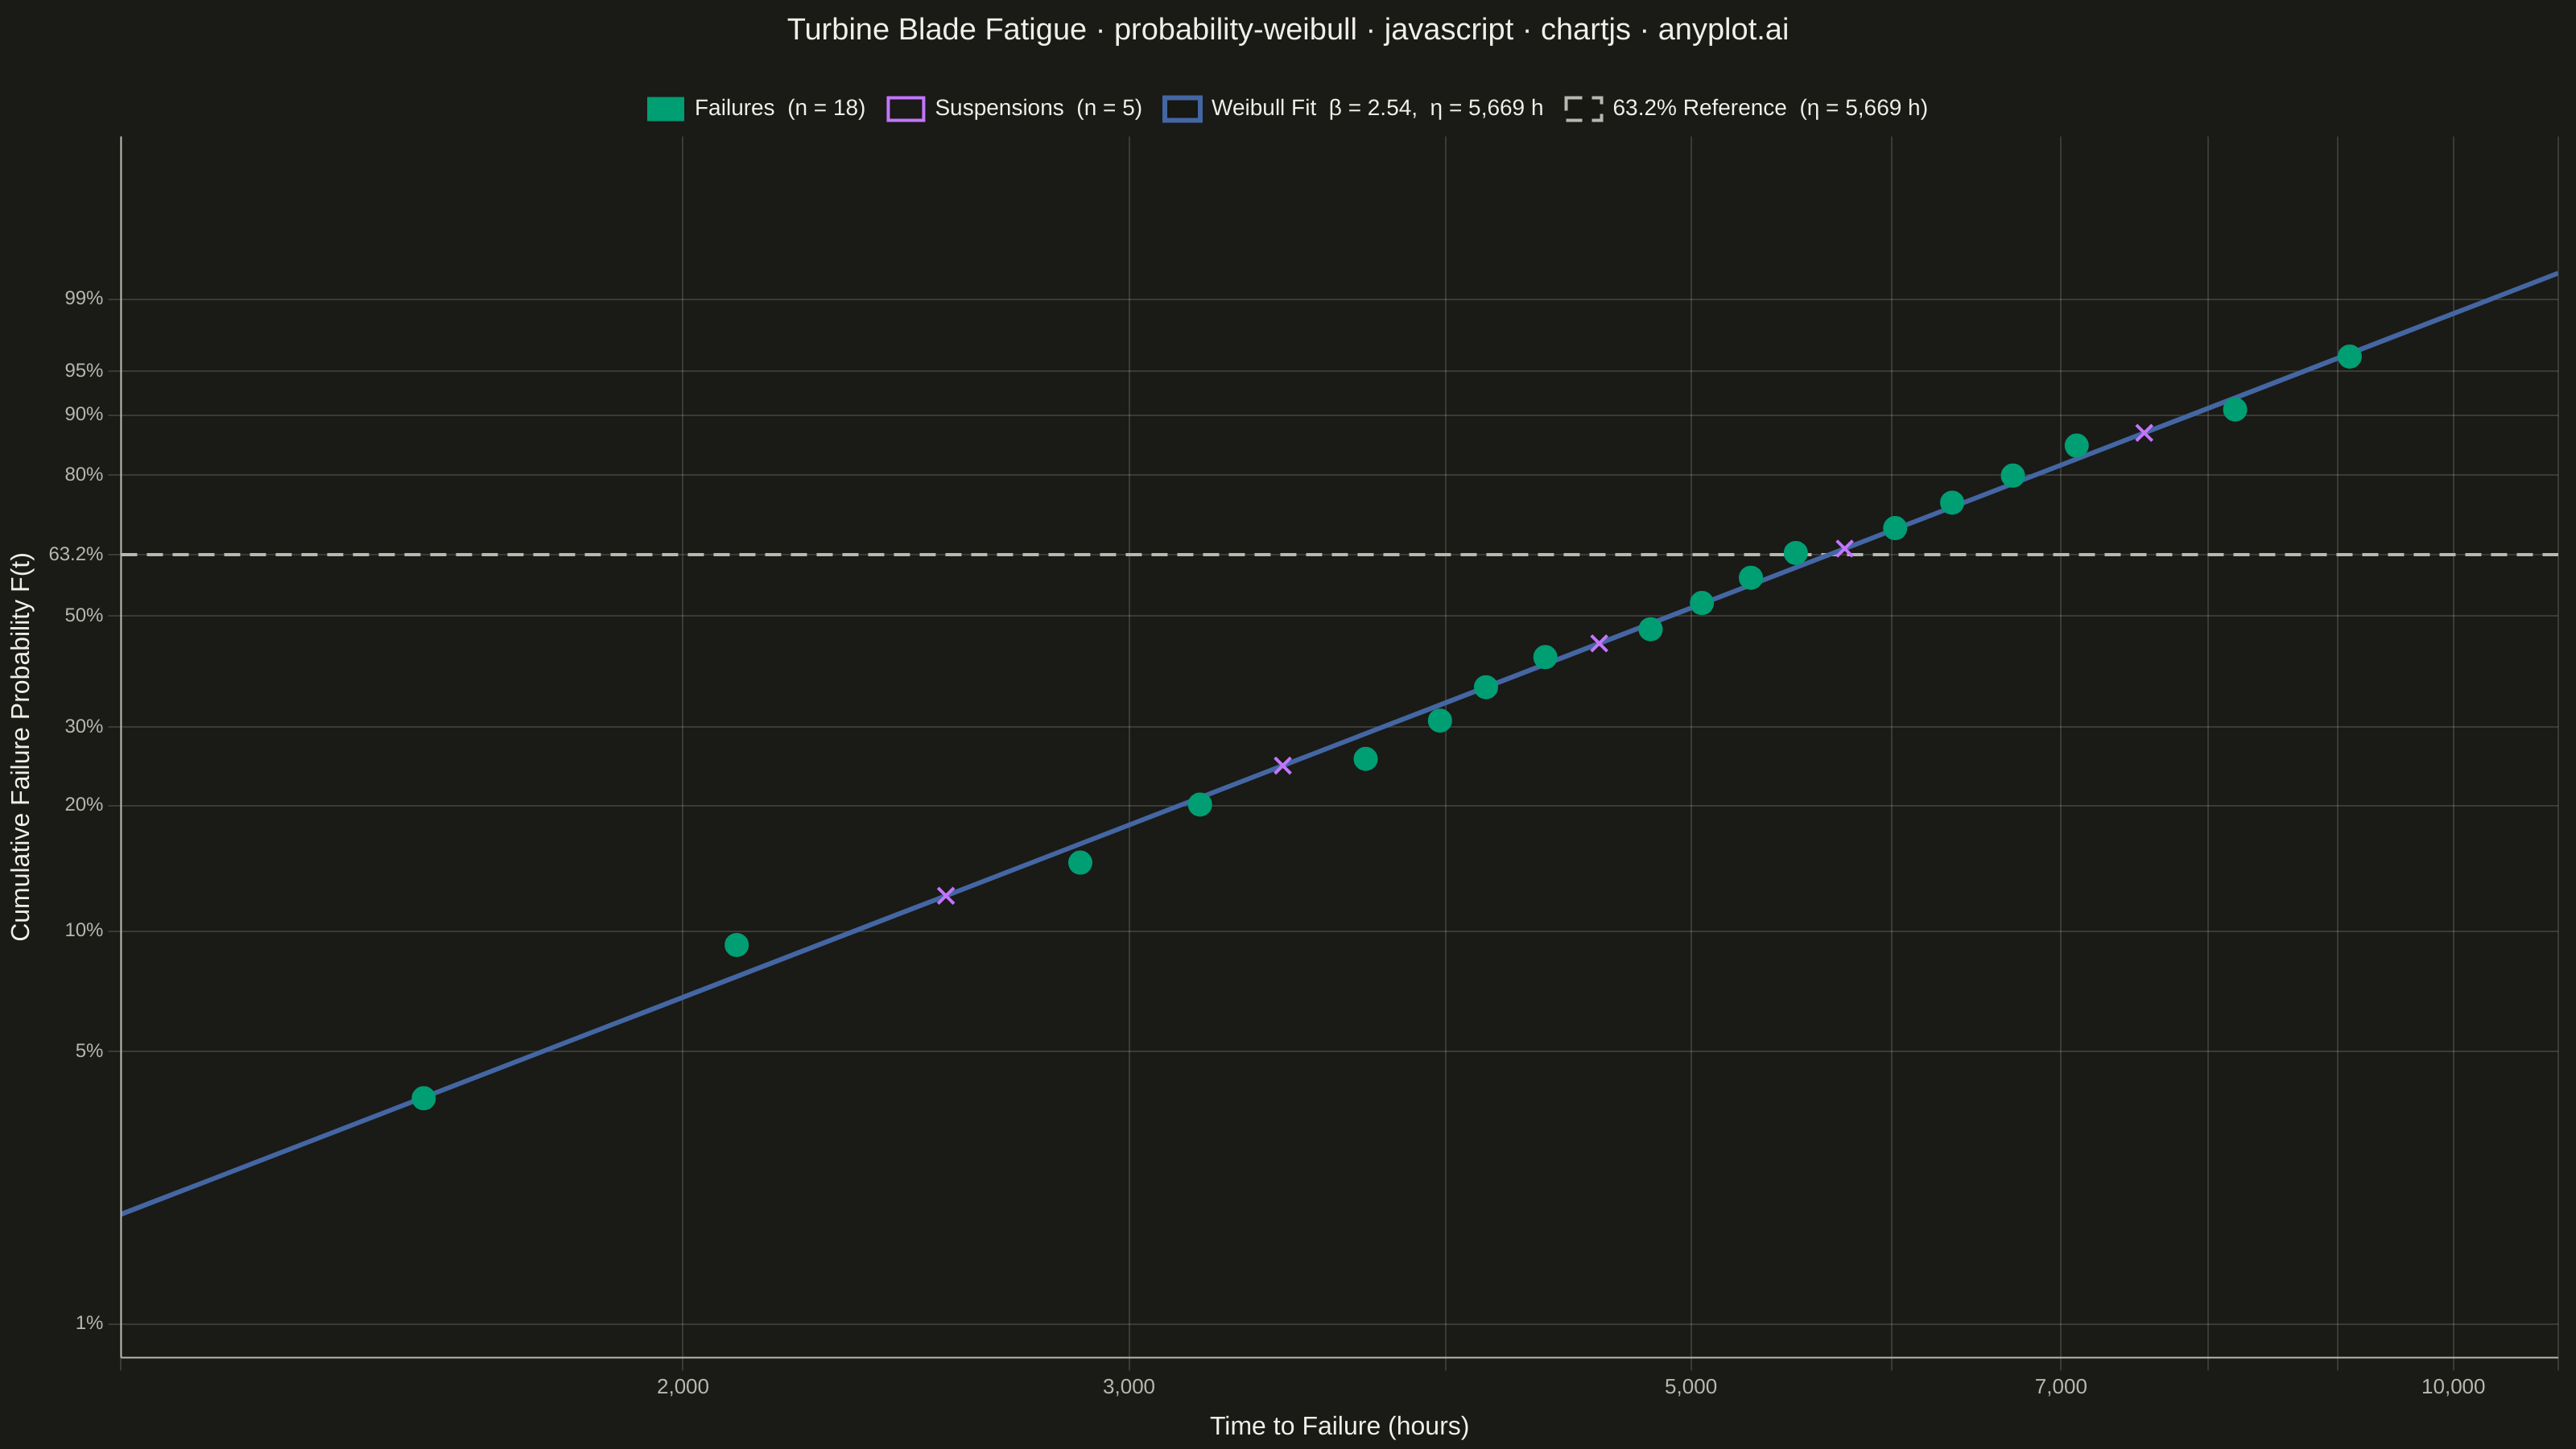
The same plot in 14 other libraries — JavaScript: D3.js, Apache ECharts, Highcharts, MUI X Charts; Python: Altair, Bokeh, lets-plot, Matplotlib, Plotly, plotnine, Pygal, Seaborn; R: ggplot2; Julia: Makie.jl. Compare all 15 side by side: Weibull Probability Plot for Reliability Analysis in Python, R, Julia and JavaScript.
A Weibull probability plot displays failure or lifetime data on Weibull probability paper (logarithmic x-axis for time/cycles, linearized Weibull CDF on y-axis) with a fitted straight line. It is the standard tool in reliability engineering for estimating Weibull distribution parameters (shape and scale), assessing whether data follow a Weibull distribution, and extrapolating failure probabilities. The slope of the fitted line gives the shape parameter (beta), while the characteristic life (eta) is read at the 63.2% failure probability crossing.
// anyplot.ai
// probability-weibull: Weibull Probability Plot for Reliability Analysis
// Library: chartjs 4.4.7 | JavaScript 22.22.3
// Quality: 91/100 | Created: 2026-06-07
//# anyplot-orientation: landscape

const t = window.ANYPLOT_TOKENS;

// Turbine blade fatigue-life data (hours) — fixed, deterministic
// Format: [time_hours, is_censored]
const rawData = [
  [1580, false], [2100, false], [2540, true],
  [2870, false], [3200, false], [3450, true],
  [3720, false], [3980, false], [4150, false],
  [4380, false], [4600, true],  [4820, false],
  [5050, false], [5280, false], [5500, false],
  [5750, true],  [6020, false], [6340, false],
  [6700, false], [7100, false], [7550, true],
  [8200, false], [9100, false],
];

// Sort by time, separate failures from suspensions
const sorted = rawData.slice().sort((a, b) => a[0] - b[0]);
const failures = sorted.filter(d => !d[1]);
const suspensions = sorted.filter(d => d[1]);
const nFail = failures.length;

// Median rank plotting positions: F_j = (j+1 - 0.3) / (nFail + 0.4)
const failureData = failures.map(([time], j) => {
  const F = (j + 1 - 0.3) / (nFail + 0.4);
  return { x: time, y: Math.log(-Math.log(1 - F)), F };
});

// OLS Weibull fit: ln(-ln(1-F)) = beta * ln(t) + c
const lnT = failureData.map(p => Math.log(p.x));
const yWei = failureData.map(p => p.y);
const m = lnT.length;
const xBar = lnT.reduce((s, v) => s + v, 0) / m;
const yBar = yWei.reduce((s, v) => s + v, 0) / m;
const ssxy = lnT.reduce((s, v, i) => s + (v - xBar) * (yWei[i] - yBar), 0);
const ssxx = lnT.reduce((s, v) => s + (v - xBar) ** 2, 0);
const betaHat = ssxy / ssxx;
const c0 = yBar - betaHat * xBar;
const etaHat = Math.exp(-c0 / betaHat);

// Suspension markers: project onto fitted line at their censoring times
const suspData = suspensions.map(([time]) => ({
  x: time,
  y: betaHat * Math.log(time) + c0,
}));

// Fitted Weibull line across x range
const xLogMin = Math.log(1200);
const xLogMax = Math.log(11000);
const fitData = [];
for (let i = 0; i <= 60; i++) {
  const lnx = xLogMin + (i / 60) * (xLogMax - xLogMin);
  const y = betaHat * lnx + c0;
  if (y >= -4.8 && y <= 2.5) fitData.push({ x: Math.exp(lnx), y });
}

// 63.2% reference line (y = 0 on Weibull scale, crossing at x = eta)
const refData = [
  { x: Math.exp(xLogMin), y: 0 },
  { x: Math.exp(xLogMax), y: 0 },
];

// Y-axis Weibull probability ticks
const probLevels = [0.01, 0.05, 0.10, 0.20, 0.30, 0.50, 0.6321, 0.80, 0.90, 0.95, 0.99];
const yTickVals = probLevels.map(p => Math.log(-Math.log(1 - p)));
const yTickLabels = ['1%', '5%', '10%', '20%', '30%', '50%', '63.2%', '80%', '90%', '95%', '99%'];

// L-shaped spine: draw only bottom + left borders, removing the default chart box
const spinePlugin = {
  id: 'spines',
  afterDatasetsDraw({ ctx, chartArea: { top, right, bottom, left } }) {
    ctx.save();
    ctx.strokeStyle = t.inkSoft;
    ctx.lineWidth = 1;
    ctx.beginPath();
    ctx.moveTo(left, top);
    ctx.lineTo(left, bottom);
    ctx.moveTo(left, bottom);
    ctx.lineTo(right, bottom);
    ctx.stroke();
    ctx.restore();
  },
};

// Mount canvas
const canvas = document.createElement('canvas');
document.getElementById('container').appendChild(canvas);

// Title — scale font size for long string (baseline: 22px at 67 chars)
const titleText = 'Turbine Blade Fatigue · probability-weibull · javascript · chartjs · anyplot.ai';
const titleSize = Math.max(14, Math.round(22 * 67 / titleText.length));

new Chart(canvas, {
  plugins: [spinePlugin],
  data: {
    datasets: [
      {
        type: 'line',
        label: `Weibull Fit  β = ${betaHat.toFixed(2)},  η = ${Math.round(etaHat).toLocaleString()} h`,
        data: fitData,
        borderColor: t.palette[2],
        borderWidth: 3,
        pointRadius: 0,
        fill: false,
        tension: 0,
        order: 3,
      },
      {
        type: 'line',
        label: `63.2% Reference  (η = ${Math.round(etaHat).toLocaleString()} h)`,
        data: refData,
        borderColor: t.inkSoft,
        borderWidth: 2,
        borderDash: [10, 6],
        pointRadius: 0,
        fill: false,
        order: 4,
      },
      {
        type: 'scatter',
        label: `Failures  (n = ${nFail})`,
        data: failureData,
        backgroundColor: t.palette[0],
        borderColor: t.palette[0],
        pointRadius: 7,
        pointHoverRadius: 9,
        order: 1,
      },
      {
        type: 'scatter',
        label: `Suspensions  (n = ${suspensions.length})`,
        data: suspData,
        backgroundColor: 'transparent',
        borderColor: t.palette[1],
        borderWidth: 2,
        pointStyle: 'crossRot',
        pointRadius: 7,
        pointHoverRadius: 9,
        order: 2,
      },
    ],
  },
  options: {
    responsive: true,
    maintainAspectRatio: false,
    animation: false,
    plugins: {
      title: {
        display: true,
        text: titleText,
        color: t.ink,
        font: { size: titleSize, weight: '500' },
        padding: { top: 8, bottom: 16 },
      },
      legend: {
        labels: {
          color: t.ink,
          font: { size: 14 },
          boxWidth: 22,
          padding: 14,
        },
      },
      tooltip: {
        callbacks: {
          label: (ctx) => {
            if (ctx.datasetIndex === 2) {
              const p = failureData[ctx.dataIndex];
              return `t = ${p.x.toLocaleString()} h,  F = ${(p.F * 100).toFixed(1)}%`;
            }
            if (ctx.datasetIndex === 3) {
              return `Suspended at ${suspensions[ctx.dataIndex][0].toLocaleString()} h`;
            }
            return '';
          },
        },
      },
    },
    scales: {
      x: {
        type: 'logarithmic',
        min: Math.exp(xLogMin),
        max: Math.exp(xLogMax),
        title: {
          display: true,
          text: 'Time to Failure (hours)',
          color: t.ink,
          font: { size: 16 },
        },
        ticks: {
          color: t.inkSoft,
          font: { size: 13 },
          callback: (val) => {
            const niceVals = [1000, 2000, 3000, 5000, 7000, 10000];
            return niceVals.includes(val) ? val.toLocaleString() : '';
          },
        },
        grid: { color: t.grid },
        border: { display: false },
      },
      y: {
        type: 'linear',
        min: -4.8,
        max: 2.5,
        title: {
          display: true,
          text: 'Cumulative Failure Probability F(t)',
          color: t.ink,
          font: { size: 16 },
        },
        afterBuildTicks: (scale) => {
          scale.ticks = yTickVals.map(v => ({ value: v }));
        },
        ticks: {
          color: t.inkSoft,
          font: { size: 12 },
          callback: (val) => {
            const idx = yTickVals.findIndex(v => Math.abs(v - val) < 0.05);
            return idx >= 0 ? yTickLabels[idx] : '';
          },
        },
        grid: { color: t.grid },
        border: { display: false },
      },
    },
  },
});
Runnable source as JSON, for any HTTP client: https://api.anyplot.ai/specs/probability-weibull/chartjs/code. Any spec id and library id listed in llms-full.txt fit the same URL shape; every URL below is complete and callable.
{
  "spec_id": "probability-weibull",
  "language": "javascript",
  "library": "chartjs",
  "page": "https://anyplot.ai/probability-weibull/javascript/chartjs",
  "hub": "https://anyplot.ai/probability-weibull",
  "code_json": "https://api.anyplot.ai/specs/probability-weibull/chartjs/code",
  "spec_json": "https://api.anyplot.ai/specs/probability-weibull",
  "render_light_png": "https://storage.googleapis.com/anyplot-images/plots/probability-weibull/javascript/chartjs/plot-light.png",
  "render_dark_png": "https://storage.googleapis.com/anyplot-images/plots/probability-weibull/javascript/chartjs/plot-dark.png",
  "interactive_light_html": "https://storage.googleapis.com/anyplot-images/plots/probability-weibull/javascript/chartjs/plot-light.html",
  "interactive_dark_html": "https://storage.googleapis.com/anyplot-images/plots/probability-weibull/javascript/chartjs/plot-dark.html",
  "quality_score": 91.0,
  "license": "MIT",
  "guide": "https://anyplot.ai/llms.txt"
}
Part of Weibull Probability Plot for Reliability Analysis on anyplot.ai.