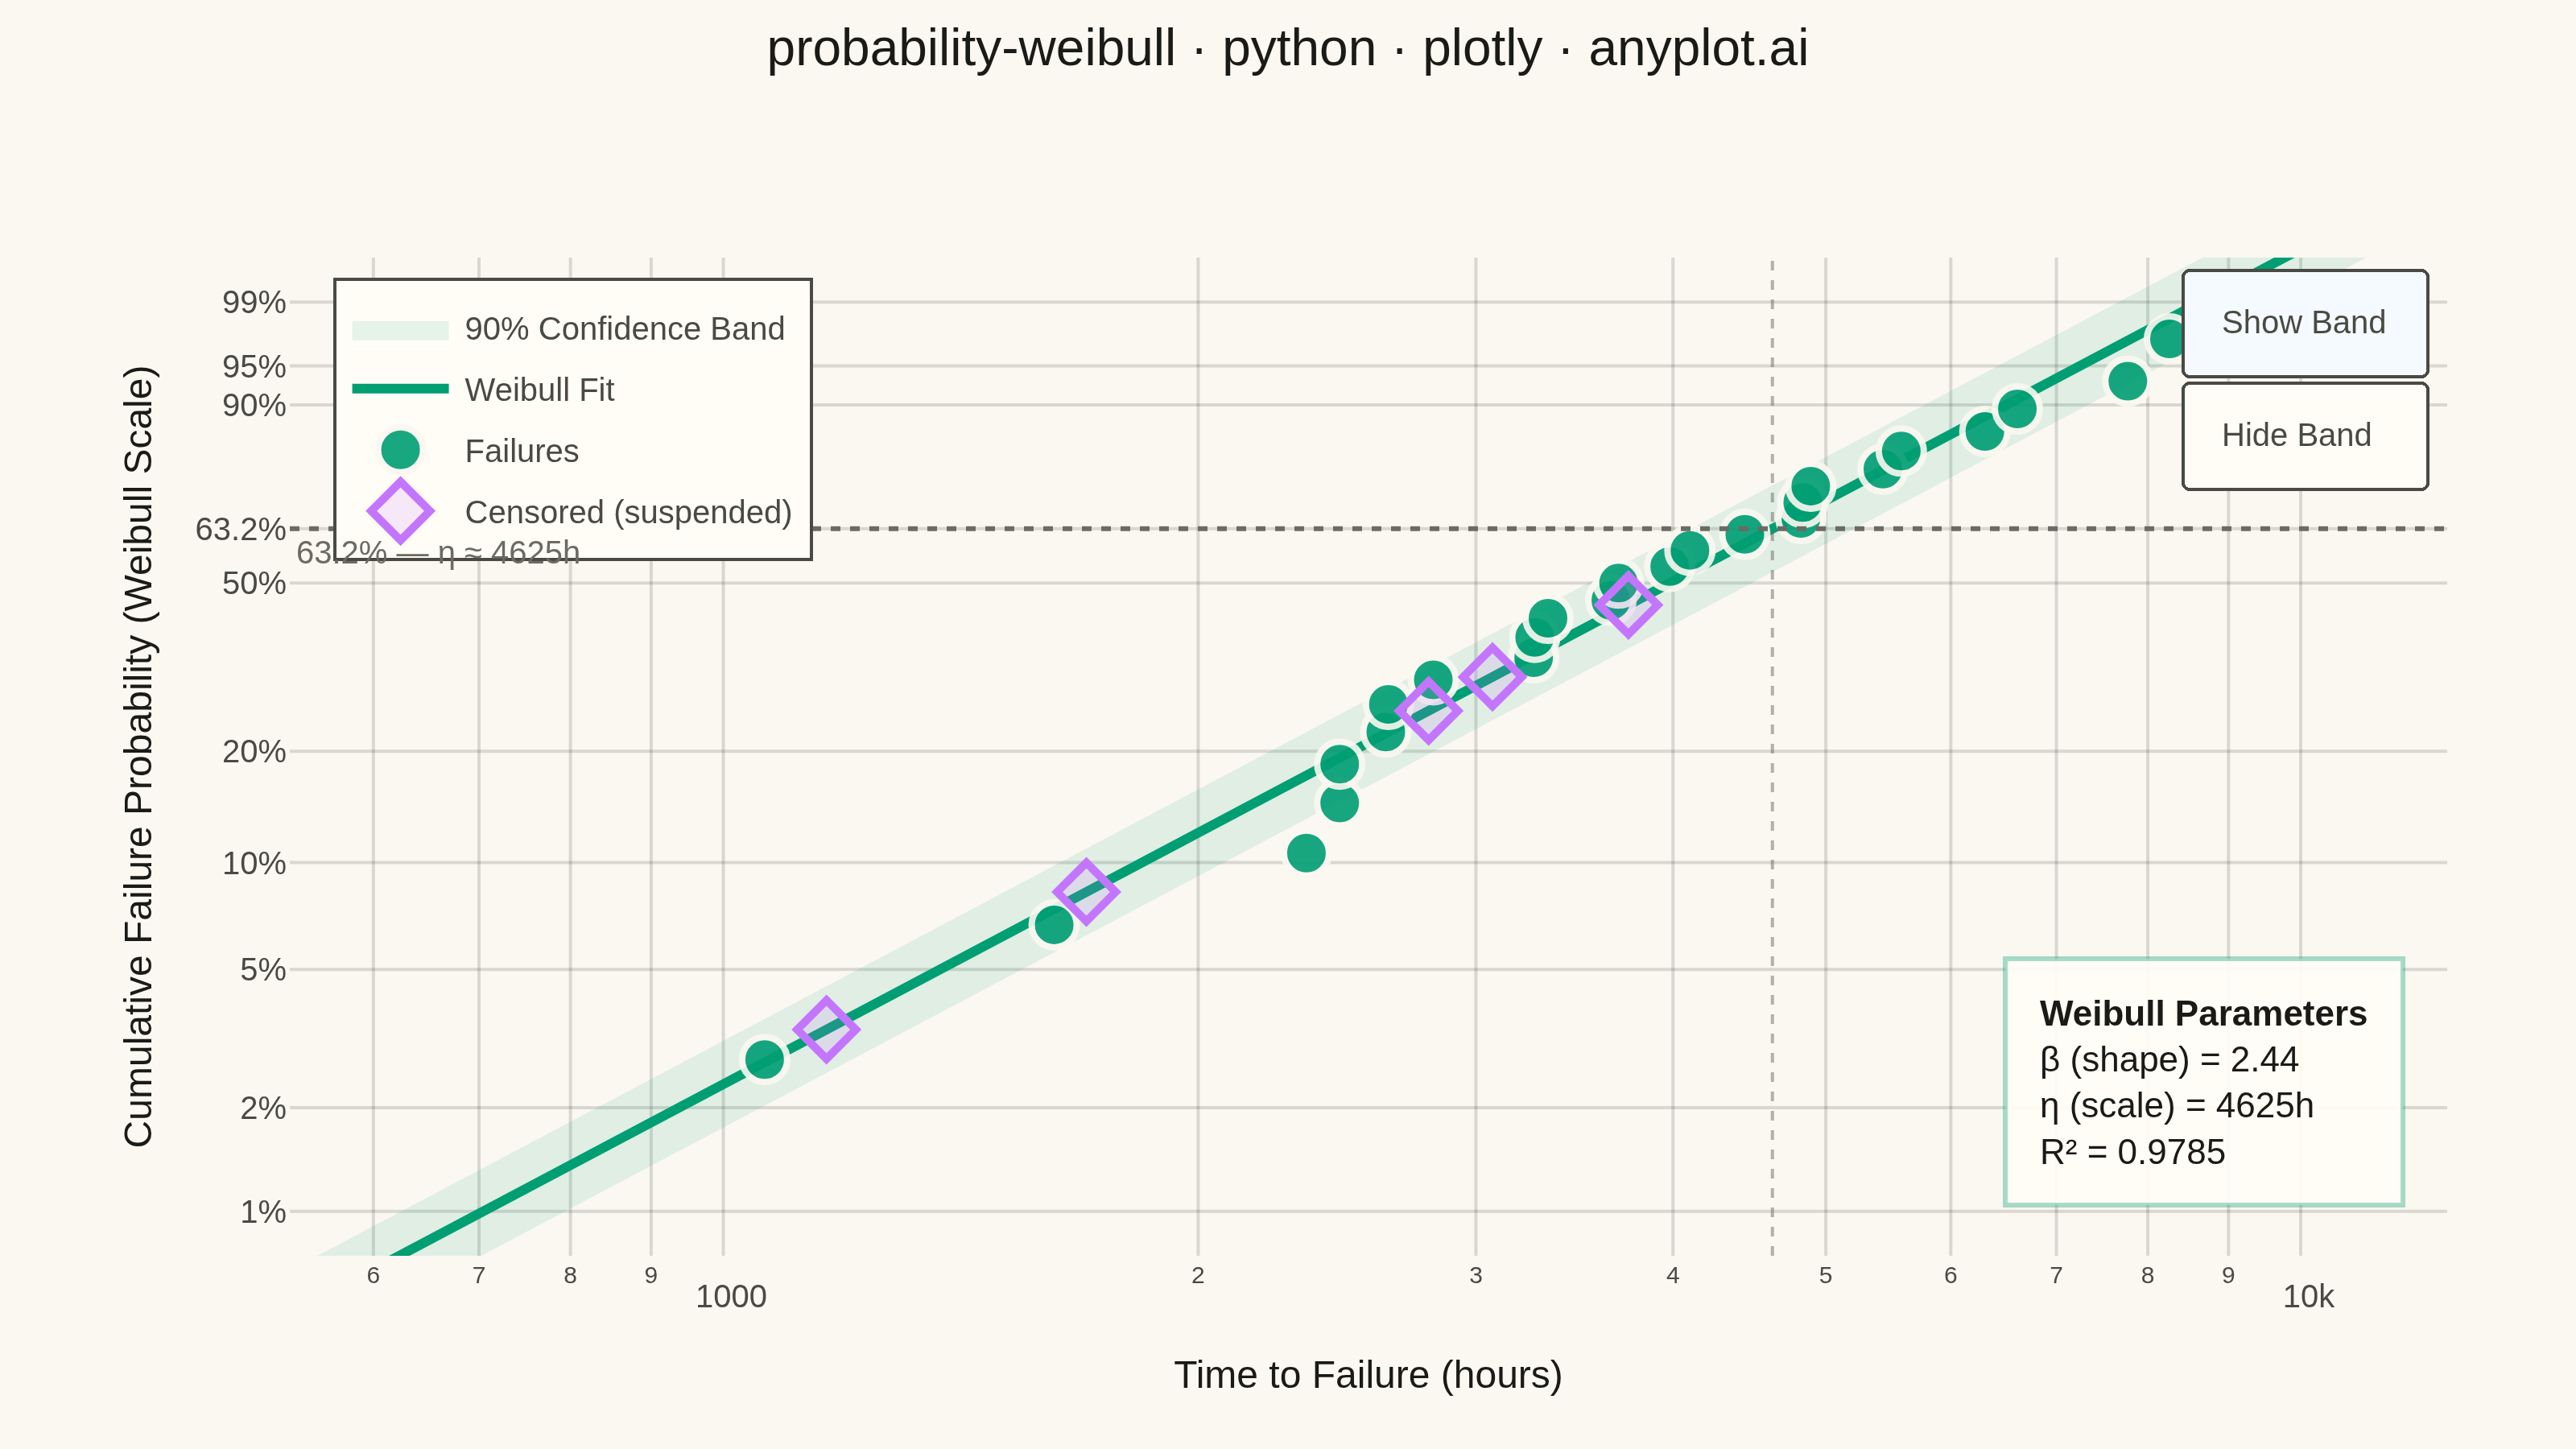
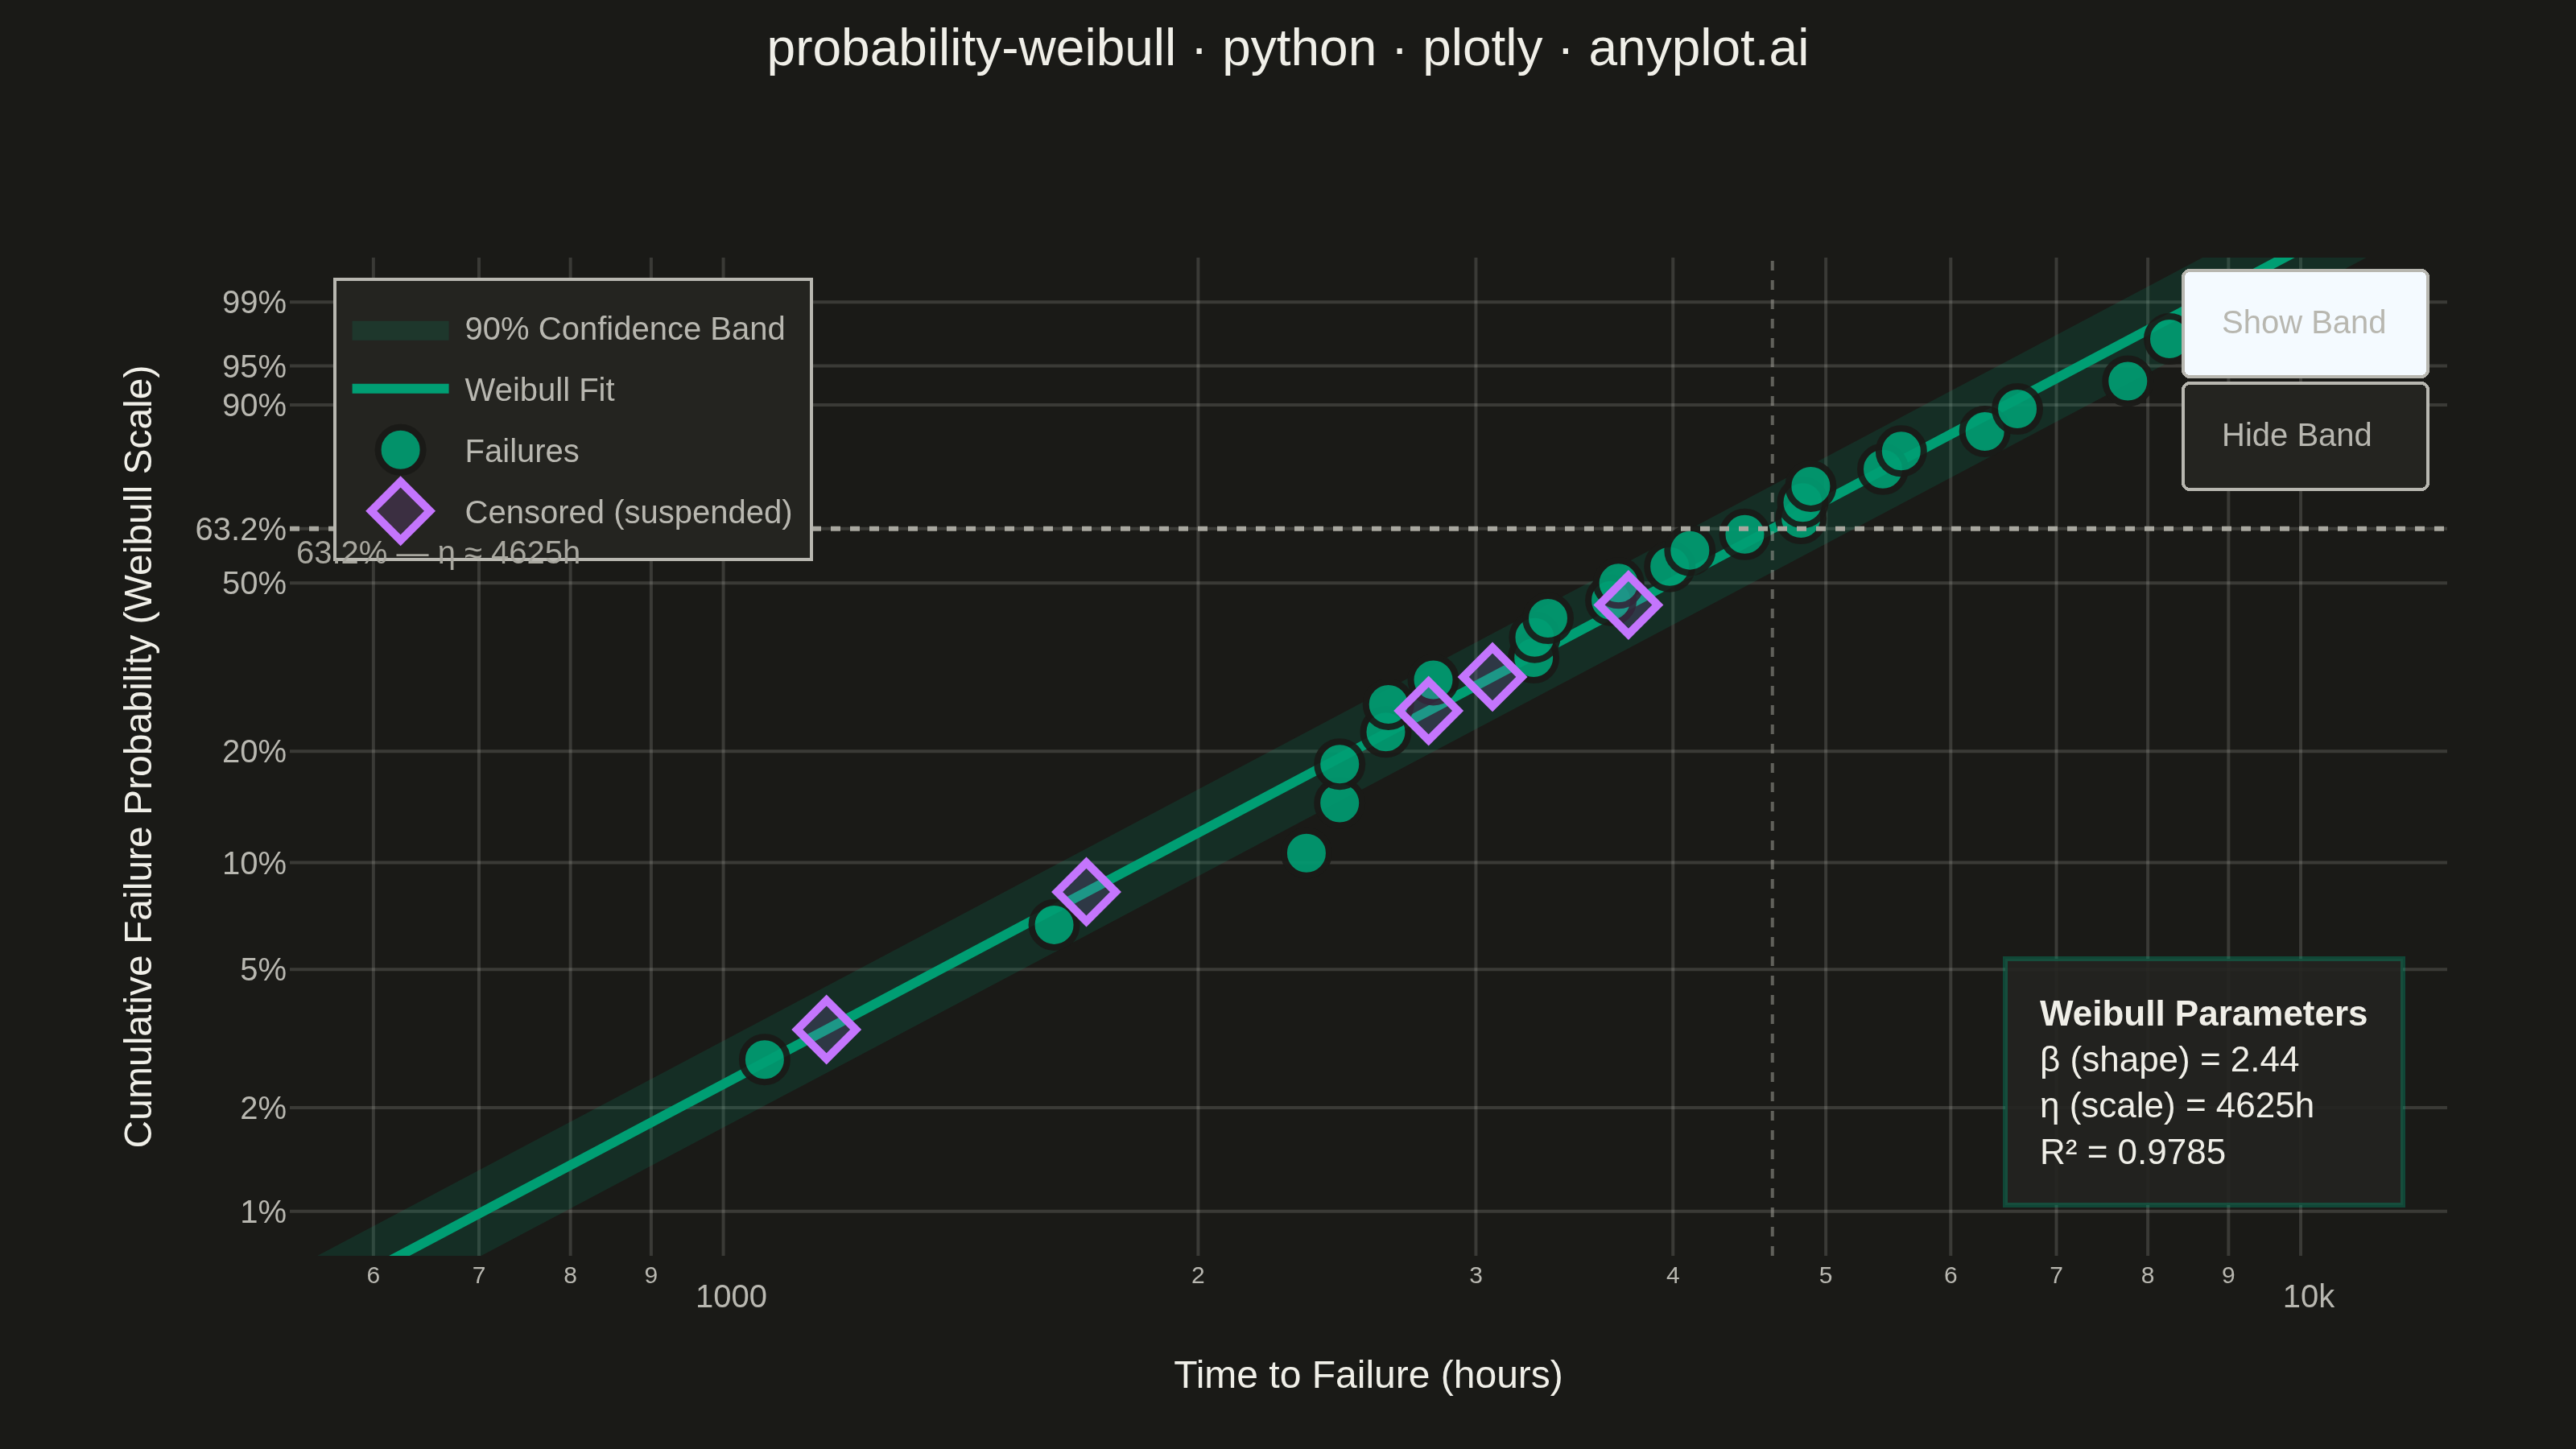
A Weibull probability plot displays failure or lifetime data on Weibull probability paper (logarithmic x-axis for time/cycles, linearized Weibull CDF on y-axis) with a fitted straight line. It is the standard tool in reliability engineering for estimating Weibull distribution parameters (shape and scale), assessing whether data follow a Weibull distribution, and extrapolating failure probabilities. The slope of the fitted line gives the shape parameter (beta), while the characteristic life (eta) is read at the 63.2% failure probability crossing.
""" anyplot.ai
probability-weibull: Weibull Probability Plot for Reliability Analysis
Library: plotly 6.8.0 | Python 3.13.13
Quality: 88/100 | Updated: 2026-06-07
"""

import os
import sys


# Script name matches the library — remove script dir to avoid shadowing the package
_script_dir = os.path.dirname(os.path.abspath(__file__))
sys.path = [p for p in sys.path if os.path.abspath(p) != _script_dir]

import numpy as np
import plotly.graph_objects as go
from scipy import stats


# Theme-adaptive chrome — Imprint palette
THEME = os.getenv("ANYPLOT_THEME", "light")
PAGE_BG = "#FAF8F1" if THEME == "light" else "#1A1A17"
ELEVATED_BG = "#FFFDF6" if THEME == "light" else "#242420"
INK = "#1A1A17" if THEME == "light" else "#F0EFE8"
INK_SOFT = "#4A4A44" if THEME == "light" else "#B8B7B0"
INK_MUTED = "#6B6A63" if THEME == "light" else "#A8A79F"
GRID = "rgba(26,26,23,0.15)" if THEME == "light" else "rgba(240,239,232,0.15)"
GRID_MINOR = "rgba(26,26,23,0.07)" if THEME == "light" else "rgba(240,239,232,0.07)"

# Imprint palette — positions 1 & 2
FAILURE_COLOR = "#009E73"  # brand green — failures / fit line
CENSORED_COLOR = "#C475FD"  # lavender — censored/suspended

font_family = "Helvetica Neue, Helvetica, Arial, sans-serif"

# Data — turbine blade fatigue life (hours)
np.random.seed(42)
n_failures = 25
n_censored = 5
n_total = n_failures + n_censored

shape_true = 2.5
scale_true = 5000
failure_times = np.sort(stats.weibull_min.rvs(shape_true, scale=scale_true, size=n_failures))
censored_times = np.sort(np.random.uniform(1000, 4500, size=n_censored))

all_times = np.concatenate([failure_times, censored_times])
is_censored = np.concatenate([np.zeros(n_failures, dtype=bool), np.ones(n_censored, dtype=bool)])
sort_idx = np.argsort(all_times)
all_times = all_times[sort_idx]
is_censored = is_censored[sort_idx]

# Median rank plotting positions for failures only
failure_ranks = np.zeros(n_total)
rank = 0
for i in range(n_total):
    if not is_censored[i]:
        rank += 1
        failure_ranks[i] = (rank - 0.3) / (n_failures + 0.4)

failure_mask = ~is_censored
failure_t = all_times[failure_mask]
failure_prob = failure_ranks[failure_mask]

# Weibull linearization: y = ln(-ln(1-F))
weibull_y_failures = np.log(-np.log(1 - failure_prob))

# Fit line in Weibull space
slope, intercept, r_value, _, _ = stats.linregress(np.log(failure_t), weibull_y_failures)
beta_fit = slope
eta_fit = np.exp(-intercept / beta_fit)

# Probability axis ticks (Weibull paper y-axis)
prob_ticks = [0.01, 0.02, 0.05, 0.10, 0.20, 0.50, 0.632, 0.90, 0.95, 0.99]
prob_labels = ["1%", "2%", "5%", "10%", "20%", "50%", "63.2%", "90%", "95%", "99%"]
weibull_tick_vals = [np.log(-np.log(1 - p)) for p in prob_ticks]

# Confidence band (90% bounds for fitted line)
t_range = np.logspace(np.log10(failure_t.min() * 0.5), np.log10(failure_t.max() * 1.5), 200)
fit_weibull_y = beta_fit * np.log(t_range) - beta_fit * np.log(eta_fit)
se_fit = np.sqrt(
    np.sum((weibull_y_failures - (beta_fit * np.log(failure_t) - beta_fit * np.log(eta_fit))) ** 2) / (n_failures - 2)
)
conf_upper = fit_weibull_y + 1.645 * se_fit
conf_lower = fit_weibull_y - 1.645 * se_fit

# Figure
fig = go.Figure()

# 90% confidence band (trace 0 — toggleable via update menu)
band_fill = "rgba(0,158,115,0.10)" if THEME == "light" else "rgba(0,158,115,0.16)"
fig.add_trace(
    go.Scatter(
        x=np.concatenate([t_range, t_range[::-1]]),
        y=np.concatenate([conf_upper, conf_lower[::-1]]),
        fill="toself",
        fillcolor=band_fill,
        line={"width": 0},
        name="90% Confidence Band",
        hoverinfo="skip",
        showlegend=True,
    )
)

# Fitted line (trace 1)
fig.add_trace(
    go.Scatter(
        x=t_range,
        y=fit_weibull_y,
        mode="lines",
        name="Weibull Fit",
        line={"color": FAILURE_COLOR, "width": 3},
        hovertemplate="Time: %{x:.0f}h<br>Probability: %{customdata:.1%}<extra>Weibull Fit</extra>",
        customdata=1 - np.exp(-np.exp(fit_weibull_y)),
    )
)

# Failure data points (trace 2)
fig.add_trace(
    go.Scatter(
        x=failure_t,
        y=weibull_y_failures,
        mode="markers",
        name="Failures",
        marker={"size": 14, "color": FAILURE_COLOR, "line": {"color": PAGE_BG, "width": 2}, "opacity": 0.9},
        hovertemplate=(
            "<b>Failure #%{text}</b><br>Time: %{x:.0f} hours<br>Cum. Probability: %{customdata:.1%}<extra></extra>"
        ),
        customdata=failure_prob,
        text=[f"{i + 1}/{n_failures}" for i in range(n_failures)],
    )
)

# Censored data points (trace 3)
censored_t = all_times[is_censored]
censored_weibull_y = beta_fit * np.log(censored_t) - beta_fit * np.log(eta_fit)
censored_prob_est = 1 - np.exp(-np.exp(censored_weibull_y))
fig.add_trace(
    go.Scatter(
        x=censored_t,
        y=censored_weibull_y,
        mode="markers",
        name="Censored (suspended)",
        marker={
            "size": 14,
            "color": "rgba(196,117,253,0.15)",
            "line": {"color": CENSORED_COLOR, "width": 2.5},
            "symbol": "diamond",
        },
        hovertemplate=(
            "<b>Censored Observation</b><br>Time: %{x:.0f} hours<br>Est. Probability: %{customdata:.1%}<extra></extra>"
        ),
        customdata=censored_prob_est,
    )
)

# 63.2% characteristic life reference line
weibull_632 = np.log(-np.log(1 - 0.632))
fig.add_hline(
    y=weibull_632,
    line_dash="dot",
    line_color=INK_MUTED,
    line_width=1.5,
    annotation_text=f"63.2% — η ≈ {eta_fit:.0f}h",
    annotation_position="bottom left",
    annotation_font={"size": 10, "color": INK_MUTED, "family": font_family},
)
fig.add_vline(x=eta_fit, line_dash="dot", line_color=INK_MUTED, line_width=1, opacity=0.5)

# Parameter box (lower-right corner, paper coordinates to avoid log-scale issues)
annot_bg = "rgba(255,253,246,0.93)" if THEME == "light" else "rgba(36,36,32,0.93)"
annot_border = "rgba(0,158,115,0.35)"
fig.add_annotation(
    x=0.98,
    y=0.05,
    xref="paper",
    yref="paper",
    text=(
        f"<b>Weibull Parameters</b><br>"
        f"β (shape) = {beta_fit:.2f}<br>"
        f"η (scale) = {eta_fit:.0f}h<br>"
        f"R² = {r_value**2:.4f}"
    ),
    showarrow=False,
    font={"size": 11, "color": INK, "family": font_family},
    align="left",
    bgcolor=annot_bg,
    bordercolor=annot_border,
    borderwidth=1.5,
    borderpad=10,
    xanchor="right",
    yanchor="bottom",
)

# B10 life annotation — points to actual data coordinate
b10_life = eta_fit * (-np.log(1 - 0.10)) ** (1 / beta_fit)
weibull_10 = np.log(-np.log(1 - 0.10))
fig.add_annotation(
    x=b10_life,
    y=weibull_10,
    xref="x",
    yref="y",
    text=f"B10 = {b10_life:.0f}h",
    showarrow=True,
    arrowhead=2,
    arrowsize=1,
    arrowcolor=INK_SOFT,
    ax=55,
    ay=28,
    font={"size": 10, "color": INK_MUTED, "family": font_family},
    bgcolor=annot_bg,
    bordercolor="rgba(26,26,23,0.12)" if THEME == "light" else "rgba(240,239,232,0.12)",
    borderwidth=1,
    borderpad=5,
)

# Update menu — toggle confidence band on/off (LM-01 advanced Plotly pattern)
fig.update_layout(
    updatemenus=[
        {
            "type": "buttons",
            "showactive": True,
            "x": 0.99,
            "y": 0.99,
            "xanchor": "right",
            "yanchor": "top",
            "bgcolor": ELEVATED_BG,
            "bordercolor": INK_SOFT,
            "font": {"color": INK_SOFT, "size": 10, "family": font_family},
            "buttons": [
                {"label": "Show Band", "method": "update", "args": [{"visible": [True, True, True, True]}]},
                {"label": "Hide Band", "method": "update", "args": [{"visible": [False, True, True, True]}]},
            ],
        }
    ]
)

# Layout
fig.update_layout(
    autosize=False,
    width=800,
    height=450,
    paper_bgcolor=PAGE_BG,
    plot_bgcolor=PAGE_BG,
    font={"color": INK, "family": font_family},
    template="plotly_white",
    title={
        "text": "probability-weibull · python · plotly · anyplot.ai",
        "font": {"size": 16, "family": font_family, "color": INK},
        "x": 0.5,
        "y": 0.98,
        "xanchor": "center",
        "yanchor": "top",
    },
    xaxis={
        "title": {
            "text": "Time to Failure (hours)",
            "font": {"size": 12, "family": font_family, "color": INK},
            "standoff": 15,
        },
        "tickfont": {"size": 10, "family": font_family, "color": INK_SOFT},
        "type": "log",
        "showgrid": True,
        "gridcolor": GRID,
        "gridwidth": 1,
        "showline": False,
        "minor": {"showgrid": True, "gridcolor": GRID_MINOR},
        "zeroline": False,
    },
    yaxis={
        "title": {
            "text": "Cumulative Failure Probability (Weibull Scale)",
            "font": {"size": 12, "family": font_family, "color": INK},
            "standoff": 10,
        },
        "tickfont": {"size": 10, "family": font_family, "color": INK_SOFT},
        "tickmode": "array",
        "tickvals": weibull_tick_vals,
        "ticktext": prob_labels,
        "showgrid": True,
        "gridcolor": GRID,
        "gridwidth": 1,
        "showline": False,
        "range": [weibull_tick_vals[0] - 0.3, weibull_tick_vals[-1] + 0.3],
        "zeroline": False,
    },
    legend={
        "font": {"size": 10, "family": font_family, "color": INK_SOFT},
        "x": 0.02,
        "y": 0.98,
        "bgcolor": ELEVATED_BG,
        "bordercolor": INK_SOFT,
        "borderwidth": 1,
    },
    margin={"l": 90, "r": 40, "t": 80, "b": 60},
    hoverlabel={"font": {"size": 10, "family": font_family}, "bgcolor": ELEVATED_BG, "bordercolor": FAILURE_COLOR},
)

# Save
fig.write_image(f"plot-{THEME}.png", width=800, height=450, scale=4)
fig.write_html(f"plot-{THEME}.html", include_plotlyjs="cdn")
Runnable source as JSON, for any HTTP client: https://api.anyplot.ai/specs/probability-weibull/plotly/code. Any spec id and library id listed in llms-full.txt fit the same URL shape; every URL below is complete and callable.
{
  "spec_id": "probability-weibull",
  "language": "python",
  "library": "plotly",
  "page": "https://anyplot.ai/probability-weibull/python/plotly",
  "hub": "https://anyplot.ai/probability-weibull",
  "code_json": "https://api.anyplot.ai/specs/probability-weibull/plotly/code",
  "spec_json": "https://api.anyplot.ai/specs/probability-weibull",
  "render_light_png": "https://storage.googleapis.com/anyplot-images/plots/probability-weibull/python/plotly/plot-light.png",
  "render_dark_png": "https://storage.googleapis.com/anyplot-images/plots/probability-weibull/python/plotly/plot-dark.png",
  "interactive_light_html": "https://storage.googleapis.com/anyplot-images/plots/probability-weibull/python/plotly/plot-light.html",
  "interactive_dark_html": "https://storage.googleapis.com/anyplot-images/plots/probability-weibull/python/plotly/plot-dark.html",
  "quality_score": 88.0,
  "license": "MIT",
  "guide": "https://anyplot.ai/llms.txt"
}
Part of Weibull Probability Plot for Reliability Analysis on anyplot.ai.