The same plot in 14 other libraries — JavaScript: Chart.js, D3.js, Highcharts, MUI X Charts; Python: Altair, Bokeh, lets-plot, Matplotlib, Plotly, plotnine, Pygal, Seaborn; R: ggplot2; Julia: Makie.jl. Compare all 15 side by side: Weibull Probability Plot for Reliability Analysis in Python, R, Julia and JavaScript.
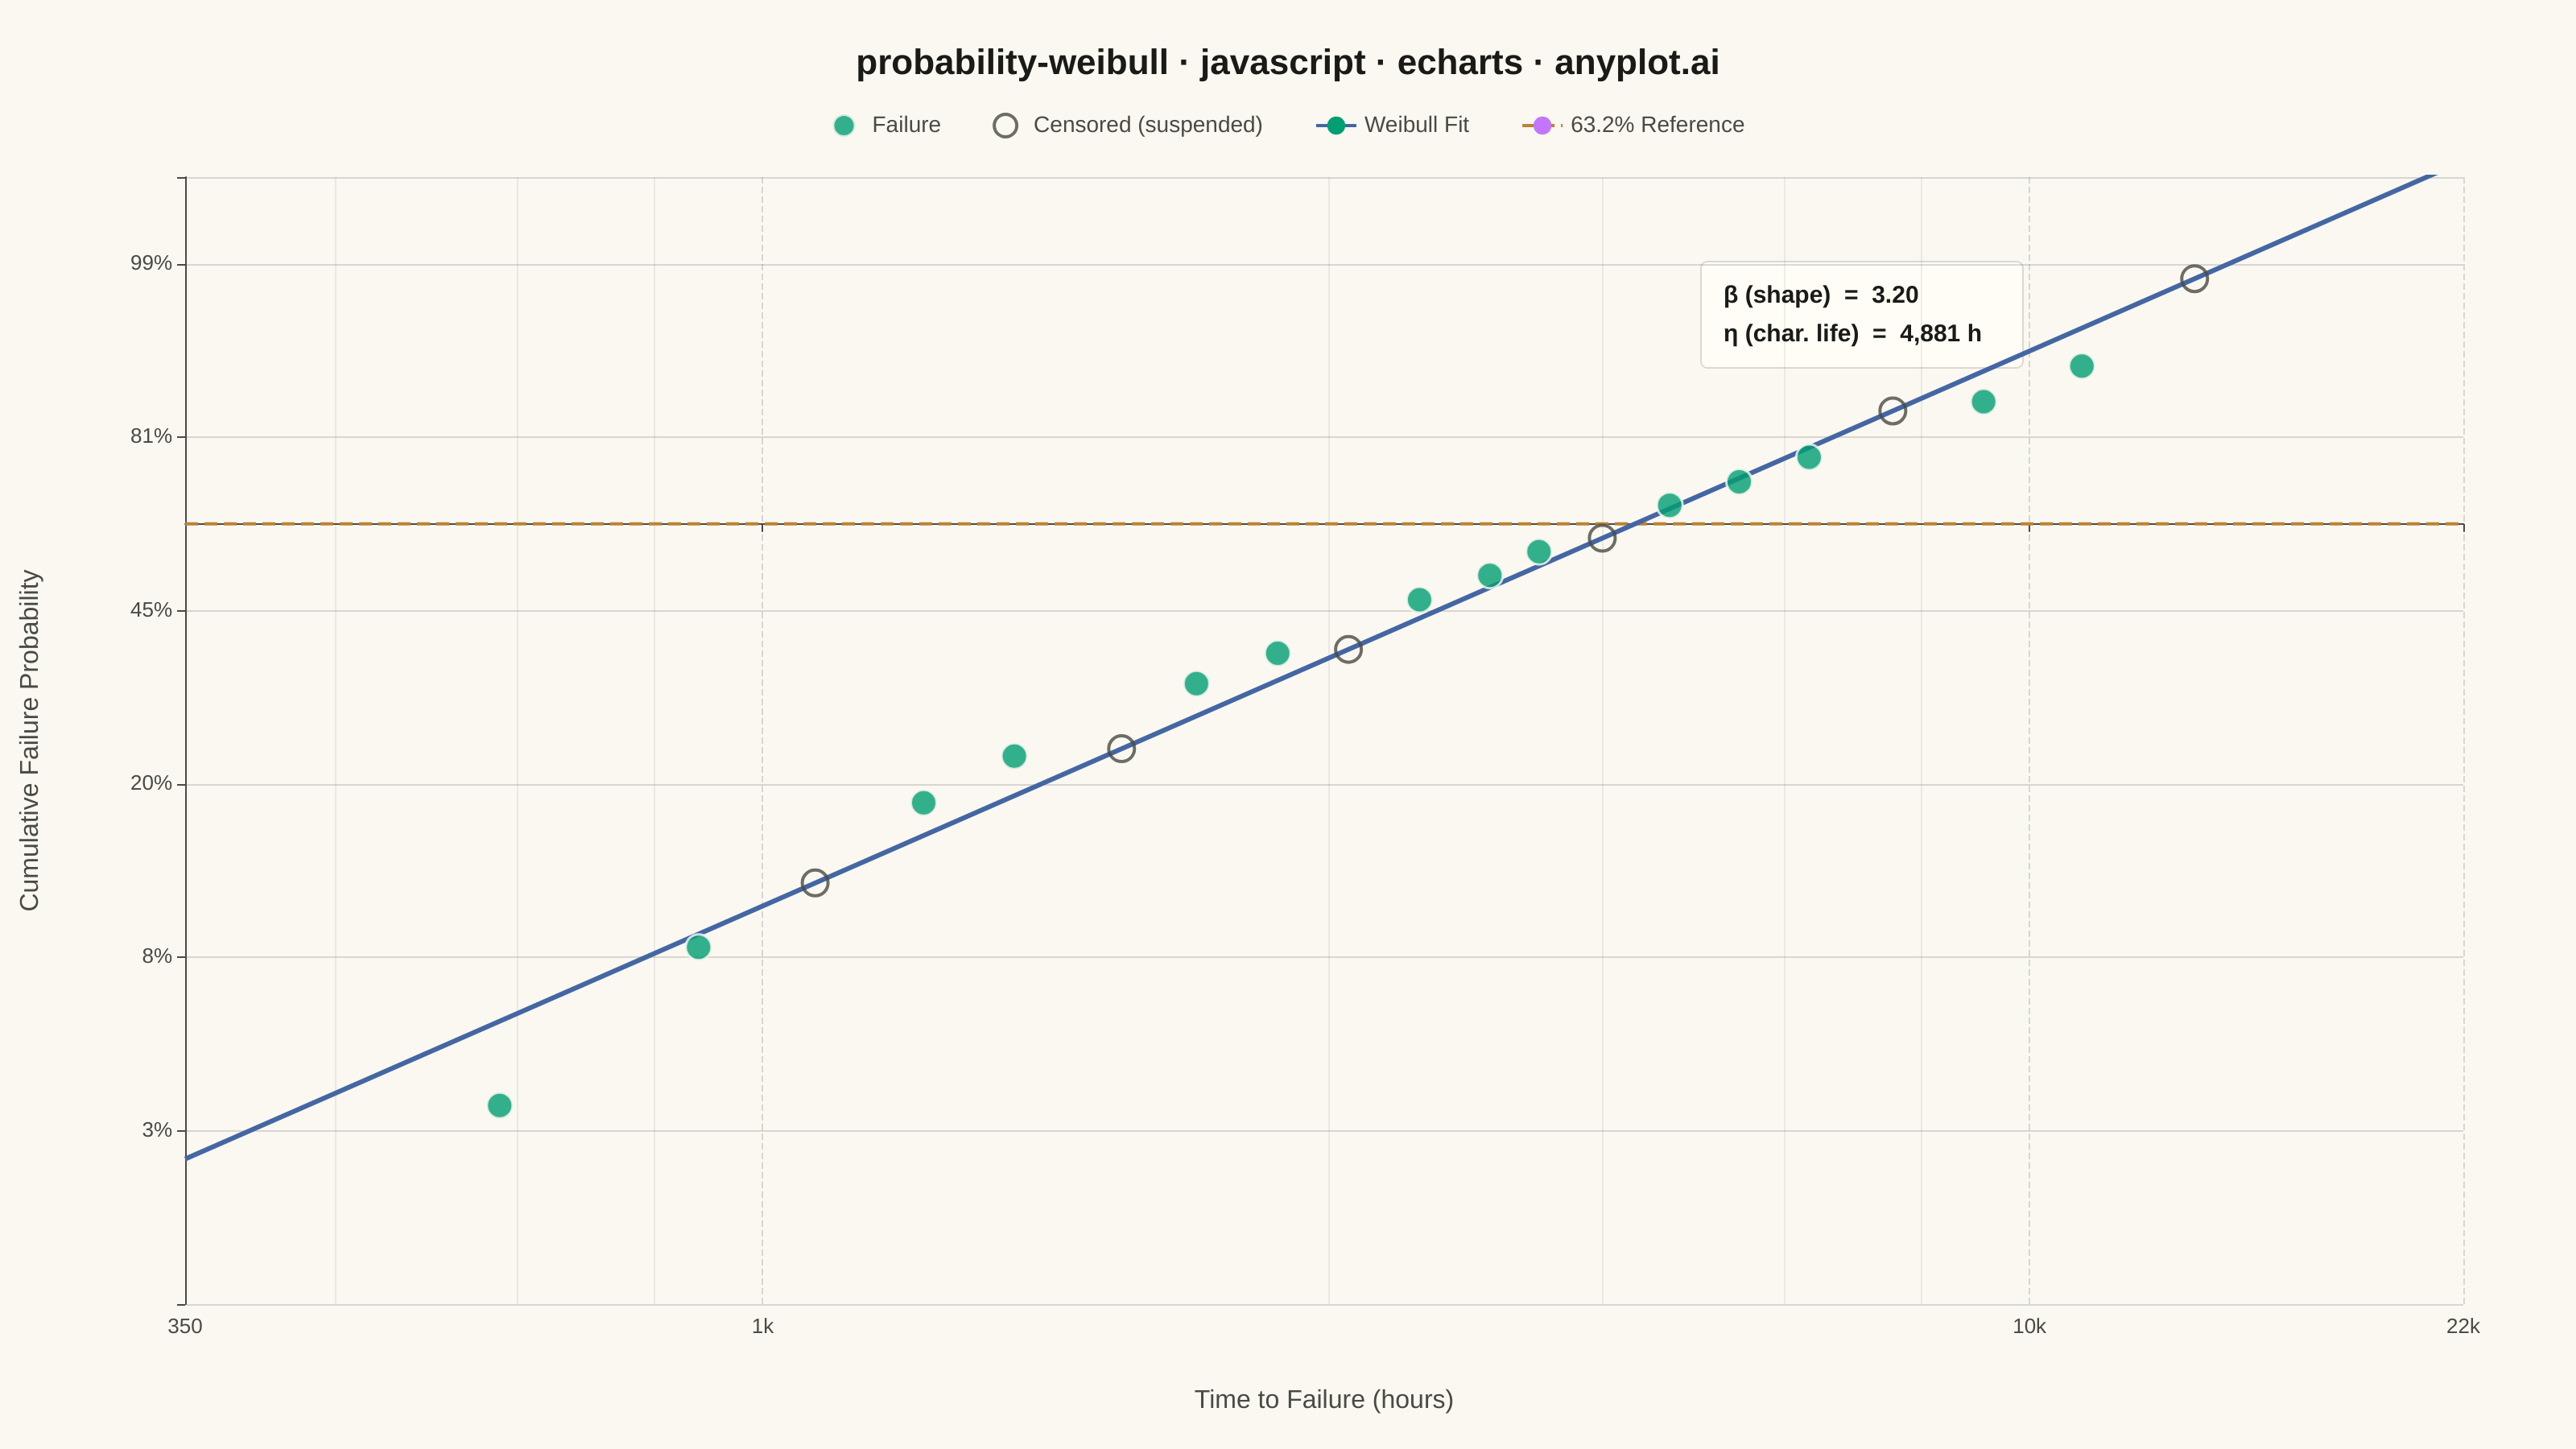
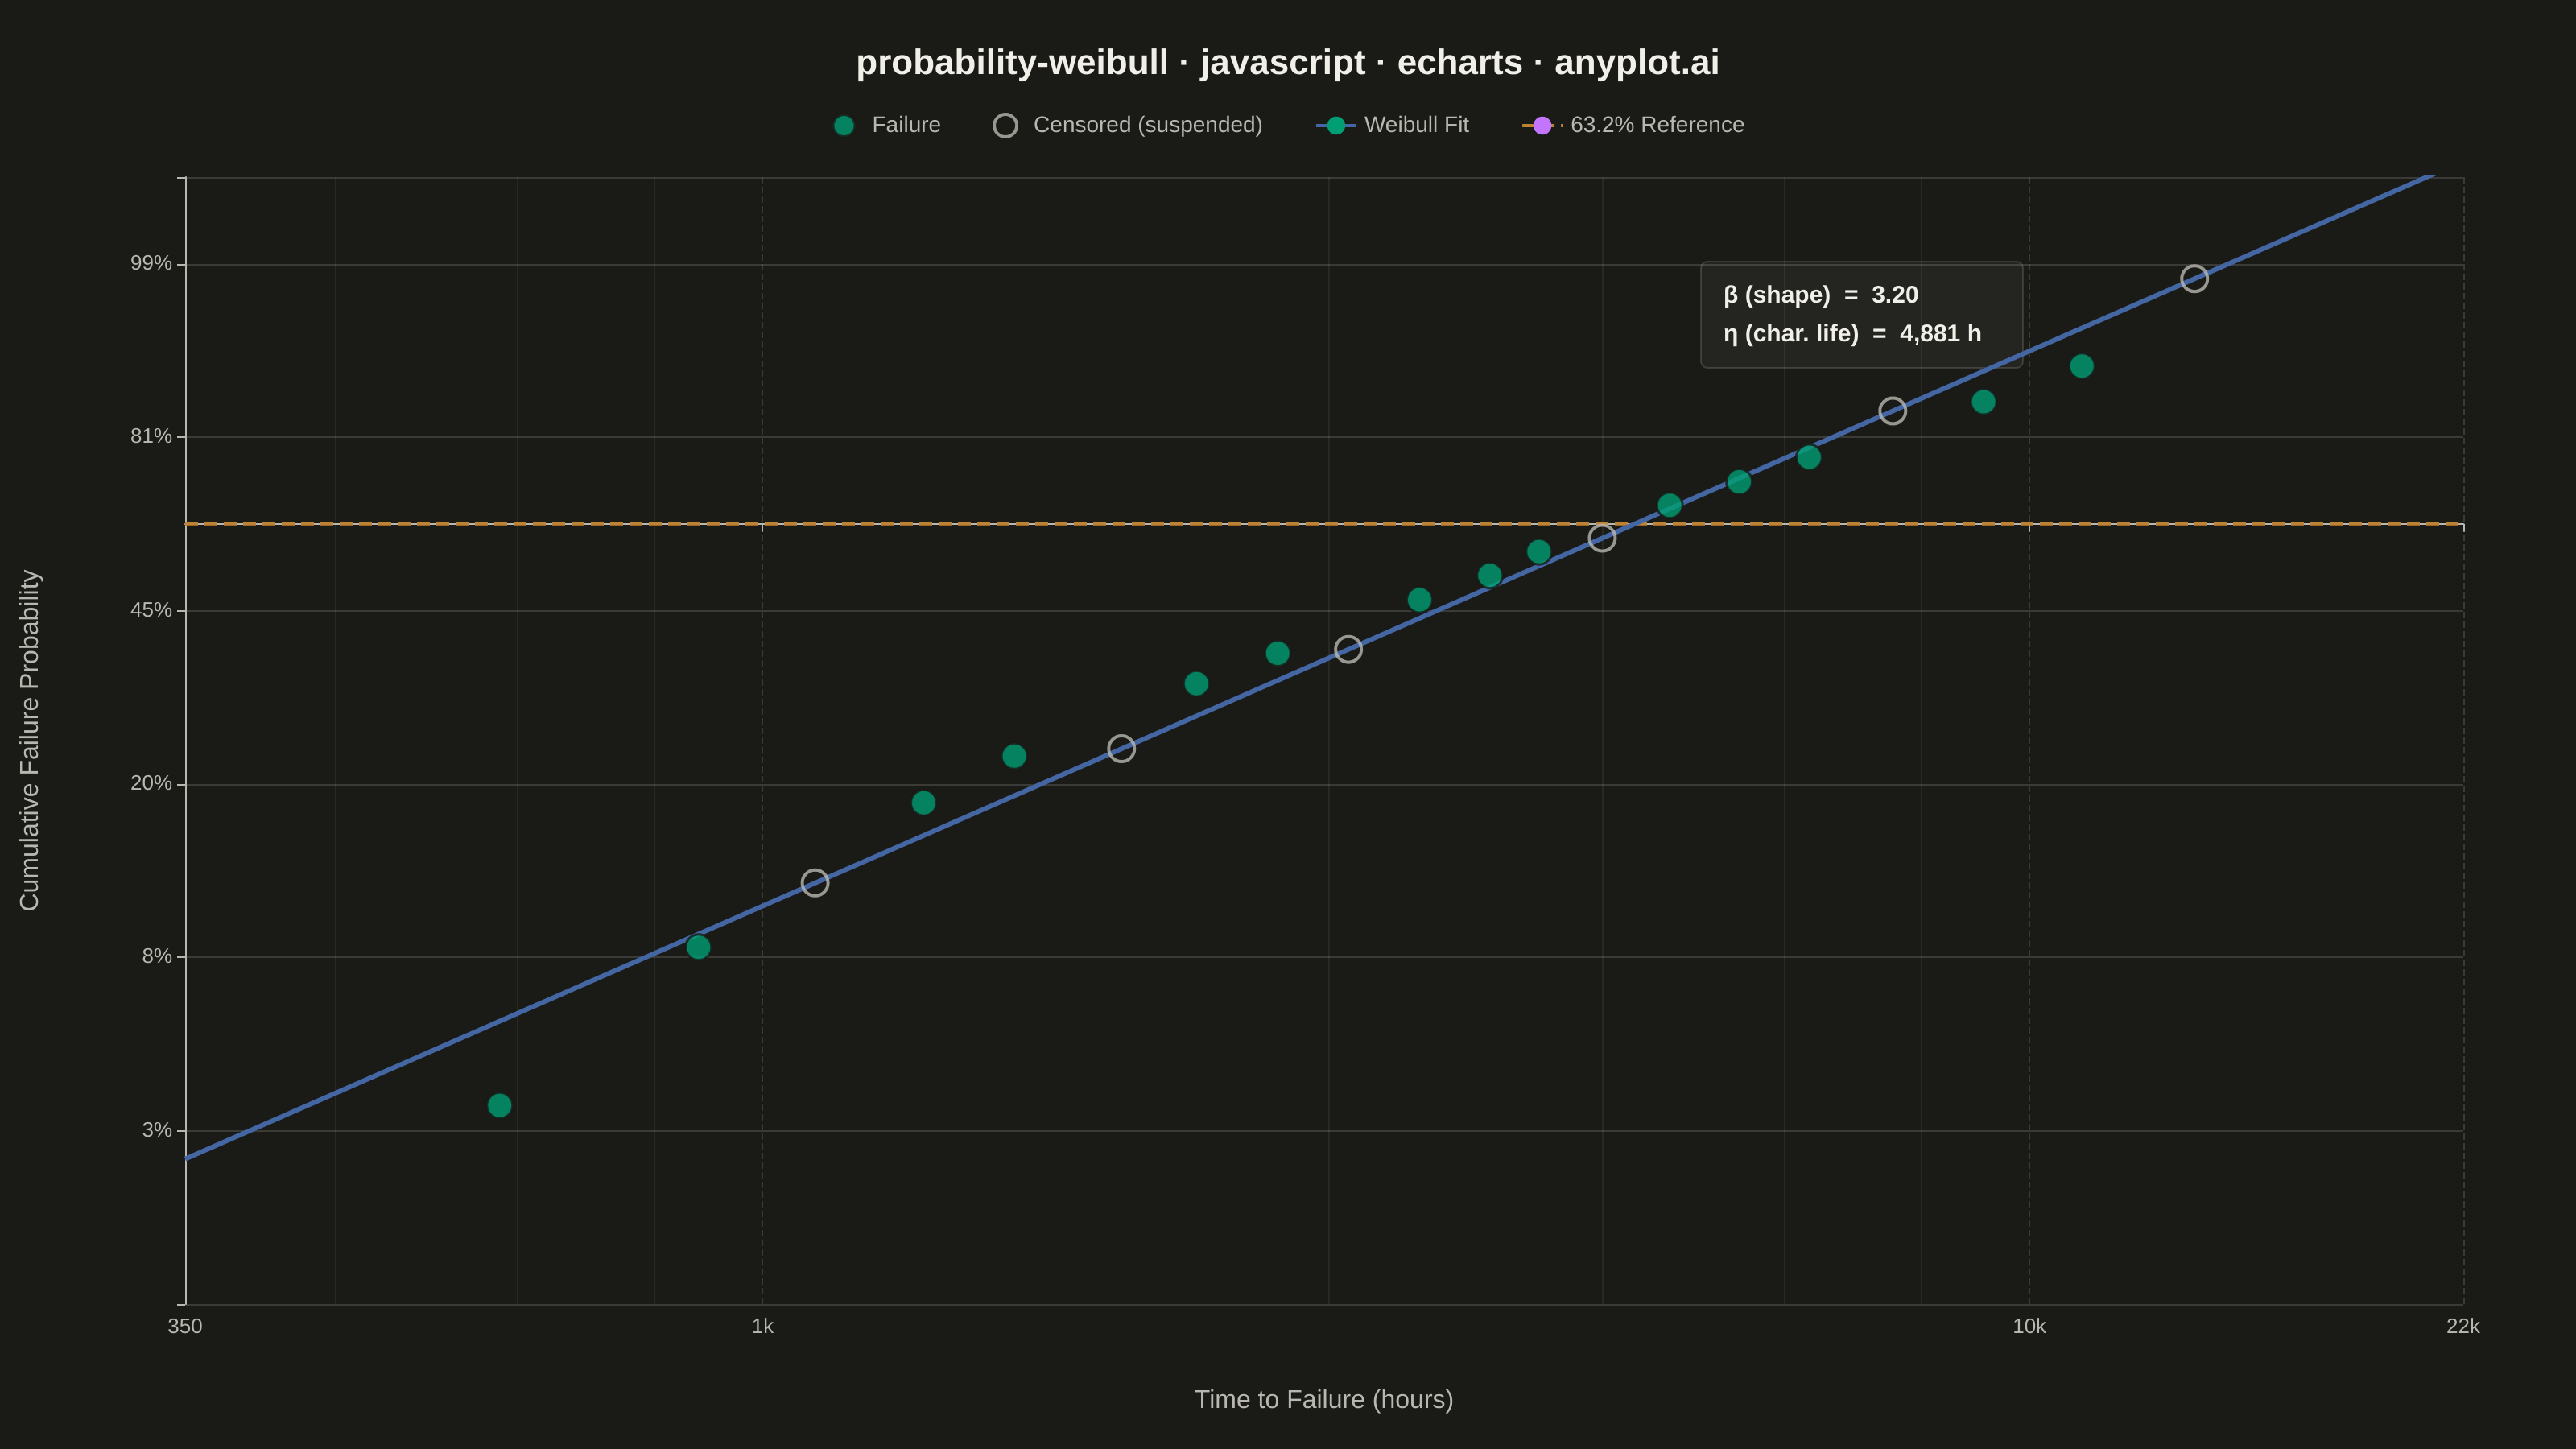
A Weibull probability plot displays failure or lifetime data on Weibull probability paper (logarithmic x-axis for time/cycles, linearized Weibull CDF on y-axis) with a fitted straight line. It is the standard tool in reliability engineering for estimating Weibull distribution parameters (shape and scale), assessing whether data follow a Weibull distribution, and extrapolating failure probabilities. The slope of the fitted line gives the shape parameter (beta), while the characteristic life (eta) is read at the 63.2% failure probability crossing.
// anyplot.ai
// probability-weibull: Weibull Probability Plot for Reliability Analysis
// Library: echarts 5.5.1 | JavaScript 22.22.3
// Quality: 90/100 | Created: 2026-06-07
//# anyplot-orientation: landscape
// anyplot.ai
// probability-weibull: Weibull Probability Plot for Reliability Analysis
// Library: echarts 5.5.1 | JavaScript 22
// Quality: pending | Created: 2026-06-07

const t = window.ANYPLOT_TOKENS;

// --- Data: hydraulic pump service-life study (hours, n=20) ---
// 14 failures, 6 right-censored (still running at inspection end)
// Already sorted ascending by time — required for rank assignment
const observations = [
  { time: 620,   fail: true  },
  { time: 890,   fail: true  },
  { time: 1100,  fail: false },
  { time: 1340,  fail: true  },
  { time: 1580,  fail: true  },
  { time: 1920,  fail: false },
  { time: 2200,  fail: true  },
  { time: 2550,  fail: true  },
  { time: 2900,  fail: false },
  { time: 3300,  fail: true  },
  { time: 3750,  fail: true  },
  { time: 4100,  fail: true  },
  { time: 4600,  fail: false },
  { time: 5200,  fail: true  },
  { time: 5900,  fail: true  },
  { time: 6700,  fail: true  },
  { time: 7800,  fail: false },
  { time: 9200,  fail: true  },
  { time: 11000, fail: true  },
  { time: 13500, fail: false },
];

const n = observations.length;

// Median rank (i - 0.3) / (n + 0.4) where i = 1-based rank among ALL observations
const failurePoints = [];
const censoredTimes = [];

observations.forEach((obs, idx) => {
  const i = idx + 1;
  if (obs.fail) {
    const F  = (i - 0.3) / (n + 0.4);
    const yW = Math.log(-Math.log(1 - F));
    failurePoints.push({ time: obs.time, F, yW });
  } else {
    censoredTimes.push(obs.time);
  }
});

// Linear regression: log10(time) vs Weibull y  →  estimates beta (shape) and eta (scale)
const logT  = failurePoints.map(p => Math.log10(p.time));
const yVals = failurePoints.map(p => p.yW);
const nF    = failurePoints.length;
const mLogT = logT.reduce((a, b) => a + b, 0) / nF;
const mY    = yVals.reduce((a, b) => a + b, 0) / nF;
let ssXX = 0, ssXY = 0;
for (let i = 0; i < nF; i++) {
  ssXX += (logT[i] - mLogT) ** 2;
  ssXY += (logT[i] - mLogT) * (yVals[i] - mY);
}
const beta      = ssXY / ssXX;                        // shape parameter β
const intercept = mY - beta * mLogT;
const eta       = Math.pow(10, -intercept / beta);    // characteristic life η (hours)

// Fitted line spanning the full x range
const tMin = 350, tMax = 22000;
const fitData = [
  [tMin, beta * Math.log10(tMin) + intercept],
  [tMax, beta * Math.log10(tMax) + intercept],
];

// Censored markers: project each suspended time onto the fitted line for y-position
const censoredData = censoredTimes.map(time => [
  time,
  beta * Math.log10(time) + intercept,
]);

// Parameter labels
const betaStr = beta.toFixed(2);
const etaStr  = Math.round(eta).toLocaleString();

// --- Init ---
const chart = echarts.init(document.getElementById("container"));

// --- Option ---
chart.setOption({
  animation: false,
  color: t.palette,
  backgroundColor: "transparent",

  title: {
    text: "probability-weibull · javascript · echarts · anyplot.ai",
    left: "center",
    top: 24,
    textStyle: { color: t.ink, fontSize: 22, fontWeight: "bold" },
  },

  legend: {
    top: 65,
    left: "center",
    textStyle: { color: t.inkSoft, fontSize: 14 },
    itemGap: 32,
    data: [
      { name: "Failure", icon: "circle" },
      { name: "Censored (suspended)", icon: "circle" },
      { name: "Weibull Fit" },
      { name: "63.2% Reference" },
    ],
  },

  grid: { left: 115, right: 70, top: 110, bottom: 90 },

  xAxis: {
    type: "log",
    name: "Time to Failure (hours)",
    nameLocation: "middle",
    nameGap: 52,
    nameTextStyle: { color: t.inkSoft, fontSize: 16 },
    min: tMin,
    max: tMax,
    axisLabel: {
      color: t.inkSoft,
      fontSize: 13,
      formatter: val => {
        if (val >= 10000) return (val / 1000).toFixed(0) + "k";
        if (val >= 1000)  return (val / 1000).toFixed(0) + "k";
        return String(val);
      },
    },
    axisLine: { lineStyle: { color: t.inkSoft } },
    splitLine: { lineStyle: { color: t.grid, type: "dashed" } },
    minorSplitLine: { show: true, lineStyle: { color: t.grid, opacity: 0.45 } },
  },

  yAxis: {
    type: "value",
    name: "Cumulative Failure Probability",
    nameLocation: "middle",
    nameGap: 88,
    nameTextStyle: { color: t.inkSoft, fontSize: 16 },
    min: -4.5,
    max: 2.0,
    interval: 1,
    axisLabel: {
      color: t.inkSoft,
      fontSize: 13,
      // Convert Weibull y-value back to a readable probability percentage
      formatter: val => {
        if (val < -4.3 || val > 1.85) return "";
        const F   = 1 - Math.exp(-Math.exp(val));
        const pct = F * 100;
        return pct < 1 ? pct.toFixed(1) + "%" : Math.round(pct) + "%";
      },
    },
    axisLine: { lineStyle: { color: t.inkSoft } },
    splitLine: { lineStyle: { color: t.grid } },
  },

  series: [
    // Weibull fitted line
    {
      name: "Weibull Fit",
      type: "line",
      data: fitData,
      symbol: "none",
      lineStyle: { color: t.palette[2], width: 3 },
      z: 2,
    },
    // Horizontal reference at 63.2% cumulative probability (y = 0)
    {
      name: "63.2% Reference",
      type: "line",
      data: [[tMin, 0], [tMax, 0]],
      symbol: "none",
      lineStyle: { color: t.palette[3], width: 2, type: "dashed" },
      z: 1,
    },
    // Failure observations — filled circles
    {
      name: "Failure",
      type: "scatter",
      data: failurePoints.map(p => [p.time, p.yW]),
      symbolSize: 16,
      itemStyle: {
        color: t.palette[0],
        borderColor: t.pageBg,
        borderWidth: 1.5,
      },
      z: 3,
    },
    // Censored (suspended) observations — hollow circles at projected y position
    {
      name: "Censored (suspended)",
      type: "scatter",
      data: censoredData,
      symbolSize: 16,
      itemStyle: {
        color: "transparent",
        borderColor: t.inkSoft,
        borderWidth: 2,
      },
      z: 3,
    },
  ],

  // Weibull parameter annotation
  graphic: [
    {
      type: "group",
      left: "66%",
      top: "18%",
      children: [
        {
          type: "rect",
          shape: { width: 200, height: 66, r: 4 },
          style: { fill: t.elevatedBg, stroke: t.grid, lineWidth: 1 },
        },
        {
          type: "text",
          style: {
            text: `β (shape)  =  ${betaStr}`,
            fill: t.ink,
            fontSize: 15,
            fontWeight: "bold",
            x: 14,
            y: 14,
          },
        },
        {
          type: "text",
          style: {
            text: `η (char. life)  =  ${etaStr} h`,
            fill: t.ink,
            fontSize: 15,
            fontWeight: "bold",
            x: 14,
            y: 38,
          },
        },
      ],
    },
  ],
});
Runnable source as JSON, for any HTTP client: https://api.anyplot.ai/specs/probability-weibull/echarts/code. Any spec id and library id listed in llms-full.txt fit the same URL shape; every URL below is complete and callable.
{
  "spec_id": "probability-weibull",
  "language": "javascript",
  "library": "echarts",
  "page": "https://anyplot.ai/probability-weibull/javascript/echarts",
  "hub": "https://anyplot.ai/probability-weibull",
  "code_json": "https://api.anyplot.ai/specs/probability-weibull/echarts/code",
  "spec_json": "https://api.anyplot.ai/specs/probability-weibull",
  "render_light_png": "https://storage.googleapis.com/anyplot-images/plots/probability-weibull/javascript/echarts/plot-light.png",
  "render_dark_png": "https://storage.googleapis.com/anyplot-images/plots/probability-weibull/javascript/echarts/plot-dark.png",
  "interactive_light_html": "https://storage.googleapis.com/anyplot-images/plots/probability-weibull/javascript/echarts/plot-light.html",
  "interactive_dark_html": "https://storage.googleapis.com/anyplot-images/plots/probability-weibull/javascript/echarts/plot-dark.html",
  "quality_score": 90.0,
  "license": "MIT",
  "guide": "https://anyplot.ai/llms.txt"
}
Part of Weibull Probability Plot for Reliability Analysis on anyplot.ai.