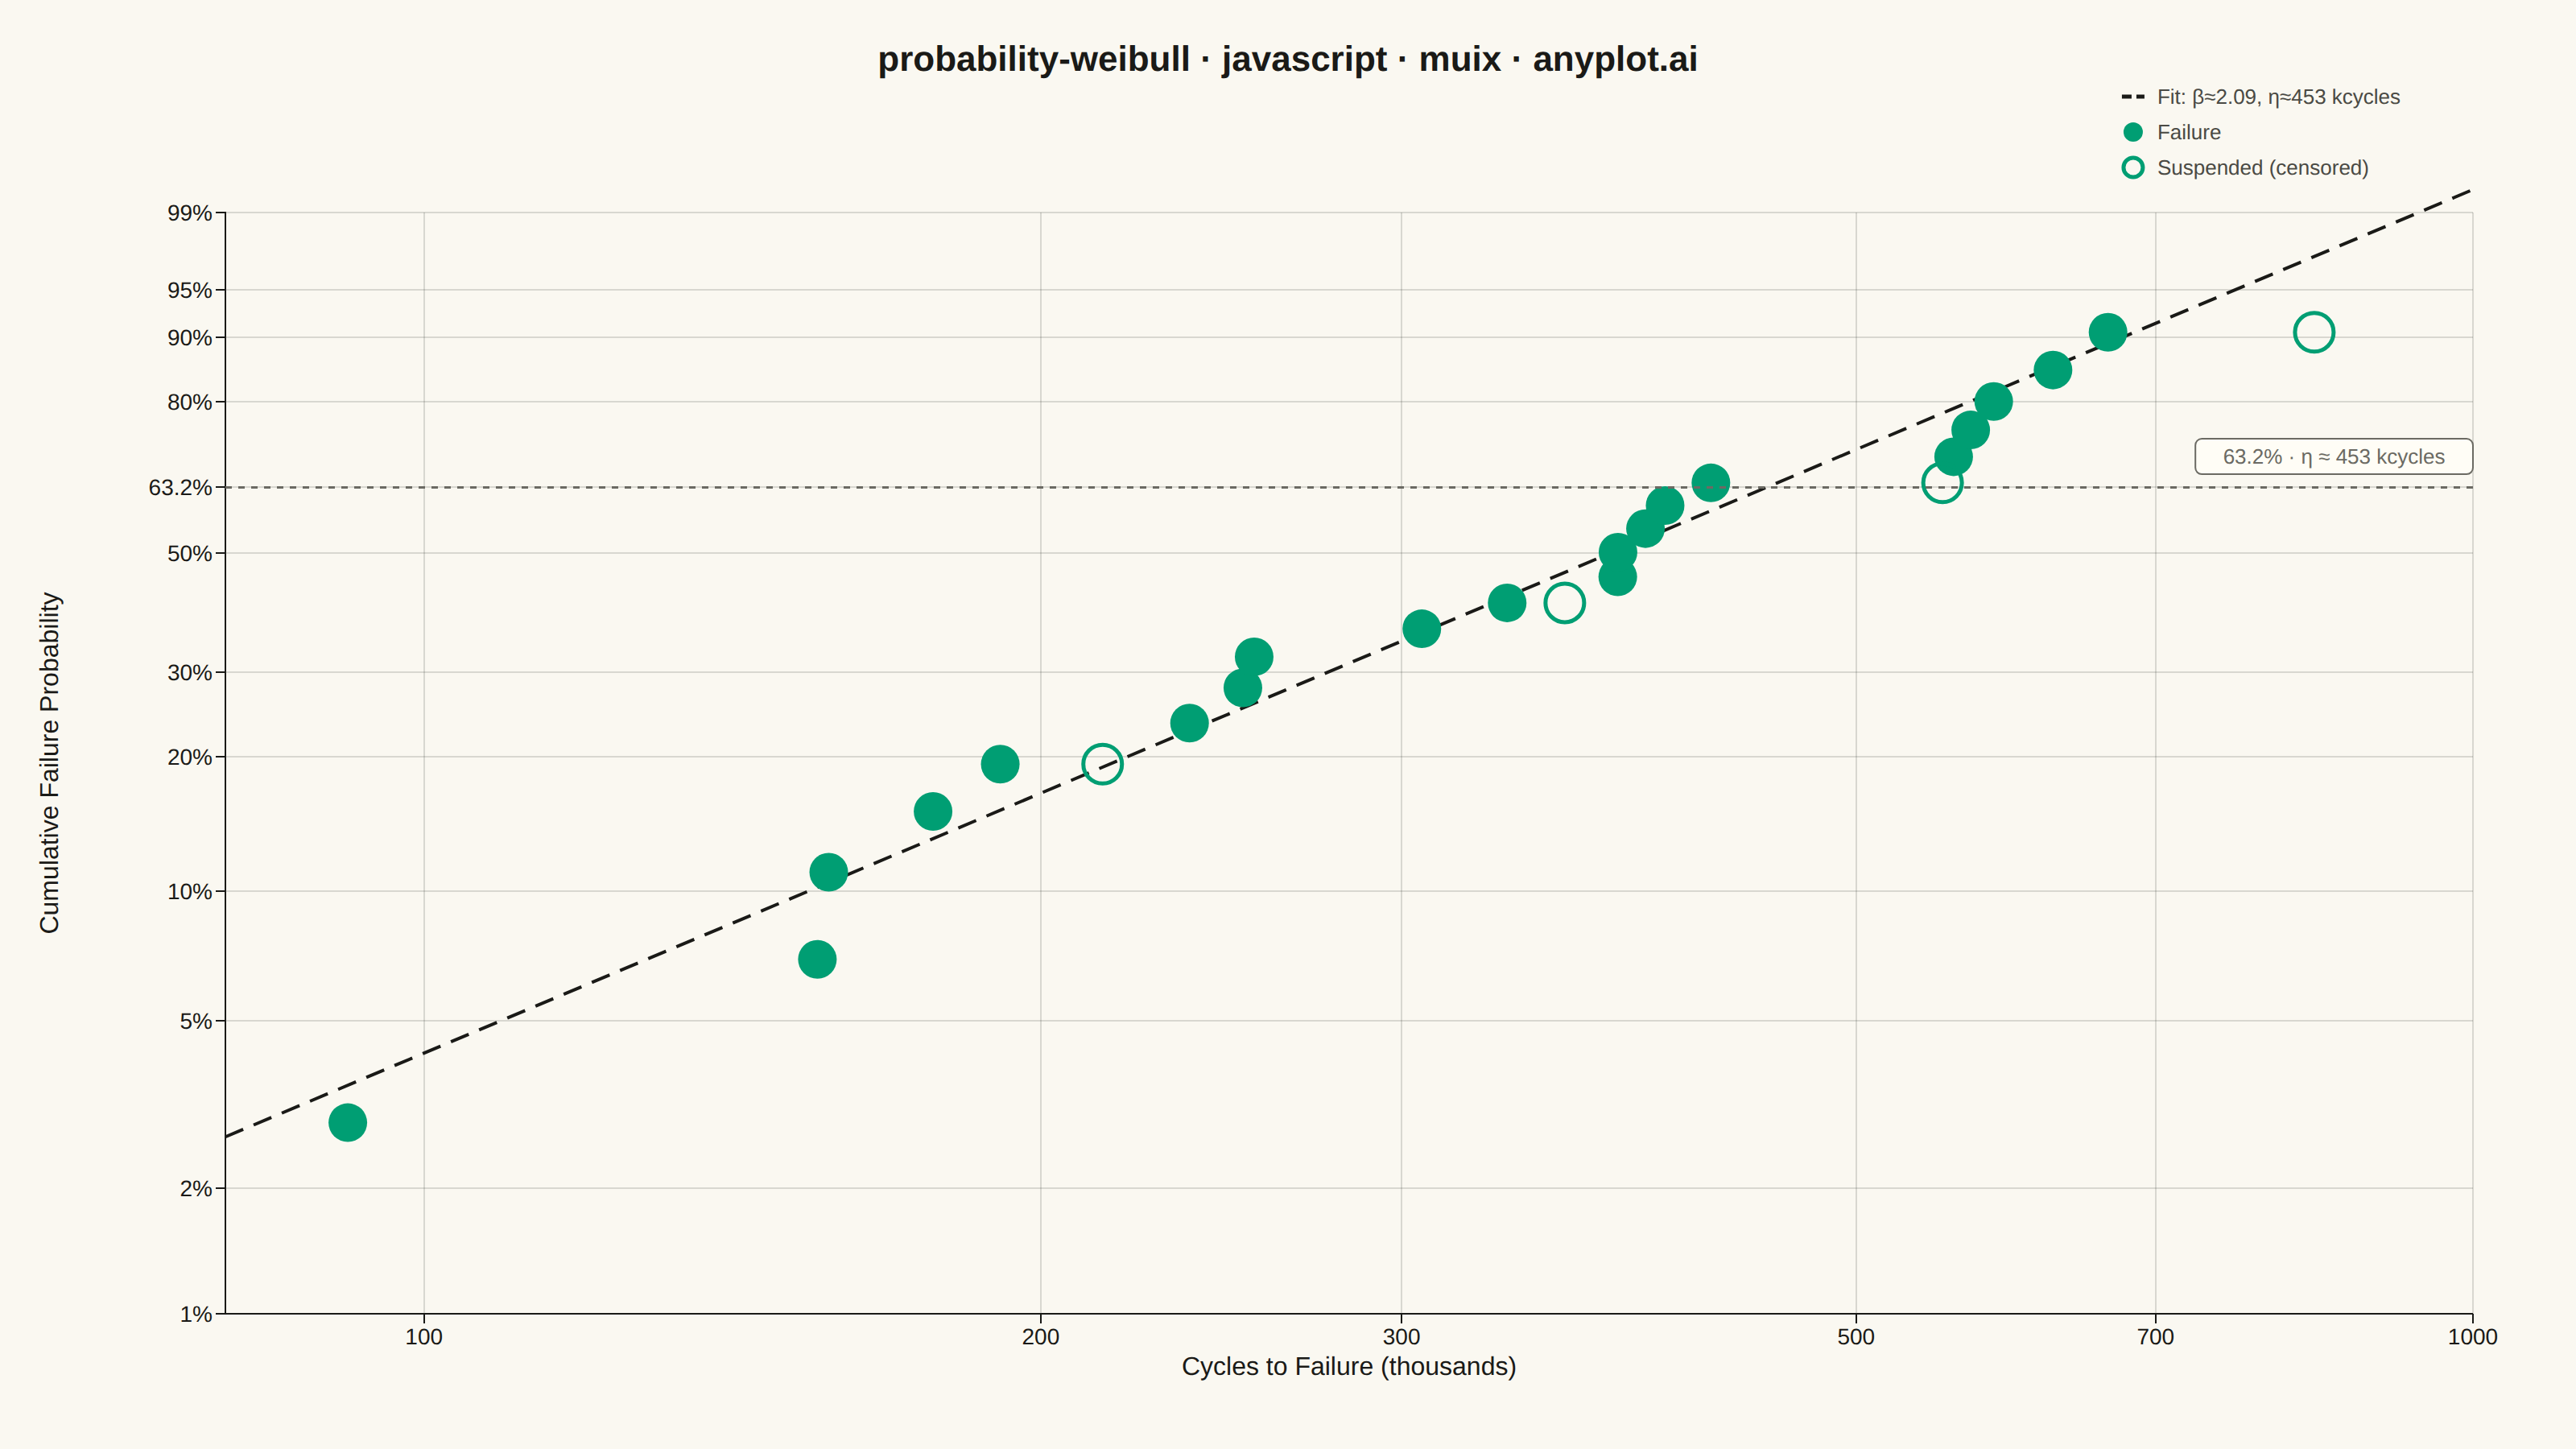
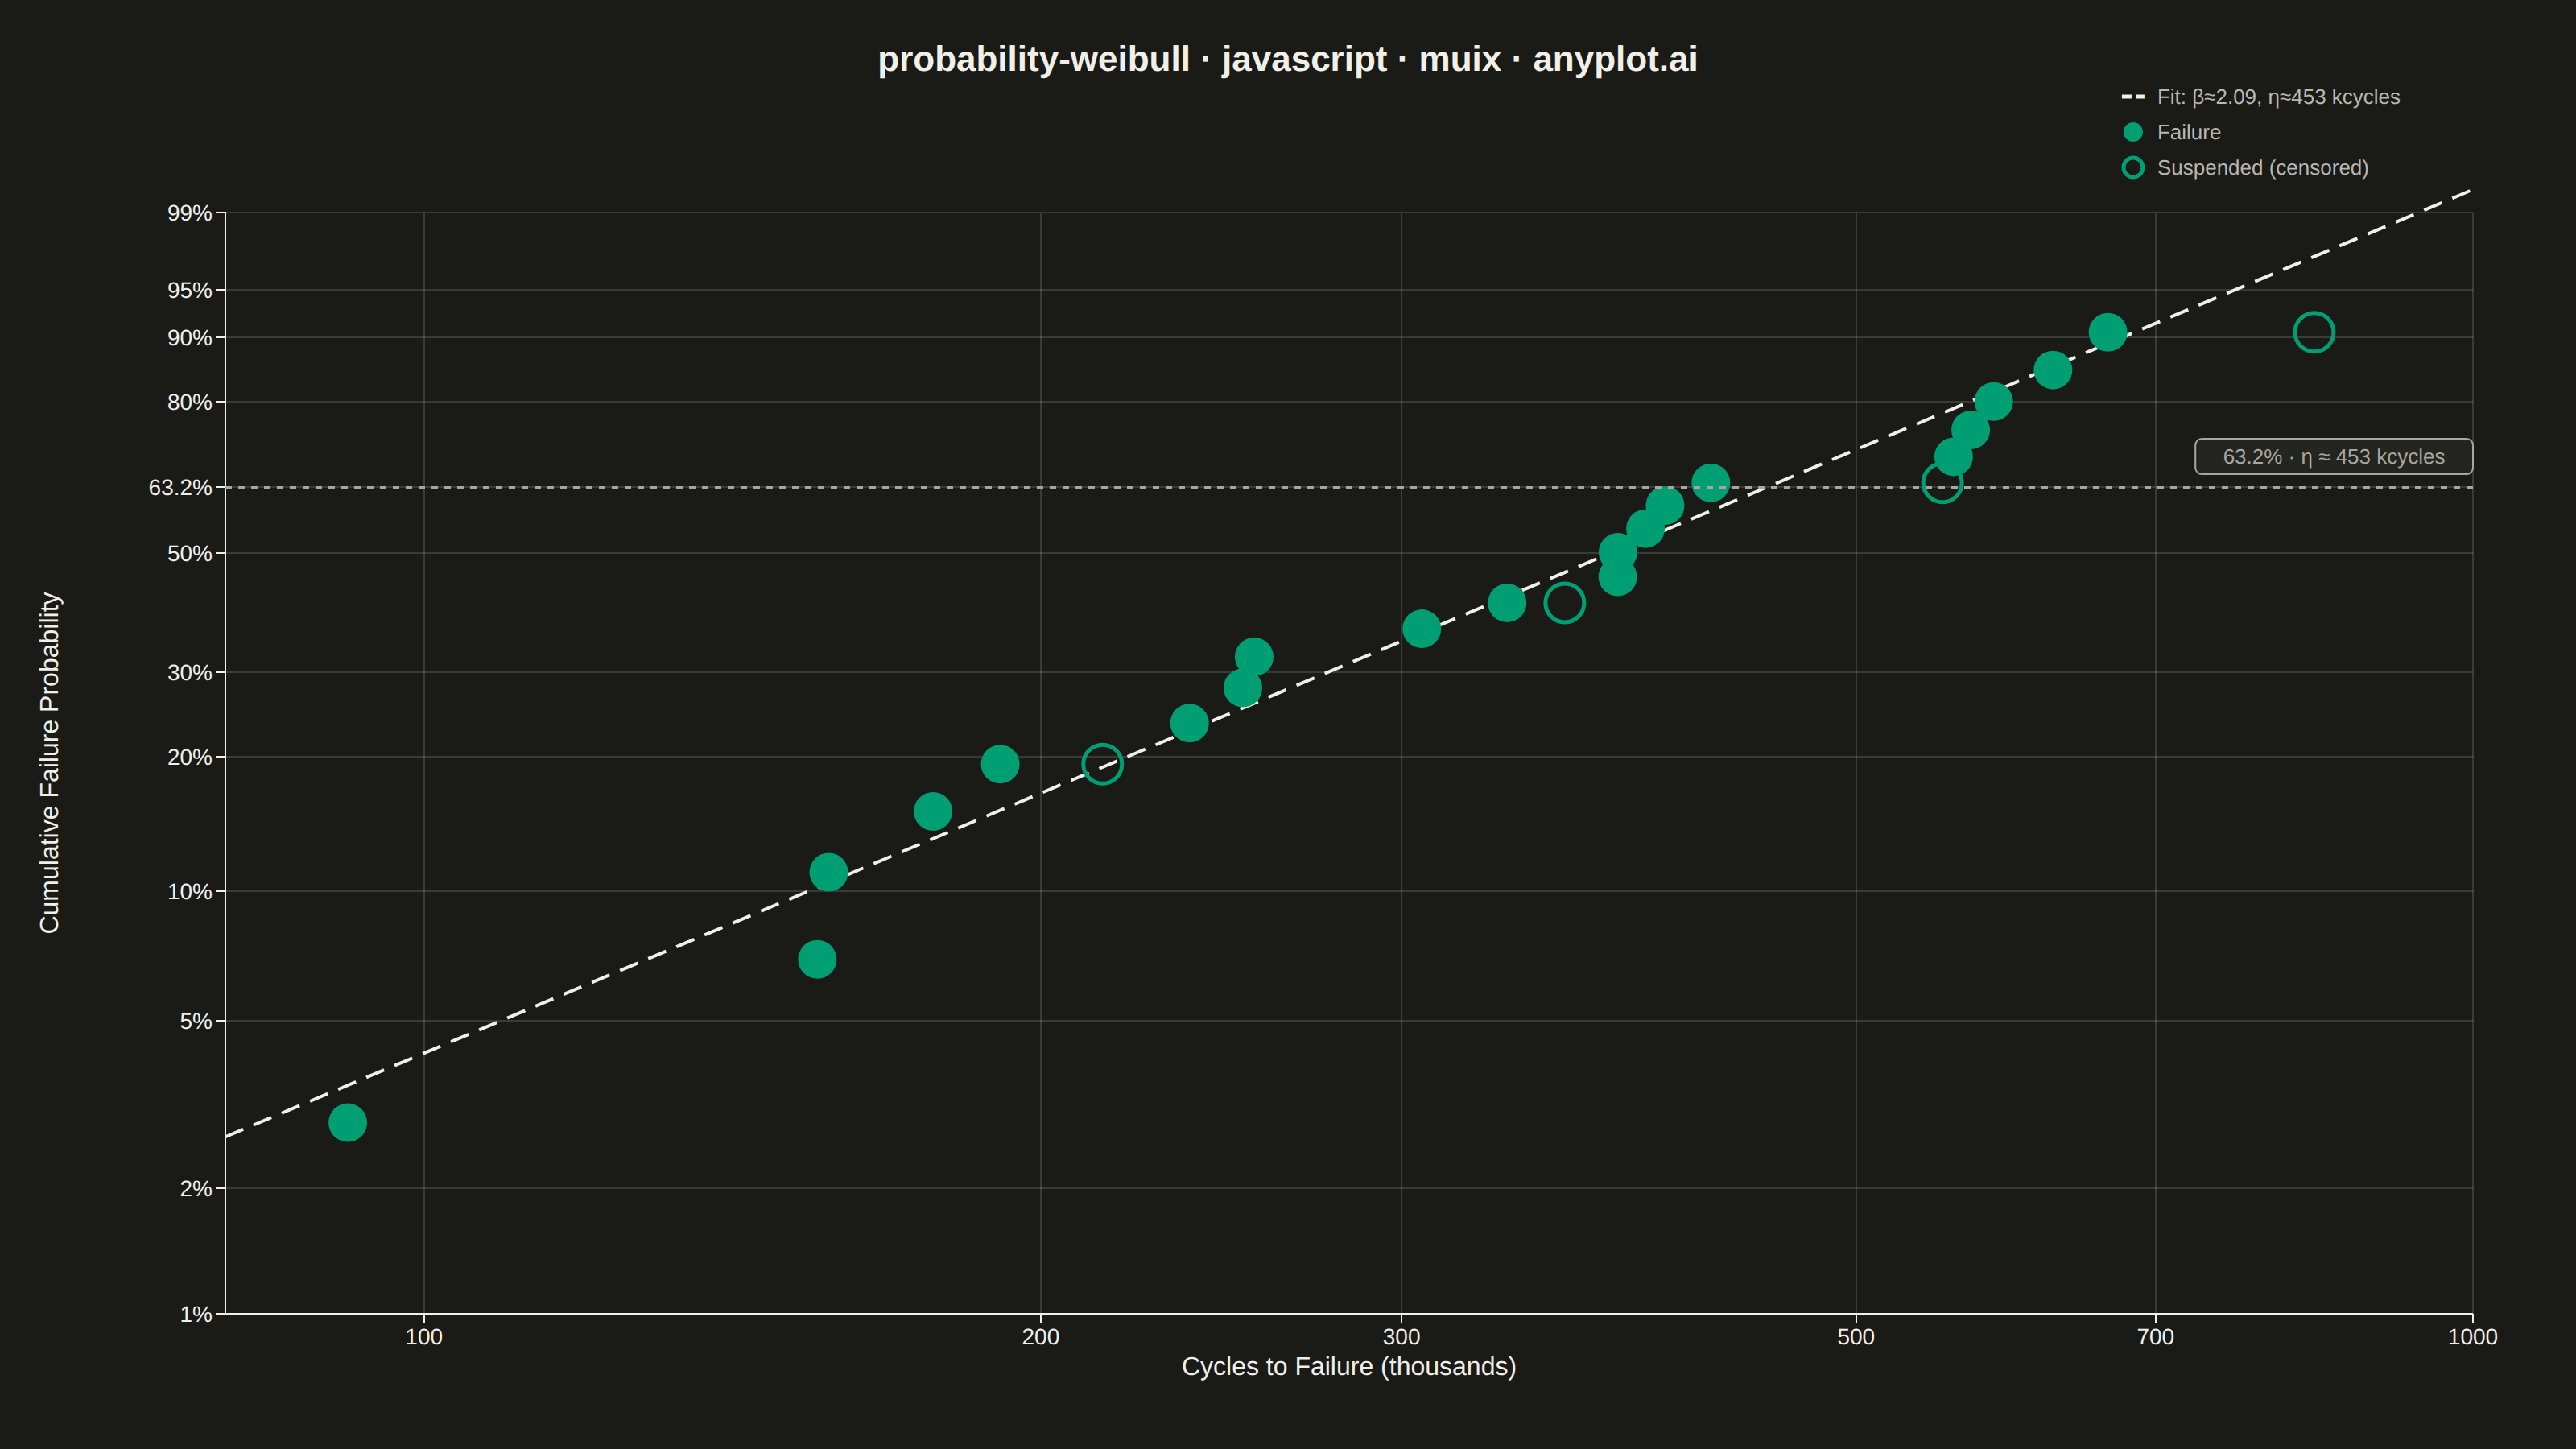
The same plot in 14 other libraries — JavaScript: Chart.js, D3.js, Apache ECharts, Highcharts; Python: Altair, Bokeh, lets-plot, Matplotlib, Plotly, plotnine, Pygal, Seaborn; R: ggplot2; Julia: Makie.jl. Compare all 15 side by side: Weibull Probability Plot for Reliability Analysis in Python, R, Julia and JavaScript.
A Weibull probability plot displays failure or lifetime data on Weibull probability paper (logarithmic x-axis for time/cycles, linearized Weibull CDF on y-axis) with a fitted straight line. It is the standard tool in reliability engineering for estimating Weibull distribution parameters (shape and scale), assessing whether data follow a Weibull distribution, and extrapolating failure probabilities. The slope of the fitted line gives the shape parameter (beta), while the characteristic life (eta) is read at the 63.2% failure probability crossing.
// anyplot.ai
// probability-weibull: Weibull Probability Plot for Reliability Analysis
// Library: muix 7.29.1 | JavaScript 22.23.2
// Quality: 92/100 | Created: 2026-08-24
import { ChartContainer } from "@mui/x-charts/ChartContainer";
import { ScatterPlot } from "@mui/x-charts/ScatterChart";
import { LinePlot } from "@mui/x-charts/LineChart";
import { ChartsXAxis } from "@mui/x-charts/ChartsXAxis";
import { ChartsYAxis } from "@mui/x-charts/ChartsYAxis";
import { ChartsGrid } from "@mui/x-charts/ChartsGrid";
import { ChartsReferenceLine } from "@mui/x-charts/ChartsReferenceLine";
import { useDrawingArea, useYScale } from "@mui/x-charts/hooks";

const t = window.ANYPLOT_TOKENS;
const THEME = window.ANYPLOT_THEME === "dark" ? "dark" : "light";
// ANYPLOT_TOKENS has no "muted" anchor — derive it from default-style-guide.md
// "Theme-adaptive Chrome" (tertiary text token).
const INK_MUTED = THEME === "dark" ? "#A8A79F" : "#6B6A63";

// --- Data: fixed-seed LCG (the browser has no seeded RNG) -------------------
function makeLcg(seed: number) {
  let state = seed >>> 0;
  return () => {
    state = (state * 1664525 + 1013904223) >>> 0;
    return state / 4294967296;
  };
}
const rand = makeLcg(42);

// Turbine blade fatigue-life test: cycles to failure, in thousands (kcycles).
const BETA_TRUE = 2.4;
const ETA_TRUE = 420;
const N = 24;
const CENSORED_EVERY = 6; // every 6th-ranked blade pulled for inspection, unfailed

const sortedTimes = Array.from({ length: N }, () => {
  const u = rand();
  return (
    Math.round(ETA_TRUE * Math.pow(-Math.log(1 - u), 1 / BETA_TRUE) * 10) / 10
  );
}).sort((a, b) => a - b);

// Never censor the very first (smallest) time — a suspension needs at least
// one preceding failure to inherit a plotting position from.
const observations = sortedTimes.map((time, idx) => ({
  time,
  isCensored: idx > 0 && (idx + 1) % CENSORED_EVERY === 0,
}));

// Median-rank plotting positions via Johnson's rank-adjustment method: each
// failure's adjusted rank absorbs the "credit" left behind by suspensions
// that preceded it, then Benard's approximation turns rank into probability.
let adjustedRank = 0;
let lastProbability = 0;
const n = observations.length;
const points = observations.map((obs, idx) => {
  const reverseRank = n - idx;
  if (!obs.isCensored) {
    adjustedRank += (n + 1 - adjustedRank) / (1 + reverseRank);
    lastProbability = (adjustedRank - 0.3) / (n + 0.4);
  }
  return { ...obs, probability: lastProbability };
});

// y = ln(-ln(1-F)) linearizes the Weibull CDF so Weibull data plots straight.
const weibullY = (p: number) => Math.log(-Math.log(1 - p));

const failurePoints = points.filter((p) => !p.isCensored);
const censoredPoints = points.filter((p) => p.isCensored);

const failureData = failurePoints.map((p, i) => ({
  x: p.time,
  y: weibullY(p.probability),
  id: `failure-${i}`,
}));
const censoredData = censoredPoints.map((p, i) => ({
  x: p.time,
  y: weibullY(p.probability),
  id: `censored-${i}`,
}));

// Least-squares fit of ln(t) vs y over failures only: y = beta*ln(t) + b, so
// slope = shape parameter (beta) and eta = exp(-intercept / beta).
const xs = failurePoints.map((p) => Math.log(p.time));
const ys = failureData.map((d) => d.y);
const nF = xs.length;
const meanX = xs.reduce((a, b) => a + b, 0) / nF;
const meanY = ys.reduce((a, b) => a + b, 0) / nF;
let sxy = 0;
let sxx = 0;
for (let i = 0; i < nF; i += 1) {
  sxy += (xs[i] - meanX) * (ys[i] - meanY);
  sxx += (xs[i] - meanX) ** 2;
}
const beta = sxy / sxx;
const intercept = meanY - beta * meanX;
const eta = Math.exp(-intercept / beta);

const X_MIN = 80;
const X_MAX = 1000;
const fitLineX = [X_MIN, X_MAX];
const fitLineY = fitLineX.map((x) => beta * Math.log(x) + intercept);

const yAt632 = weibullY(0.632);

// Probability-paper y-axis: fixed percentage gridlines, deliberately NOT
// evenly spaced in y — that nonlinearity is the whole point of the transform.
const PROB_TICKS = [1, 2, 5, 10, 20, 30, 50, 63.2, 80, 90, 95, 99];
const yTickValues = PROB_TICKS.map((p) => weibullY(p / 100));
const yTickLabels = new Map(
  PROB_TICKS.map((p, i) => [yTickValues[i], `${p}%`]),
);
const Y_MIN = weibullY(0.01);
const Y_MAX = weibullY(0.99);

// Custom scatter marker: filled circle for observed failures, hollow ring for
// right-censored (suspended) units — same hue, status told by fill alone.
function StatusMarker({ series, xScale, yScale, color, markerSize }: any) {
  const isCensored = series.id === "censored";
  return (
    <g>
      {series.data.map((point: any) => (
        <circle
          key={point.id}
          cx={xScale(point.x)}
          cy={yScale(point.y)}
          r={markerSize}
          fill={isCensored ? "none" : color}
          stroke={color}
          strokeWidth={isCensored ? 2.5 : 0}
        />
      ))}
    </g>
  );
}

const TITLE = "probability-weibull · javascript · muix · anyplot.ai";
const TITLE_FONT_SIZE =
  TITLE.length > 67 ? Math.max(15, Math.round((22 * 67) / TITLE.length)) : 22;

// Chart margins — the y-axis label below is a hand-placed <text>, not the
// built-in `label` prop, because ChartsYAxis offsets it by a fixed
// `tickFontSize + tickSize + 10` regardless of the actual (custom-formatted)
// tick label width, which collided with "63.2%"-style ticks.
// `top` is tall enough for the hand-rolled 3-row legend below the title.
const MARGIN = { top: 132, right: 64, bottom: 84, left: 140 };

// Hand-rolled legend: the built-in ChartsLegend only draws solid-color square
// swatches, which can't reflect the filled-vs-hollow marker encoding used on
// the chart. Swatches here mirror the on-chart marks exactly (dash for the
// fit line, filled circle for failures, hollow ring for suspensions).
const LEGEND_FONT_SIZE = 13;
const LEGEND_ROW_HEIGHT = 22;
const LEGEND_TOP = 60;

function Legend({ right }: { right: number }) {
  const legendItems = [
    {
      kind: "dash" as const,
      label: `Fit: β≈${beta.toFixed(2)}, η≈${Math.round(eta)} kcycles`,
      swatchColor: t.ink,
    },
    { kind: "filled" as const, label: "Failure", swatchColor: t.palette[0] },
    {
      kind: "hollow" as const,
      label: "Suspended (censored)",
      swatchColor: t.palette[0],
    },
  ];
  const legendWidth = Math.max(
    ...legendItems.map(
      (item) => 22 + item.label.length * LEGEND_FONT_SIZE * 0.58,
    ),
  );
  const left = right - legendWidth;
  return (
    <g>
      {legendItems.map((item, i) => {
        const y = LEGEND_TOP + i * LEGEND_ROW_HEIGHT;
        return (
          <g key={item.kind}>
            {item.kind === "dash" && (
              <line
                x1={left}
                x2={left + 14}
                y1={y}
                y2={y}
                stroke={item.swatchColor}
                strokeWidth={2.5}
                strokeDasharray="6 3"
              />
            )}
            {item.kind === "filled" && (
              <circle cx={left + 7} cy={y} r={6} fill={item.swatchColor} />
            )}
            {item.kind === "hollow" && (
              <circle
                cx={left + 7}
                cy={y}
                r={6}
                fill="none"
                stroke={item.swatchColor}
                strokeWidth={2.5}
              />
            )}
            <text
              x={left + 22}
              y={y}
              dominantBaseline="central"
              fontSize={LEGEND_FONT_SIZE}
              fill={t.inkSoft}
            >
              {item.label}
            </text>
          </g>
        );
      })}
    </g>
  );
}

// Small elevated callout for the eta/63.2% crossing — a filled rounded box
// behind the label sharpens the focal point beyond a thin dashed line + text.
function ReferenceCallout({ y, label }: { y: number; label: string }) {
  const { left, width: drawWidth } = useDrawingArea();
  const yScale = useYScale();
  const yPixel = yScale(y);
  const paddingX = 8;
  const boxWidth = label.length * 6.8 + paddingX * 2;
  const boxHeight = 22;
  const boxX = left + drawWidth - boxWidth;
  const boxY = yPixel - boxHeight - 8;
  return (
    <g>
      <rect
        x={boxX}
        y={boxY}
        width={boxWidth}
        height={boxHeight}
        rx={4}
        fill={t.elevatedBg}
        stroke={INK_MUTED}
        strokeWidth={1}
      />
      <text
        x={boxX + boxWidth / 2}
        y={boxY + boxHeight / 2}
        textAnchor="middle"
        dominantBaseline="central"
        fontSize={LEGEND_FONT_SIZE}
        fill={INK_MUTED}
      >
        {label}
      </text>
    </g>
  );
}

// --- Chart (default-exported component — the harness mounts it) -----------
export default function Chart() {
  const { width, height } = window.ANYPLOT_SIZE;
  const plotMidY = MARGIN.top + (height - MARGIN.top - MARGIN.bottom) / 2;

  return (
    <ChartContainer
      width={width}
      height={height}
      margin={MARGIN}
      series={[
        {
          type: "line",
          id: "fit",
          data: fitLineY,
          curve: "linear",
          color: t.ink,
          showMark: false,
          disableHighlight: true,
        },
        {
          type: "scatter",
          id: "failure",
          data: failureData,
          markerSize: 12,
          color: t.palette[0],
        },
        {
          type: "scatter",
          id: "censored",
          data: censoredData,
          markerSize: 12,
          color: t.palette[0],
        },
      ]}
      xAxis={[
        {
          data: fitLineX,
          scaleType: "log",
          min: X_MIN,
          max: X_MAX,
          tickInterval: [100, 200, 300, 500, 700, 1000],
          valueFormatter: (v: number) => `${v}`,
          label: "Cycles to Failure (thousands)",
          tickLabelStyle: { fontSize: 14 },
          labelStyle: { fontSize: 16 },
        },
      ]}
      yAxis={[
        {
          scaleType: "linear",
          min: Y_MIN,
          max: Y_MAX,
          tickInterval: yTickValues,
          valueFormatter: (v: number) => yTickLabels.get(v) ?? "",
          tickLabelStyle: { fontSize: 14 },
        },
      ]}
      skipAnimation
    >
      <ChartsGrid horizontal vertical />
      <LinePlot
        skipAnimation
        slotProps={{ line: { strokeDasharray: "12 7", strokeWidth: 2.5 } }}
      />
      <ScatterPlot slots={{ scatter: StatusMarker }} />
      <ChartsXAxis />
      <ChartsYAxis />
      <ChartsReferenceLine
        y={yAt632}
        lineStyle={{
          stroke: INK_MUTED,
          strokeDasharray: "4 4",
          strokeWidth: 1.5,
        }}
      />
      <ReferenceCallout
        y={yAt632}
        label={`63.2% · η ≈ ${Math.round(eta)} kcycles`}
      />
      <Legend right={width - MARGIN.right} />
      <text
        x={width / 2}
        y={44}
        textAnchor="middle"
        fontSize={TITLE_FONT_SIZE}
        fontWeight={600}
        fill={t.ink}
      >
        {TITLE}
      </text>
      <text
        x={0}
        y={0}
        textAnchor="middle"
        fontSize={16}
        fill={t.ink}
        transform={`translate(36, ${plotMidY}) rotate(-90)`}
      >
        Cumulative Failure Probability
      </text>
    </ChartContainer>
  );
}
Runnable source as JSON, for any HTTP client: https://api.anyplot.ai/specs/probability-weibull/muix/code. Any spec id and library id listed in llms-full.txt fit the same URL shape; every URL below is complete and callable.
{
  "spec_id": "probability-weibull",
  "language": "javascript",
  "library": "muix",
  "page": "https://anyplot.ai/probability-weibull/javascript/muix",
  "hub": "https://anyplot.ai/probability-weibull",
  "code_json": "https://api.anyplot.ai/specs/probability-weibull/muix/code",
  "spec_json": "https://api.anyplot.ai/specs/probability-weibull",
  "render_light_png": "https://storage.googleapis.com/anyplot-images/plots/probability-weibull/javascript/muix/plot-light.png",
  "render_dark_png": "https://storage.googleapis.com/anyplot-images/plots/probability-weibull/javascript/muix/plot-dark.png",
  "interactive_light_html": "https://storage.googleapis.com/anyplot-images/plots/probability-weibull/javascript/muix/plot-light.html",
  "interactive_dark_html": "https://storage.googleapis.com/anyplot-images/plots/probability-weibull/javascript/muix/plot-dark.html",
  "quality_score": 92.0,
  "license": "MIT",
  "guide": "https://anyplot.ai/llms.txt"
}
Part of Weibull Probability Plot for Reliability Analysis on anyplot.ai.