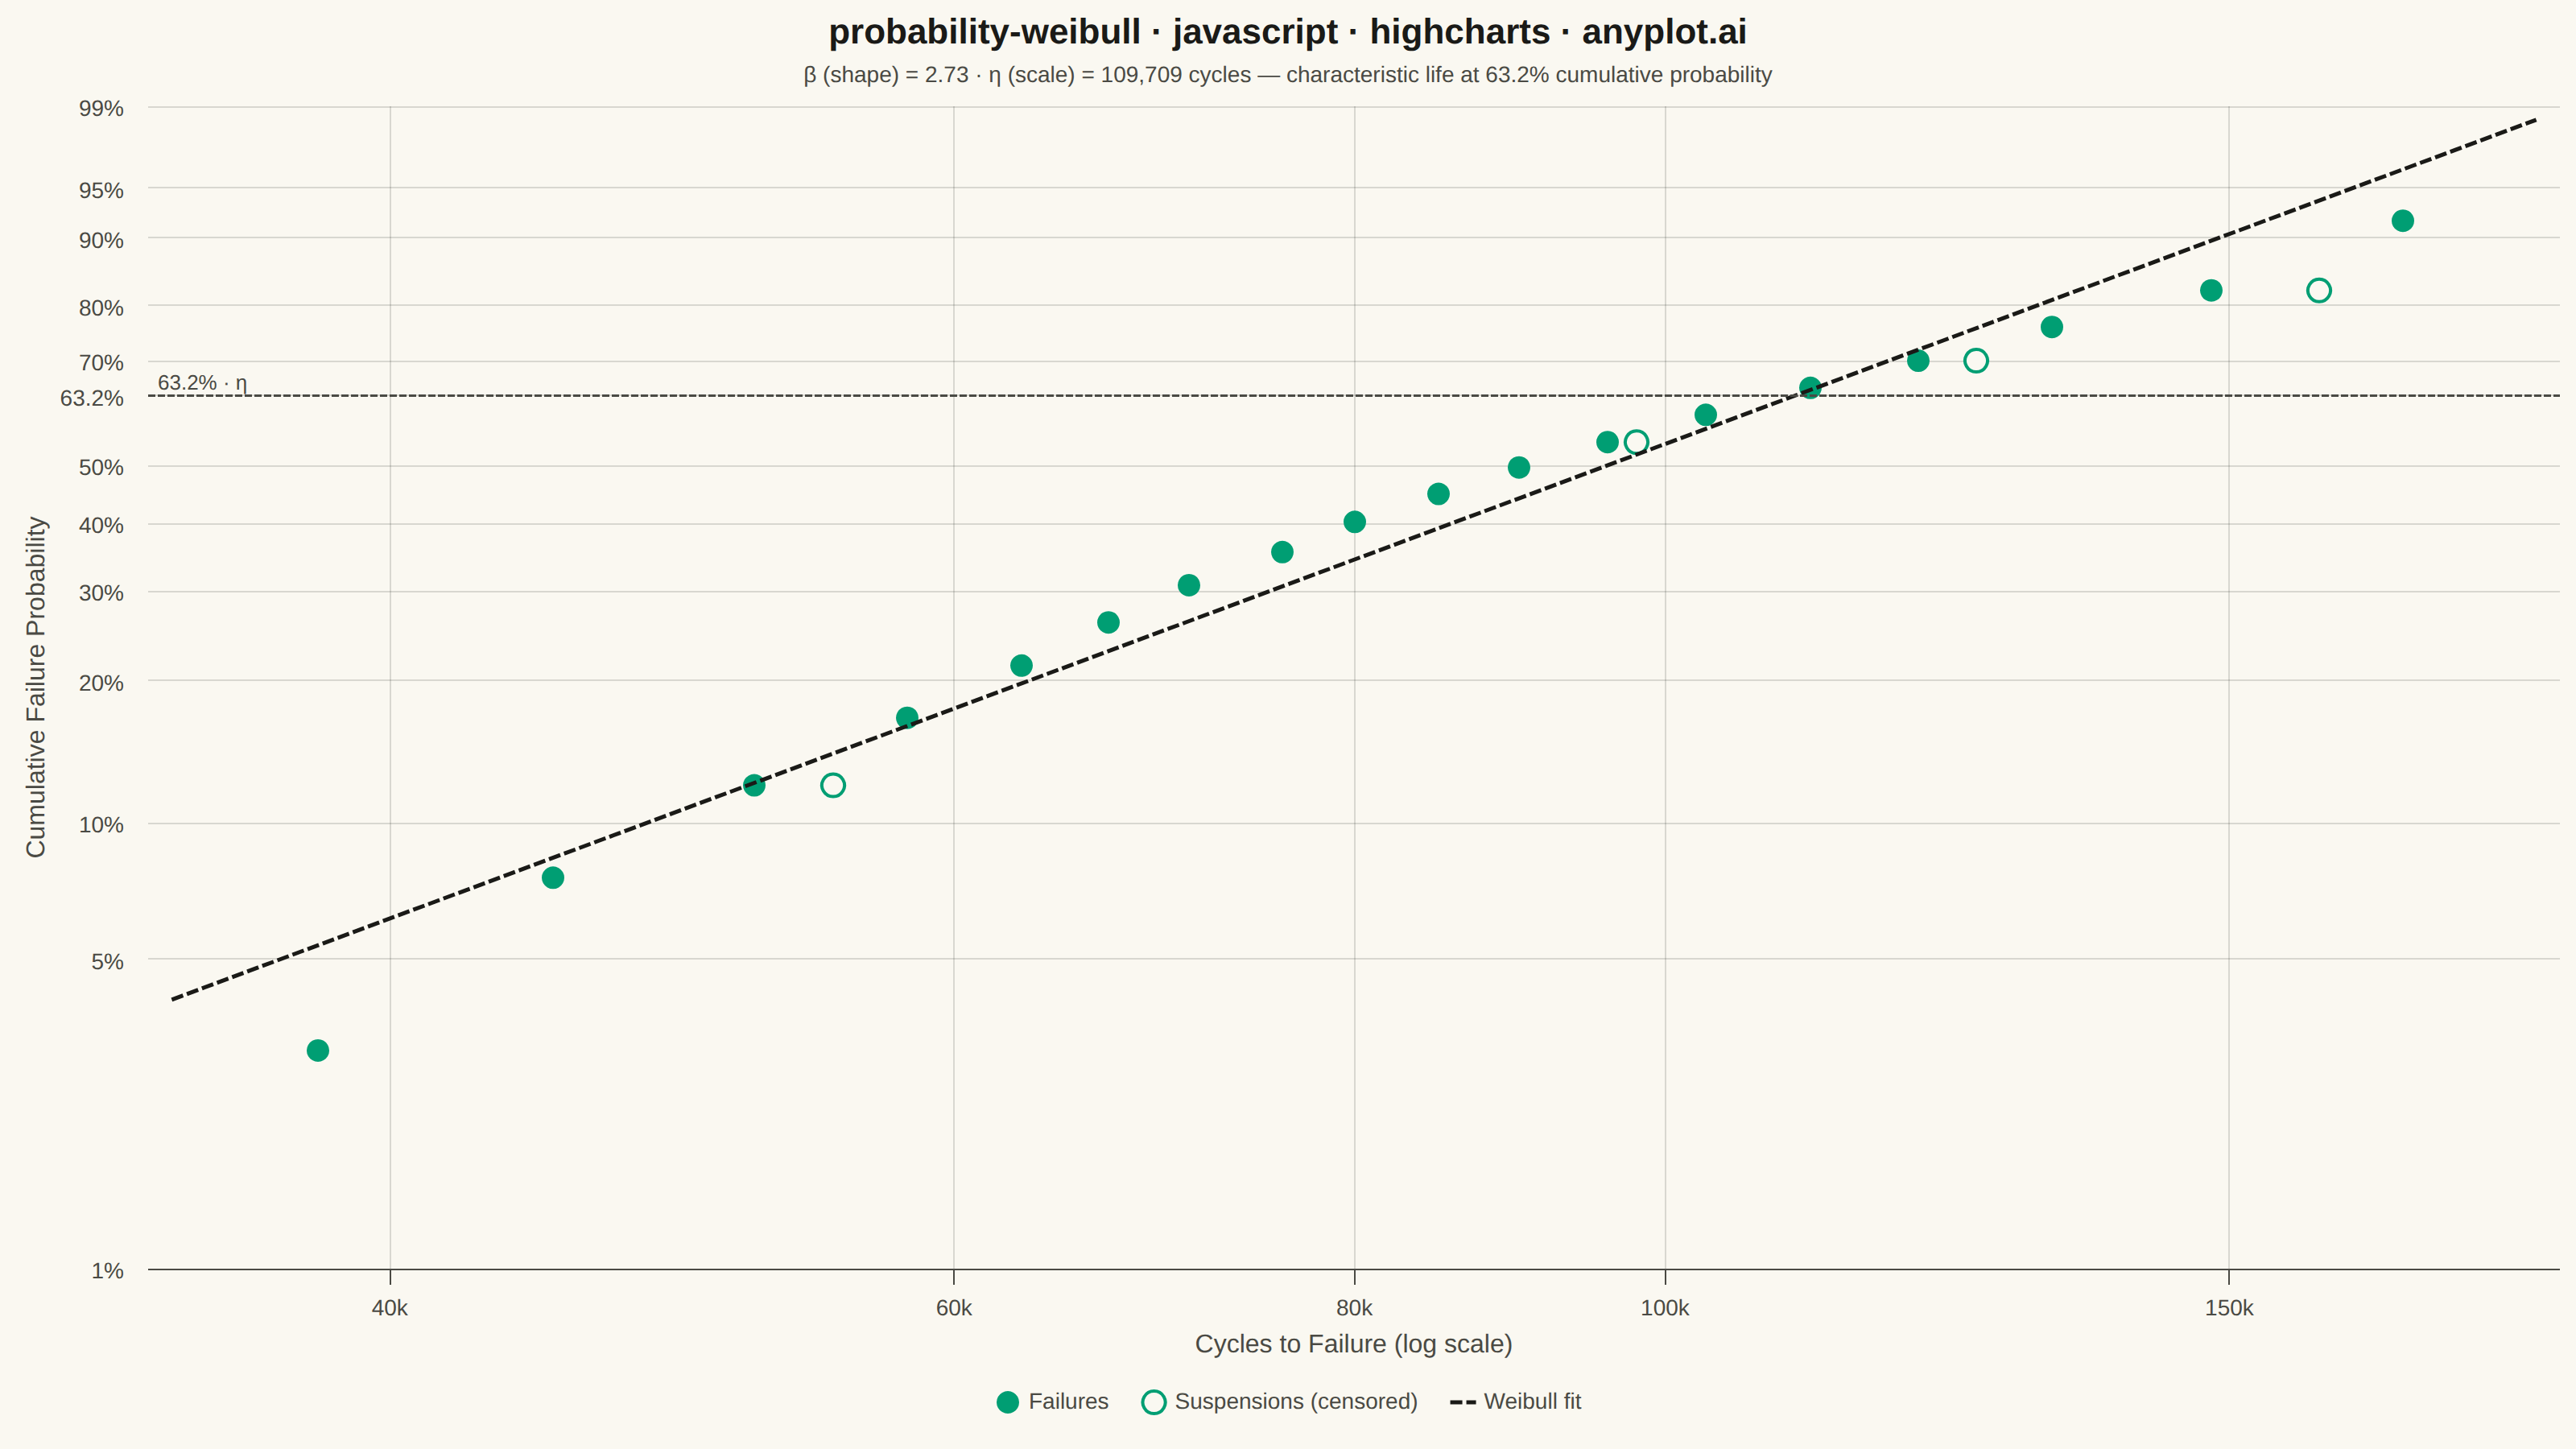
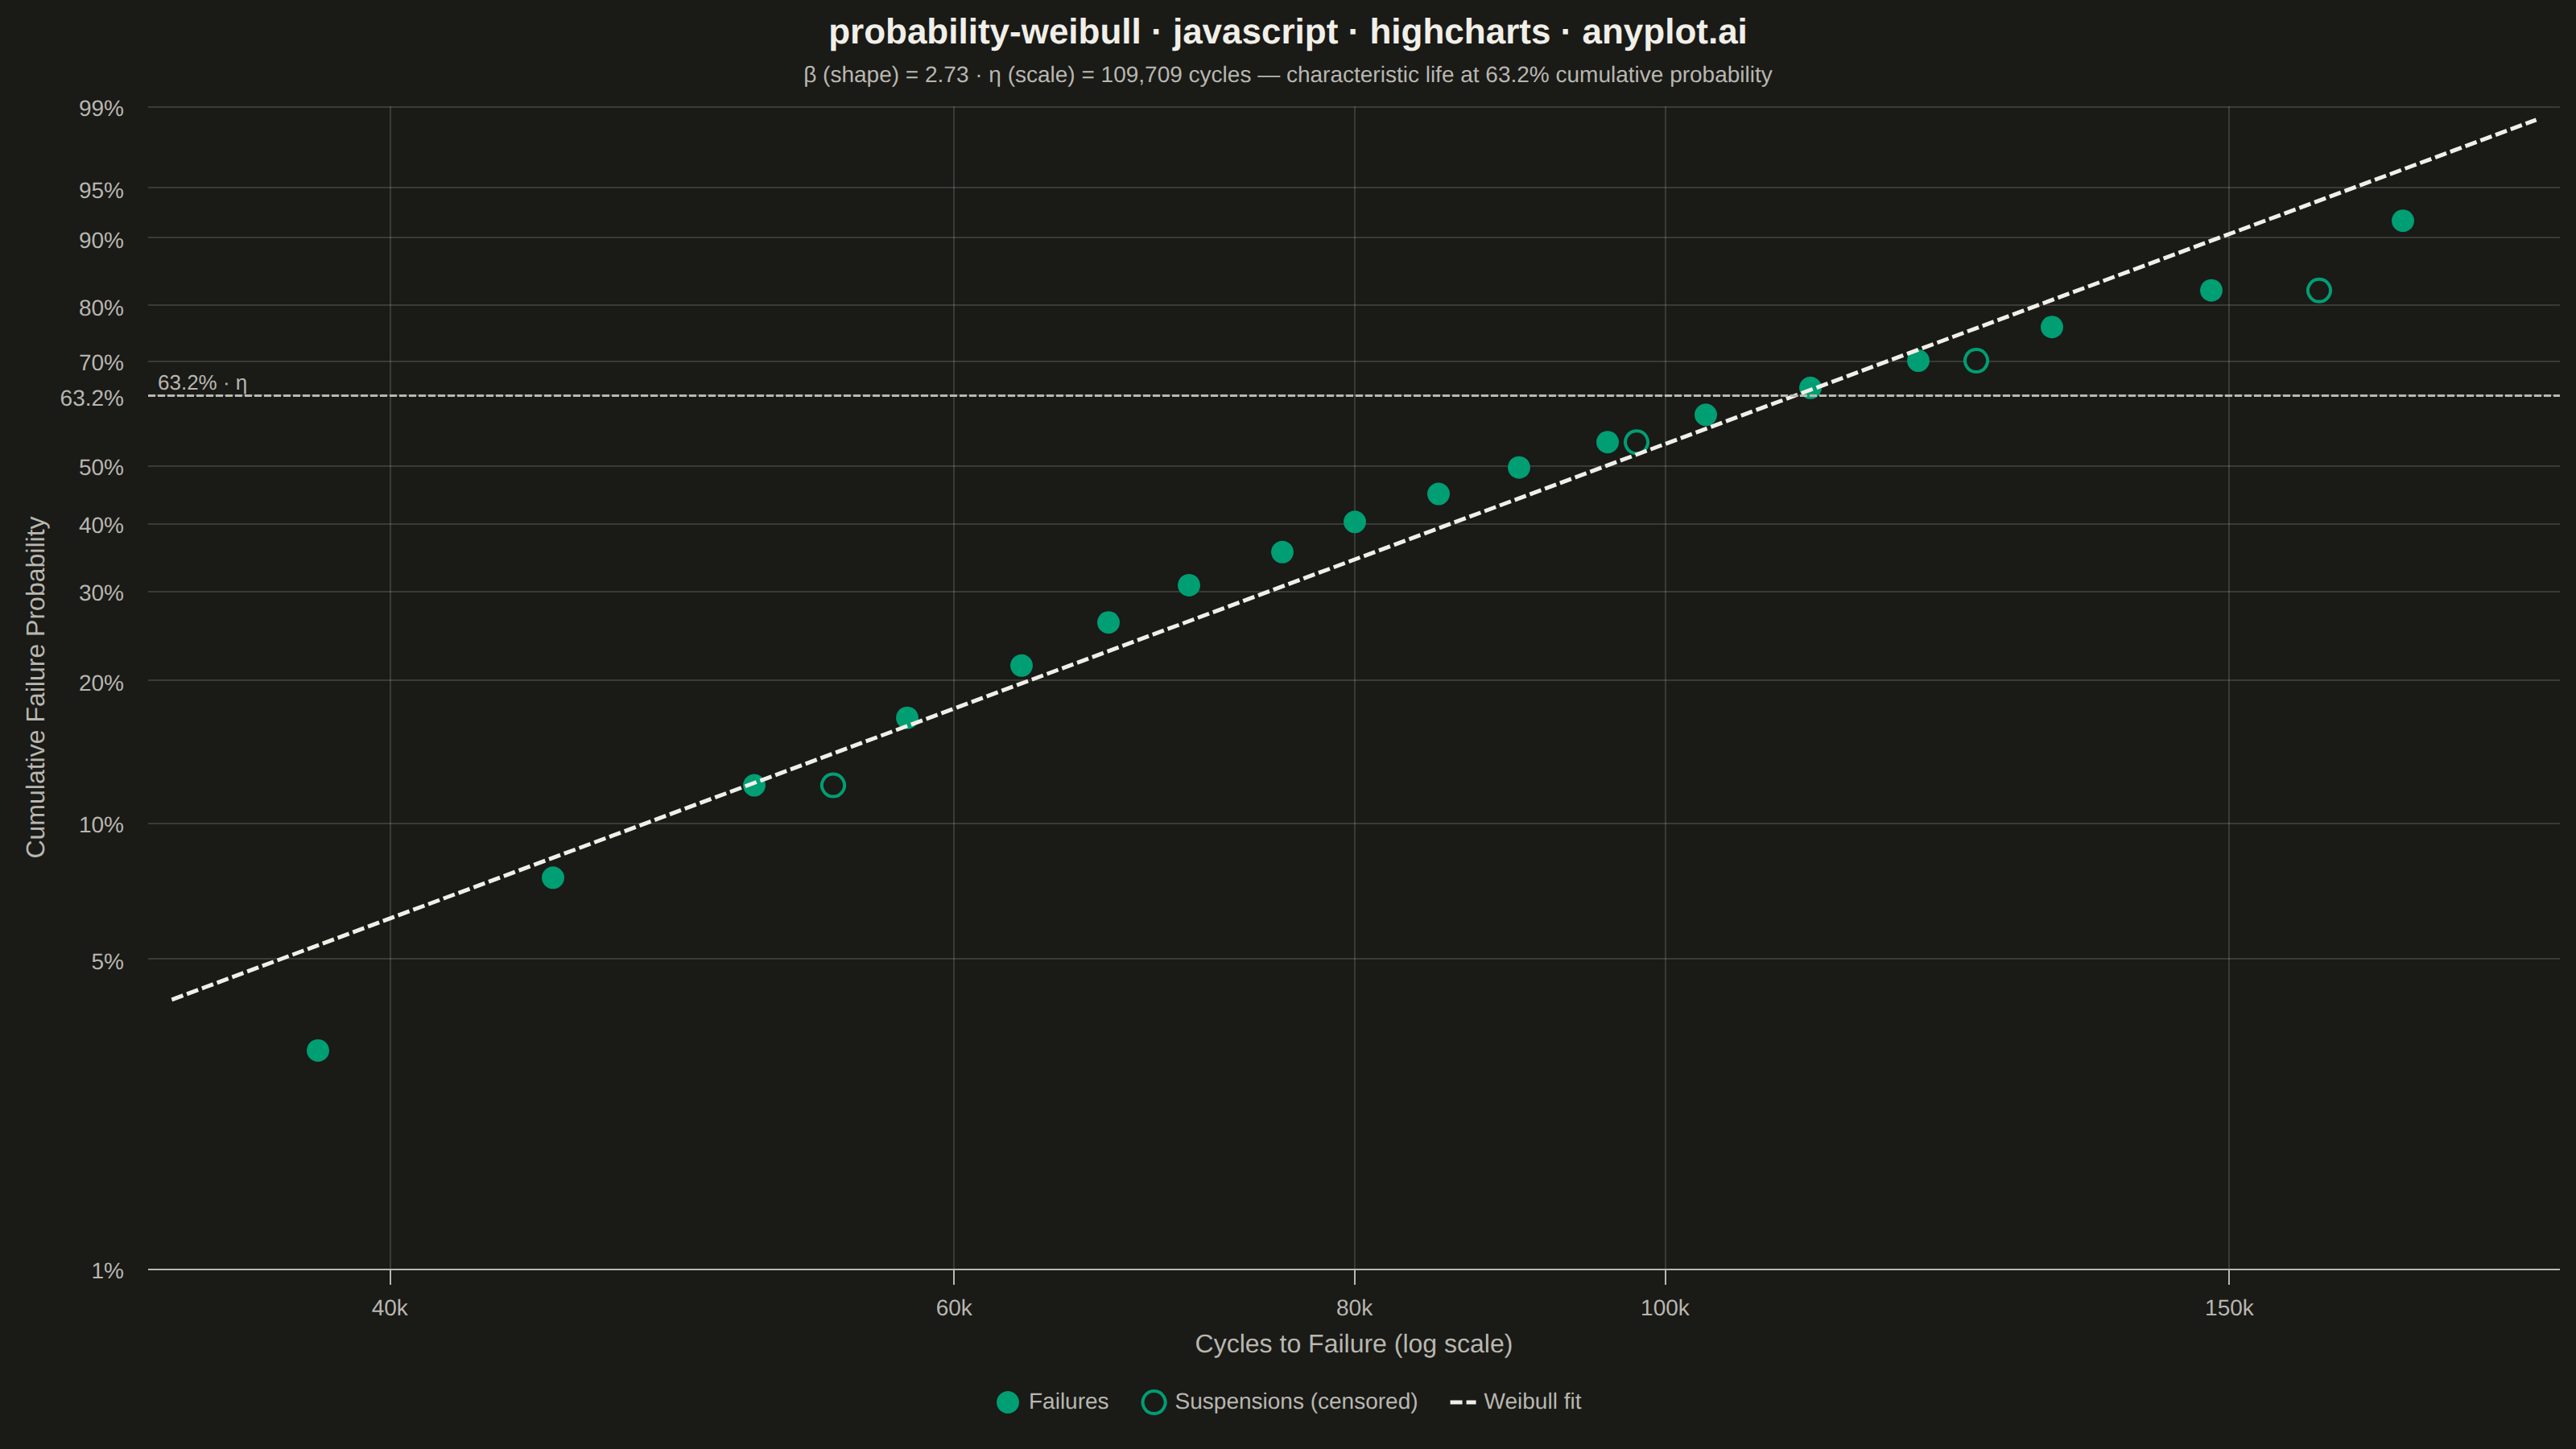
The same plot in 14 other libraries — JavaScript: Chart.js, D3.js, Apache ECharts, MUI X Charts; Python: Altair, Bokeh, lets-plot, Matplotlib, Plotly, plotnine, Pygal, Seaborn; R: ggplot2; Julia: Makie.jl. Compare all 15 side by side: Weibull Probability Plot for Reliability Analysis in Python, R, Julia and JavaScript.
A Weibull probability plot displays failure or lifetime data on Weibull probability paper (logarithmic x-axis for time/cycles, linearized Weibull CDF on y-axis) with a fitted straight line. It is the standard tool in reliability engineering for estimating Weibull distribution parameters (shape and scale), assessing whether data follow a Weibull distribution, and extrapolating failure probabilities. The slope of the fitted line gives the shape parameter (beta), while the characteristic life (eta) is read at the 63.2% failure probability crossing.
// anyplot.ai
// probability-weibull: Weibull Probability Plot for Reliability Analysis
// Library: highcharts 12.6.0 | JavaScript 22.23.2
// Quality: 90/100 | Created: 2026-08-24

const t = window.ANYPLOT_TOKENS;

// --- Data: turbine blade fatigue-life test, cycles to failure (or suspension) --
// Sorted ascending; a handful of units were pulled from test before failing
// (right-censored / "suspended"), which is common in reliability testing.
const observations = [
  { cycles: 38000, censored: false },
  { cycles: 45000, censored: false },
  { cycles: 52000, censored: false },
  { cycles: 55000, censored: true },
  { cycles: 58000, censored: false },
  { cycles: 63000, censored: false },
  { cycles: 67000, censored: false },
  { cycles: 71000, censored: false },
  { cycles: 76000, censored: false },
  { cycles: 80000, censored: false },
  { cycles: 85000, censored: false },
  { cycles: 90000, censored: false },
  { cycles: 96000, censored: false },
  { cycles: 98000, censored: true },
  { cycles: 103000, censored: false },
  { cycles: 111000, censored: false },
  { cycles: 120000, censored: false },
  { cycles: 125000, censored: true },
  { cycles: 132000, censored: false },
  { cycles: 148000, censored: false },
  { cycles: 160000, censored: true },
  { cycles: 170000, censored: false },
];
const n = observations.length;

// --- Median-rank regression with rank adjustment for suspensions -----------
// Johnson's rank-increment method: each suspension leaves the pool of
// "at-risk" units without resolving a rank, so later failures inherit a
// larger increment. Suspended units are drawn at the prevailing rank so the
// censoring pattern is visible, but only failures feed the line fit.
let previousAdjustedRank = 0;
const points = observations.map((obs, i) => {
  const reverseRank = n - i; // remaining items at/after this position
  if (obs.censored) {
    const cumulativeProbability = (previousAdjustedRank - 0.3) / (n + 0.4);
    return { ...obs, cumulativeProbability };
  }
  const increment = (n + 1 - previousAdjustedRank) / (1 + reverseRank);
  previousAdjustedRank += increment;
  const cumulativeProbability = (previousAdjustedRank - 0.3) / (n + 0.4);
  return { ...obs, cumulativeProbability };
});

// Weibull linearization: y = ln(-ln(1 - F)), plotted against ln(time).
const weibullY = (f) => Math.log(-Math.log(1 - f));

const failurePoints = points
  .filter((p) => !p.censored)
  .map((p) => [p.cycles, weibullY(p.cumulativeProbability)]);
const suspensionPoints = points
  .filter((p) => p.censored)
  .map((p) => [p.cycles, weibullY(p.cumulativeProbability)]);

// --- Least-squares fit on failures only: y = beta * ln(t) + intercept ------
const logT = failurePoints.map((p) => Math.log(p[0]));
const yVals = failurePoints.map((p) => p[1]);
const meanLogT = logT.reduce((a, b) => a + b, 0) / logT.length;
const meanY = yVals.reduce((a, b) => a + b, 0) / yVals.length;
let covariance = 0;
let variance = 0;
for (let i = 0; i < logT.length; i++) {
  covariance += (logT[i] - meanLogT) * (yVals[i] - meanY);
  variance += (logT[i] - meanLogT) ** 2;
}
const beta = covariance / variance; // shape parameter
const intercept = meanY - beta * meanLogT;
const eta = Math.exp(-intercept / beta); // scale parameter (characteristic life)

const allCycles = observations.map((o) => o.cycles);
const tMin = Math.min(...allCycles) * 0.9;
const tMax = Math.max(...allCycles) * 1.1;
const fitLine = [
  [tMin, beta * Math.log(tMin) + intercept],
  [tMax, beta * Math.log(tMax) + intercept],
];

// --- Y-axis: linear space in the linearized value, labeled as probability --
const probabilityTicks = [1, 5, 10, 20, 30, 40, 50, 63.2, 70, 80, 90, 95, 99];
const weibullTicks = probabilityTicks.map((p) => ({
  p,
  y: weibullY(p / 100),
}));

// --- X-axis: explicit, well-spaced tick positions (log10 of the cycle count,
// since Highcharts' logarithmic axis expects tickPositions in its internal
// linear/log space). The default tick algorithm packs a label every 10k in
// the 100k-200k decade, crowding "180k"/"190k" together at the right edge;
// thinning out above 100k keeps every label legibly separated.
const xAxisCycleTicks = [40000, 60000, 80000, 100000, 150000, 200000];
const xAxisTickPositions = xAxisCycleTicks.map((v) => Math.log10(v));

// --- Chart -------------------------------------------------------------------
Highcharts.chart("container", {
  chart: {
    backgroundColor: "transparent",
    animation: false,
    style: { fontFamily: "inherit" },
  },
  credits: { enabled: false },
  colors: t.palette,
  title: {
    text: "probability-weibull · javascript · highcharts · anyplot.ai",
    style: { color: t.ink, fontSize: "22px", fontWeight: "600" },
  },
  subtitle: {
    text: `β (shape) = ${beta.toFixed(2)} · η (scale) = ${Math.round(eta).toLocaleString()} cycles — characteristic life at 63.2% cumulative probability`,
    style: { color: t.inkSoft, fontSize: "14px" },
  },
  xAxis: {
    type: "logarithmic",
    title: {
      text: "Cycles to Failure (log scale)",
      style: { color: t.inkSoft, fontSize: "16px" },
    },
    tickPositions: xAxisTickPositions,
    startOnTick: false,
    endOnTick: false,
    lineColor: t.inkSoft,
    tickColor: t.inkSoft,
    gridLineColor: t.grid,
    gridLineWidth: 1,
    labels: { style: { color: t.inkSoft, fontSize: "14px" } },
  },
  yAxis: {
    title: {
      text: "Cumulative Failure Probability",
      style: { color: t.inkSoft, fontSize: "16px" },
    },
    tickPositions: weibullTicks.map((wt) => wt.y),
    gridLineColor: t.grid,
    lineColor: t.inkSoft,
    labels: {
      style: { color: t.inkSoft, fontSize: "14px" },
      formatter() {
        const match = weibullTicks.find((wt) => Math.abs(wt.y - this.value) < 1e-6);
        return match ? `${match.p}%` : "";
      },
    },
    plotLines: [
      {
        value: weibullY(0.632),
        color: t.inkSoft,
        dashStyle: "ShortDash",
        width: 1.5,
        zIndex: 4,
        label: {
          text: "63.2% · η",
          style: { color: t.inkSoft, fontSize: "13px" },
          align: "left",
          x: 6,
        },
      },
    ],
  },
  legend: {
    itemStyle: { color: t.inkSoft, fontSize: "14px" },
    itemHoverStyle: { color: t.ink },
  },
  tooltip: {
    pointFormatter() {
      const probability = (1 - Math.exp(-Math.exp(this.y))) * 100;
      return `Cycles: ${this.x.toLocaleString()}<br/>Probability: ${probability.toFixed(1)}%`;
    },
  },
  plotOptions: {
    series: { animation: false },
    scatter: { marker: { radius: 7, lineWidth: 2 } },
  },
  series: [
    {
      type: "scatter",
      name: "Failures",
      data: failurePoints,
      marker: {
        symbol: "circle",
        fillColor: t.palette[0],
        lineColor: t.palette[0],
        lineWidth: 0,
      },
      color: t.palette[0],
    },
    {
      type: "scatter",
      name: "Suspensions (censored)",
      data: suspensionPoints,
      marker: {
        symbol: "circle",
        fillColor: t.pageBg,
        lineColor: t.palette[0],
        lineWidth: 2,
      },
      color: t.palette[0],
    },
    {
      type: "line",
      name: "Weibull fit",
      data: fitLine,
      color: t.ink,
      lineWidth: 2.5,
      dashStyle: "ShortDash",
      marker: { enabled: false },
      enableMouseTracking: false,
    },
  ],
});
Runnable source as JSON, for any HTTP client: https://api.anyplot.ai/specs/probability-weibull/highcharts/code. Any spec id and library id listed in llms-full.txt fit the same URL shape; every URL below is complete and callable.
{
  "spec_id": "probability-weibull",
  "language": "javascript",
  "library": "highcharts",
  "page": "https://anyplot.ai/probability-weibull/javascript/highcharts",
  "hub": "https://anyplot.ai/probability-weibull",
  "code_json": "https://api.anyplot.ai/specs/probability-weibull/highcharts/code",
  "spec_json": "https://api.anyplot.ai/specs/probability-weibull",
  "render_light_png": "https://storage.googleapis.com/anyplot-images/plots/probability-weibull/javascript/highcharts/plot-light.png",
  "render_dark_png": "https://storage.googleapis.com/anyplot-images/plots/probability-weibull/javascript/highcharts/plot-dark.png",
  "interactive_light_html": "https://storage.googleapis.com/anyplot-images/plots/probability-weibull/javascript/highcharts/plot-light.html",
  "interactive_dark_html": "https://storage.googleapis.com/anyplot-images/plots/probability-weibull/javascript/highcharts/plot-dark.html",
  "quality_score": 90.0,
  "license": "MIT",
  "guide": "https://anyplot.ai/llms.txt"
}
Part of Weibull Probability Plot for Reliability Analysis on anyplot.ai.