The same plot in 14 other libraries — JavaScript: Chart.js, D3.js, Highcharts, MUI X Charts; Python: Altair, Bokeh, lets-plot, Matplotlib, Plotly, plotnine, Pygal, Seaborn; R: ggplot2; Julia: Makie.jl. Compare all 15 side by side: Basic QR Code Generator in Python, R, Julia and JavaScript.
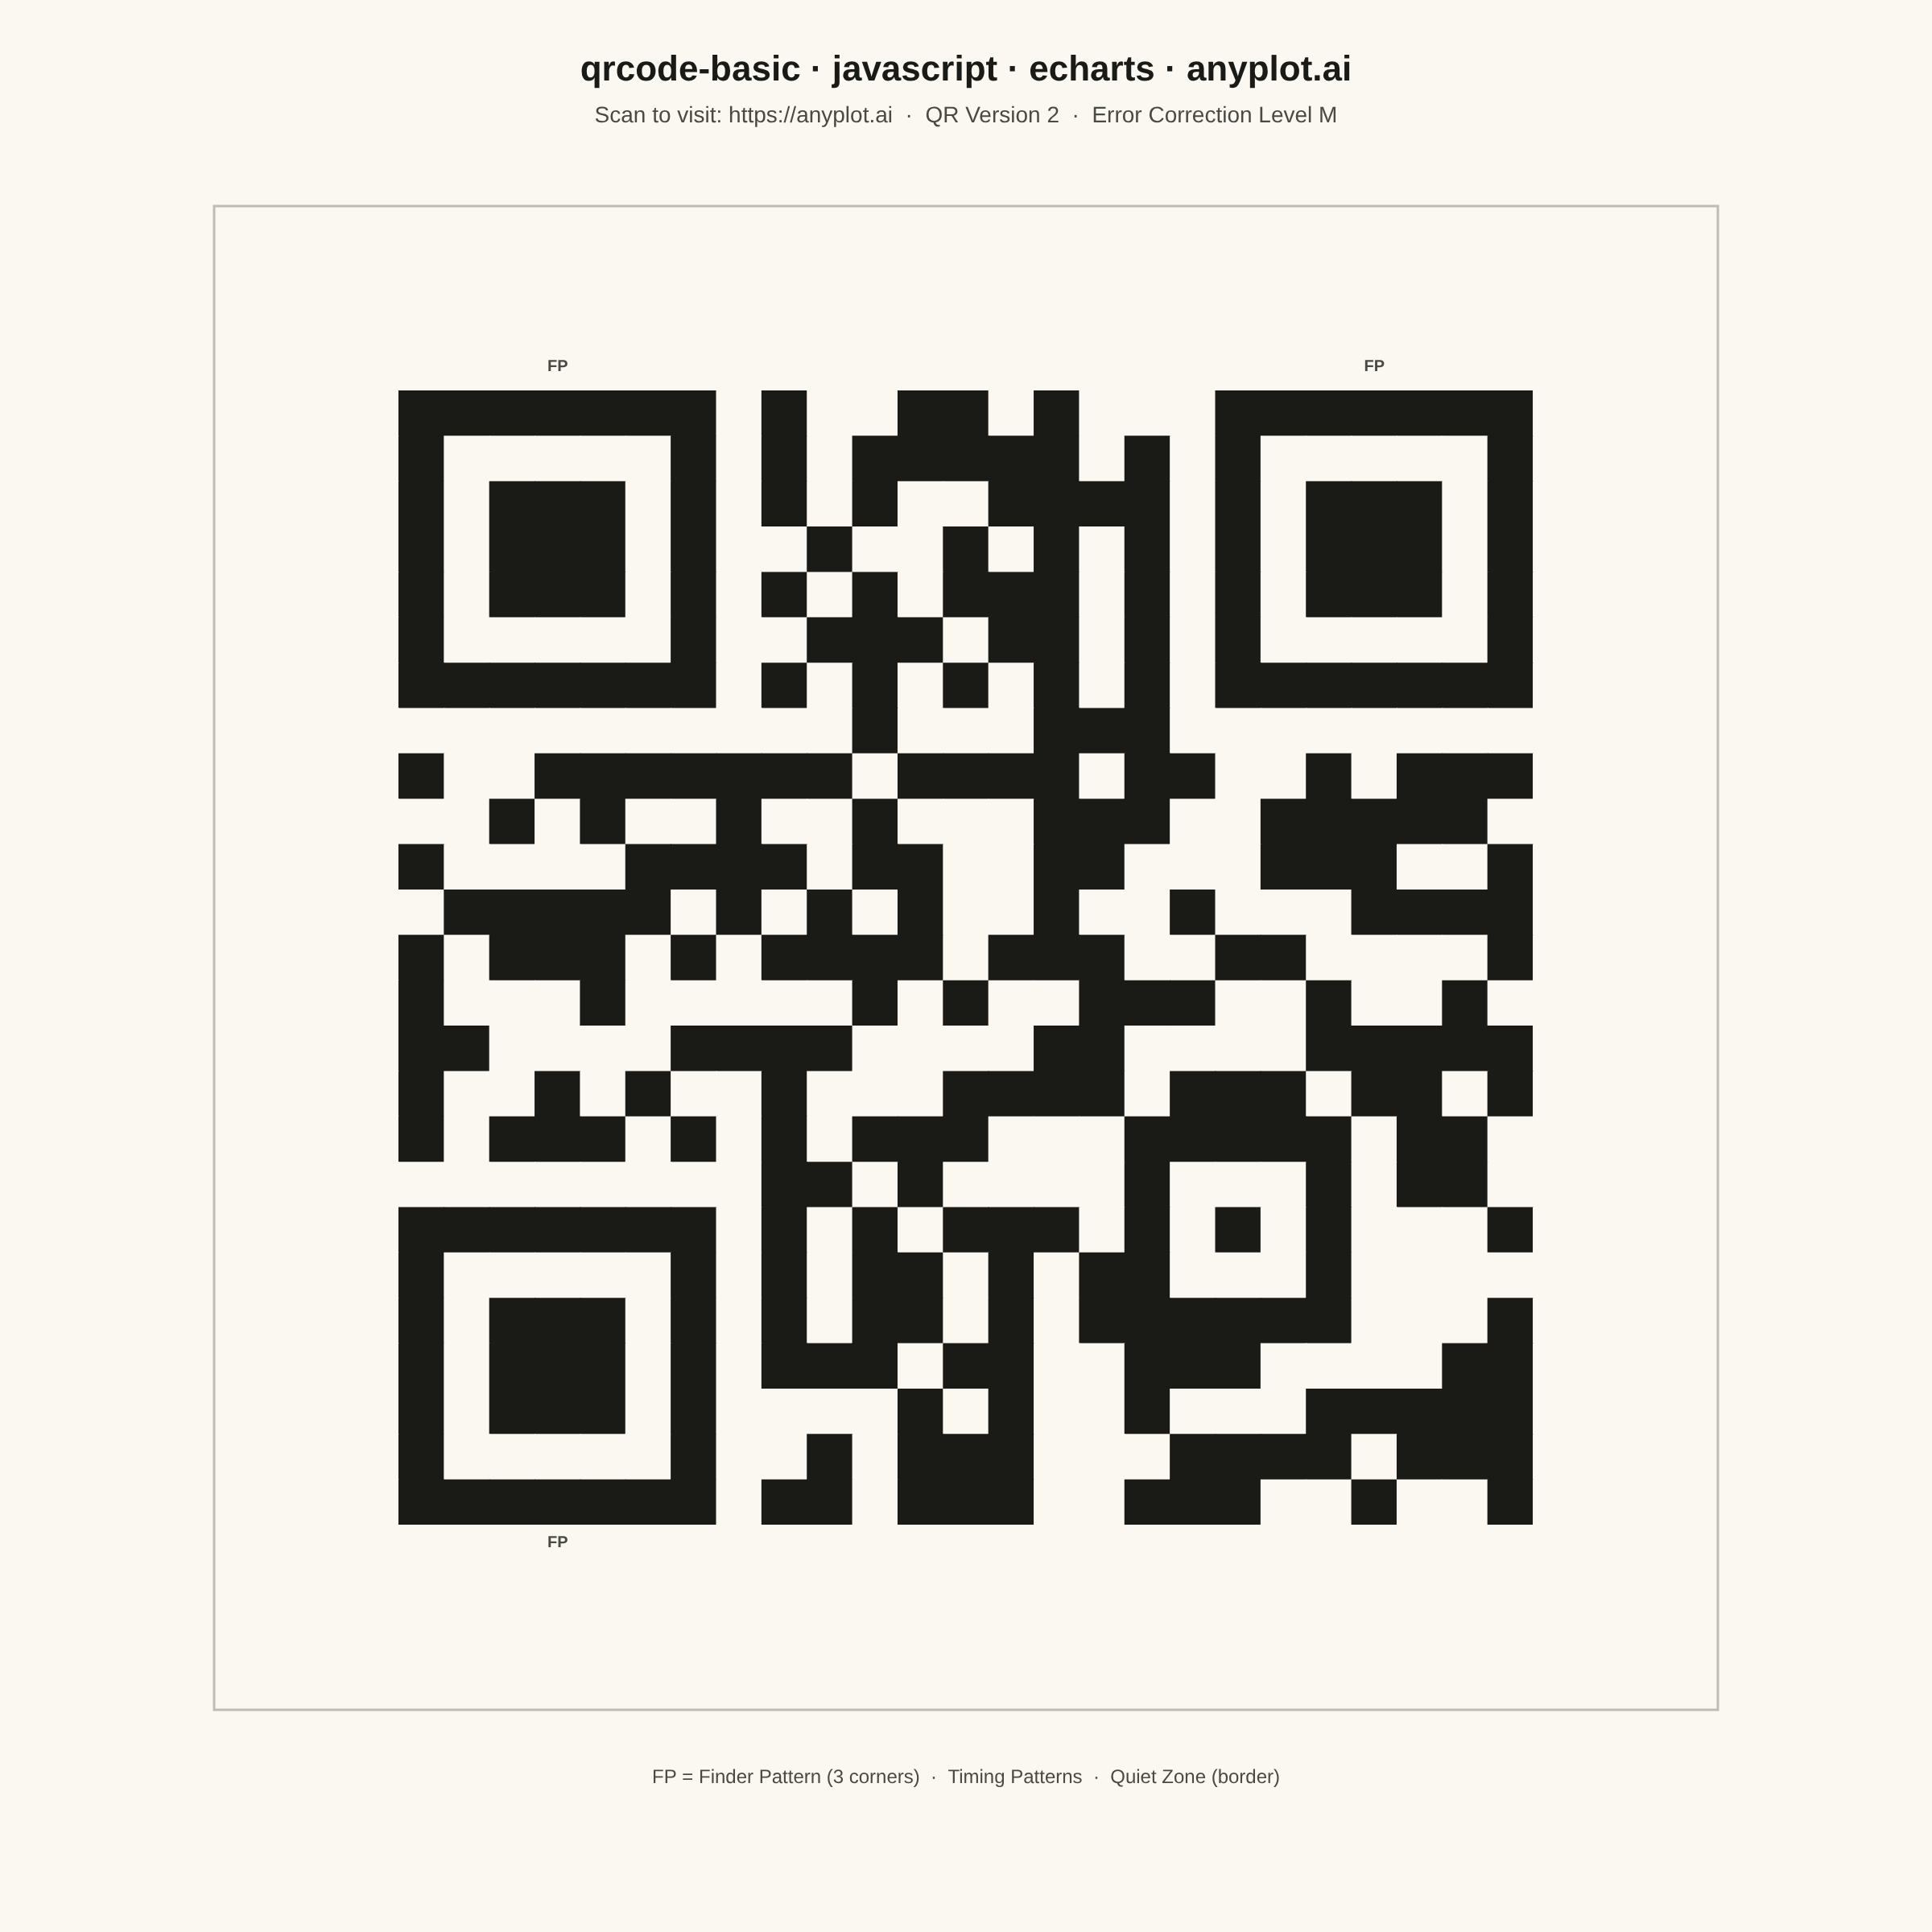
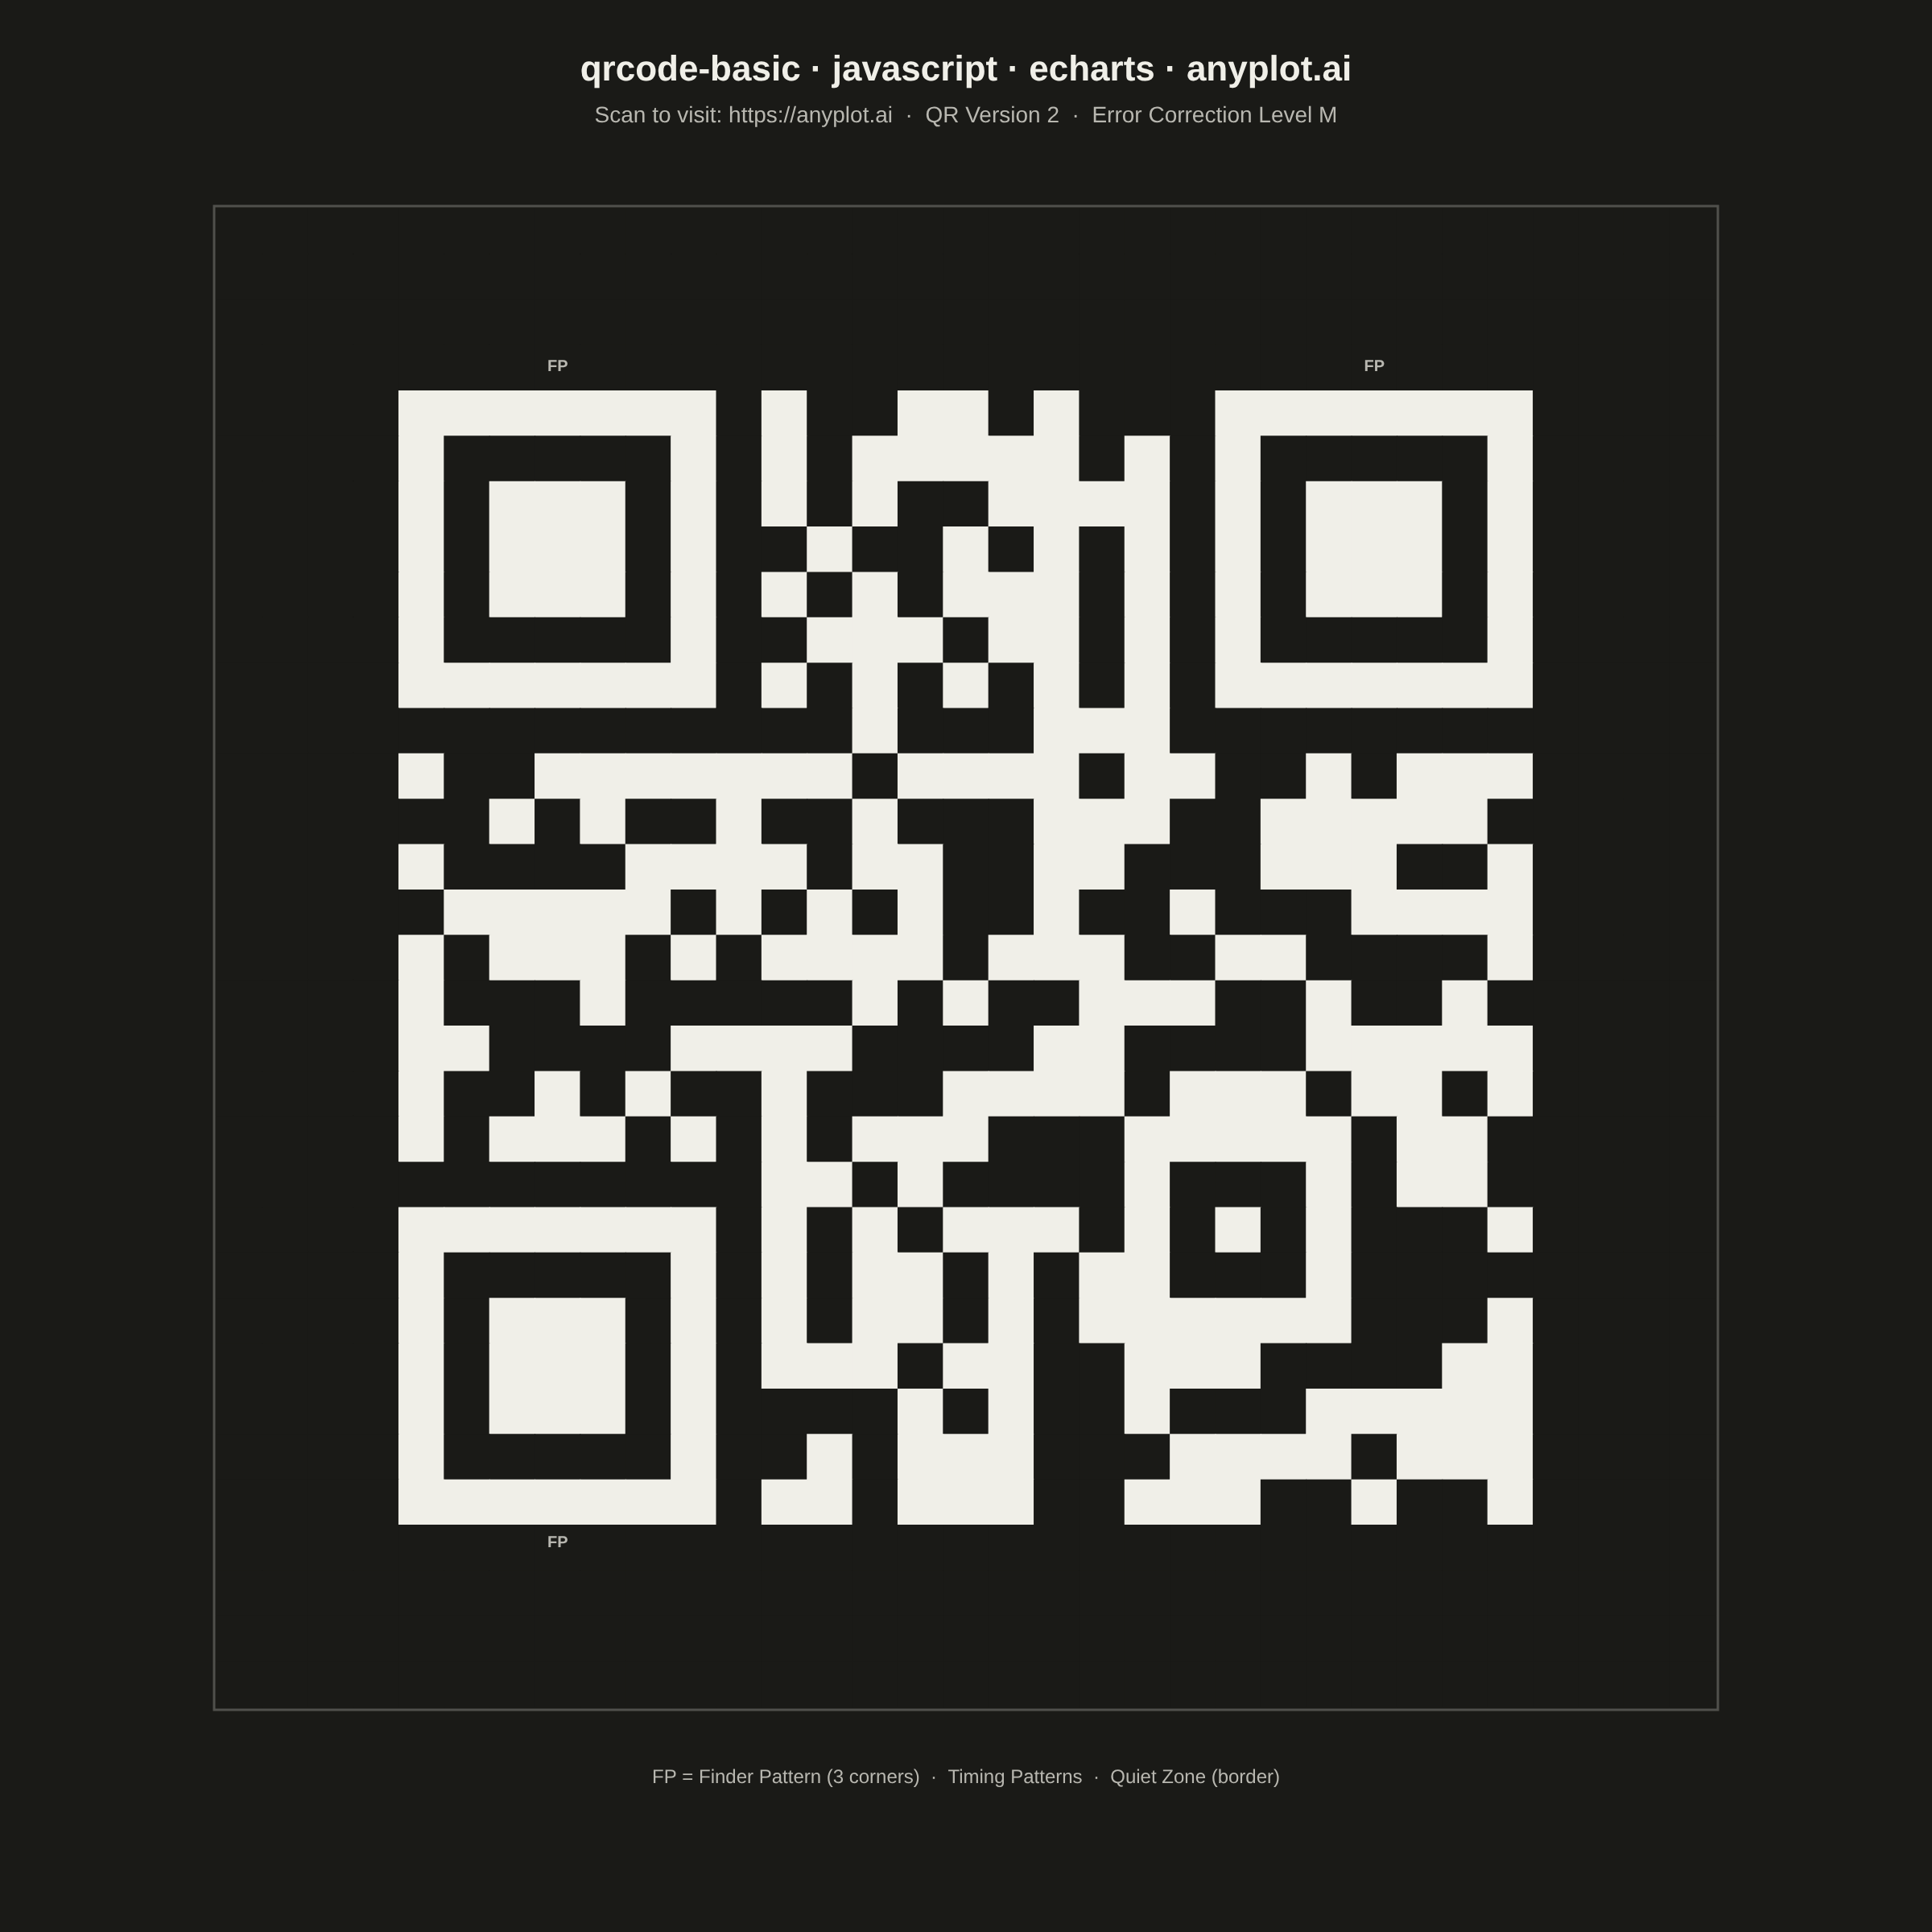
A QR (Quick Response) code visualization that encodes text or URL data into a square matrix barcode pattern. QR codes are two-dimensional barcodes that store information in a grid of black and white squares, readable by smartphones and dedicated scanners. This visualization is useful for generating scannable codes for quick data sharing and mobile access.
// anyplot.ai
// qrcode-basic: Basic QR Code Generator
// Library: echarts 5.5.1 | JavaScript 22.23.0
// Quality: 87/100 | Created: 2026-06-24
//# anyplot-orientation: square

const t = window.ANYPLOT_TOKENS;

// QR code matrix (Version 2, 25×25, EC Level M) encoding "https://anyplot.ai"
// Generated by the qrcode library — standard-compliant, scannable by any QR reader
const QR_MATRIX = [
  [1,1,1,1,1,1,1,0,1,0,0,1,1,0,1,0,0,0,1,1,1,1,1,1,1],
  [1,0,0,0,0,0,1,0,1,0,1,1,1,1,1,0,1,0,1,0,0,0,0,0,1],
  [1,0,1,1,1,0,1,0,1,0,1,0,0,1,1,1,1,0,1,0,1,1,1,0,1],
  [1,0,1,1,1,0,1,0,0,1,0,0,1,0,1,0,1,0,1,0,1,1,1,0,1],
  [1,0,1,1,1,0,1,0,1,0,1,0,1,1,1,0,1,0,1,0,1,1,1,0,1],
  [1,0,0,0,0,0,1,0,0,1,1,1,0,1,1,0,1,0,1,0,0,0,0,0,1],
  [1,1,1,1,1,1,1,0,1,0,1,0,1,0,1,0,1,0,1,1,1,1,1,1,1],
  [0,0,0,0,0,0,0,0,0,0,1,0,0,0,1,1,1,0,0,0,0,0,0,0,0],
  [1,0,0,1,1,1,1,1,1,1,0,1,1,1,1,0,1,1,0,0,1,0,1,1,1],
  [0,0,1,0,1,0,0,1,0,0,1,0,0,0,1,1,1,0,0,1,1,1,1,1,0],
  [1,0,0,0,0,1,1,1,1,0,1,1,0,0,1,1,0,0,0,1,1,1,0,0,1],
  [0,1,1,1,1,1,0,1,0,1,0,1,0,0,1,0,0,1,0,0,0,1,1,1,1],
  [1,0,1,1,1,0,1,0,1,1,1,1,0,1,1,1,0,0,1,1,0,0,0,0,1],
  [1,0,0,0,1,0,0,0,0,0,1,0,1,0,0,1,1,1,0,0,1,0,0,1,0],
  [1,1,0,0,0,0,1,1,1,1,0,0,0,0,1,1,0,0,0,0,1,1,1,1,1],
  [1,0,0,1,0,1,0,0,1,0,0,0,1,1,1,1,0,1,1,1,0,1,1,0,1],
  [1,0,1,1,1,0,1,0,1,0,1,1,1,0,0,0,1,1,1,1,1,0,1,1,0],
  [0,0,0,0,0,0,0,0,1,1,0,1,0,0,0,0,1,0,0,0,1,0,1,1,0],
  [1,1,1,1,1,1,1,0,1,0,1,0,1,1,1,0,1,0,1,0,1,0,0,0,1],
  [1,0,0,0,0,0,1,0,1,0,1,1,0,1,0,1,1,0,0,0,1,0,0,0,0],
  [1,0,1,1,1,0,1,0,1,0,1,1,0,1,0,1,1,1,1,1,1,0,0,0,1],
  [1,0,1,1,1,0,1,0,1,1,1,0,1,1,0,0,1,1,1,0,0,0,0,1,1],
  [1,0,1,1,1,0,1,0,0,0,0,1,0,1,0,0,1,0,0,0,1,1,1,1,1],
  [1,0,0,0,0,0,1,0,0,1,0,1,1,1,0,0,0,1,1,1,1,0,1,1,1],
  [1,1,1,1,1,1,1,0,1,1,0,1,1,1,0,0,1,1,1,0,0,1,0,0,1],
];
const QR_SIZE = 25;

// Add 4-module quiet zone around QR code (required for reliable scanning)
const QUIET = 4;
const TOTAL = QR_SIZE + 2 * QUIET; // 33

const data = [];
for (let r = 0; r < TOTAL; r++) {
  for (let c = 0; c < TOTAL; c++) {
    const inQR = r >= QUIET && r < QUIET + QR_SIZE && c >= QUIET && c < QUIET + QR_SIZE;
    const value = inQR ? QR_MATRIX[r - QUIET][c - QUIET] : 0;
    data.push([c, r, value]);
  }
}

const chart = echarts.init(document.getElementById("container"));

// QR module colors: high-contrast ink on page background
// Light theme: near-black on cream; dark theme: near-white on near-black
const MODULE_DARK = t.ink;
const MODULE_LIGHT = t.pageBg;

// Grid: 930×930 CSS px centered in 1200×1200 mount
// Equal left/right margins (135 px) + increased bottom (140 px) center the QR vertically
const GRID_SIZE = 930;
const MARGIN = (1200 - GRID_SIZE) / 2; // 135 CSS px
const GRID_TOP = 130;
const GRID_BOTTOM = 140;

// Cell size for computing annotation positions
const cellW = GRID_SIZE / TOTAL; // ≈ 28.18 px

// Finder-pattern pixel anchors (top-left corner of each 7×7 FP block, in canvas coords)
const fp_tl_x = MARGIN + QUIET * cellW;          // top-left FP left edge
const fp_tl_y = GRID_TOP + QUIET * cellW;         // top FPs top edge
const fp_tr_x = MARGIN + (QUIET + 18) * cellW;   // top-right FP left edge
const fp_bl_y = GRID_TOP + (QUIET + 18) * cellW; // bottom-left FP top edge
const fp_w = 7 * cellW;                           // finder-pattern width/height
const fp_cx_l = fp_tl_x + fp_w / 2;              // left FP center x
const fp_cx_r = fp_tr_x + fp_w / 2;              // right FP center x
const qrBottom = 1200 - GRID_BOTTOM;              // grid bottom edge in canvas px

chart.setOption({
  animation: false,
  backgroundColor: t.pageBg,
  title: {
    text: "qrcode-basic · javascript · echarts · anyplot.ai",
    subtext: "Scan to visit: https://anyplot.ai  ·  QR Version 2  ·  Error Correction Level M",
    left: "center",
    top: 28,
    textStyle: { color: t.ink, fontSize: 22, fontWeight: "bold" },
    subtextStyle: { color: t.inkSoft, fontSize: 14 },
  },
  graphic: [
    // Thin themed frame around the full QR (including quiet zone) — design framing
    {
      type: "rect",
      bounding: "raw",
      shape: { x: MARGIN - 2, y: GRID_TOP - 2, width: GRID_SIZE + 4, height: GRID_SIZE + 4 },
      style: { fill: "transparent", stroke: t.inkSoft, lineWidth: 1.5, opacity: 0.35 },
      z: 50,
    },
    // "FP" callout above the top-left finder pattern (in the quiet zone)
    {
      type: "text",
      bounding: "raw",
      x: fp_cx_l,
      y: fp_tl_y - 20,
      style: { text: "FP", fill: t.inkSoft, fontSize: 10, fontWeight: "bold", textAlign: "center" },
      z: 60,
    },
    // "FP" callout above the top-right finder pattern (in the quiet zone)
    {
      type: "text",
      bounding: "raw",
      x: fp_cx_r,
      y: fp_tl_y - 20,
      style: { text: "FP", fill: t.inkSoft, fontSize: 10, fontWeight: "bold", textAlign: "center" },
      z: 60,
    },
    // "FP" callout below the bottom-left finder pattern (in the quiet zone)
    {
      type: "text",
      bounding: "raw",
      x: fp_cx_l,
      y: fp_bl_y + fp_w + 6,
      style: { text: "FP", fill: t.inkSoft, fontSize: 10, fontWeight: "bold", textAlign: "center" },
      z: 60,
    },
    // Footer annotation explaining QR structural components
    {
      type: "text",
      bounding: "raw",
      x: 600,
      y: qrBottom + 38,
      style: {
        text: "FP = Finder Pattern (3 corners)  ·  Timing Patterns  ·  Quiet Zone (border)",
        fill: t.inkSoft,
        fontSize: 12,
        textAlign: "center",
      },
      z: 50,
    },
  ],
  grid: {
    left: MARGIN,
    right: MARGIN,
    top: GRID_TOP,
    bottom: GRID_BOTTOM,
    containLabel: false,
  },
  xAxis: {
    type: "category",
    data: Array.from({ length: TOTAL }, (_, i) => i),
    show: false,
    splitLine: { show: false },
    axisTick: { show: false },
    axisLine: { show: false },
  },
  yAxis: {
    type: "category",
    data: Array.from({ length: TOTAL }, (_, i) => i),
    inverse: true,
    show: false,
    splitLine: { show: false },
    axisTick: { show: false },
    axisLine: { show: false },
  },
  visualMap: {
    type: "piecewise",
    show: false,
    pieces: [
      { value: 0, color: MODULE_LIGHT },
      { value: 1, color: MODULE_DARK },
    ],
  },
  series: [
    {
      type: "heatmap",
      data: data,
      itemStyle: { borderWidth: 0 },
    },
  ],
});
Runnable source as JSON, for any HTTP client: https://api.anyplot.ai/specs/qrcode-basic/echarts/code. Any spec id and library id listed in llms-full.txt fit the same URL shape; every URL below is complete and callable.
{
  "spec_id": "qrcode-basic",
  "language": "javascript",
  "library": "echarts",
  "page": "https://anyplot.ai/qrcode-basic/javascript/echarts",
  "hub": "https://anyplot.ai/qrcode-basic",
  "code_json": "https://api.anyplot.ai/specs/qrcode-basic/echarts/code",
  "spec_json": "https://api.anyplot.ai/specs/qrcode-basic",
  "render_light_png": "https://storage.googleapis.com/anyplot-images/plots/qrcode-basic/javascript/echarts/plot-light.png",
  "render_dark_png": "https://storage.googleapis.com/anyplot-images/plots/qrcode-basic/javascript/echarts/plot-dark.png",
  "interactive_light_html": "https://storage.googleapis.com/anyplot-images/plots/qrcode-basic/javascript/echarts/plot-light.html",
  "interactive_dark_html": "https://storage.googleapis.com/anyplot-images/plots/qrcode-basic/javascript/echarts/plot-dark.html",
  "quality_score": 87.0,
  "license": "MIT",
  "guide": "https://anyplot.ai/llms.txt"
}
Part of Basic QR Code Generator on anyplot.ai.