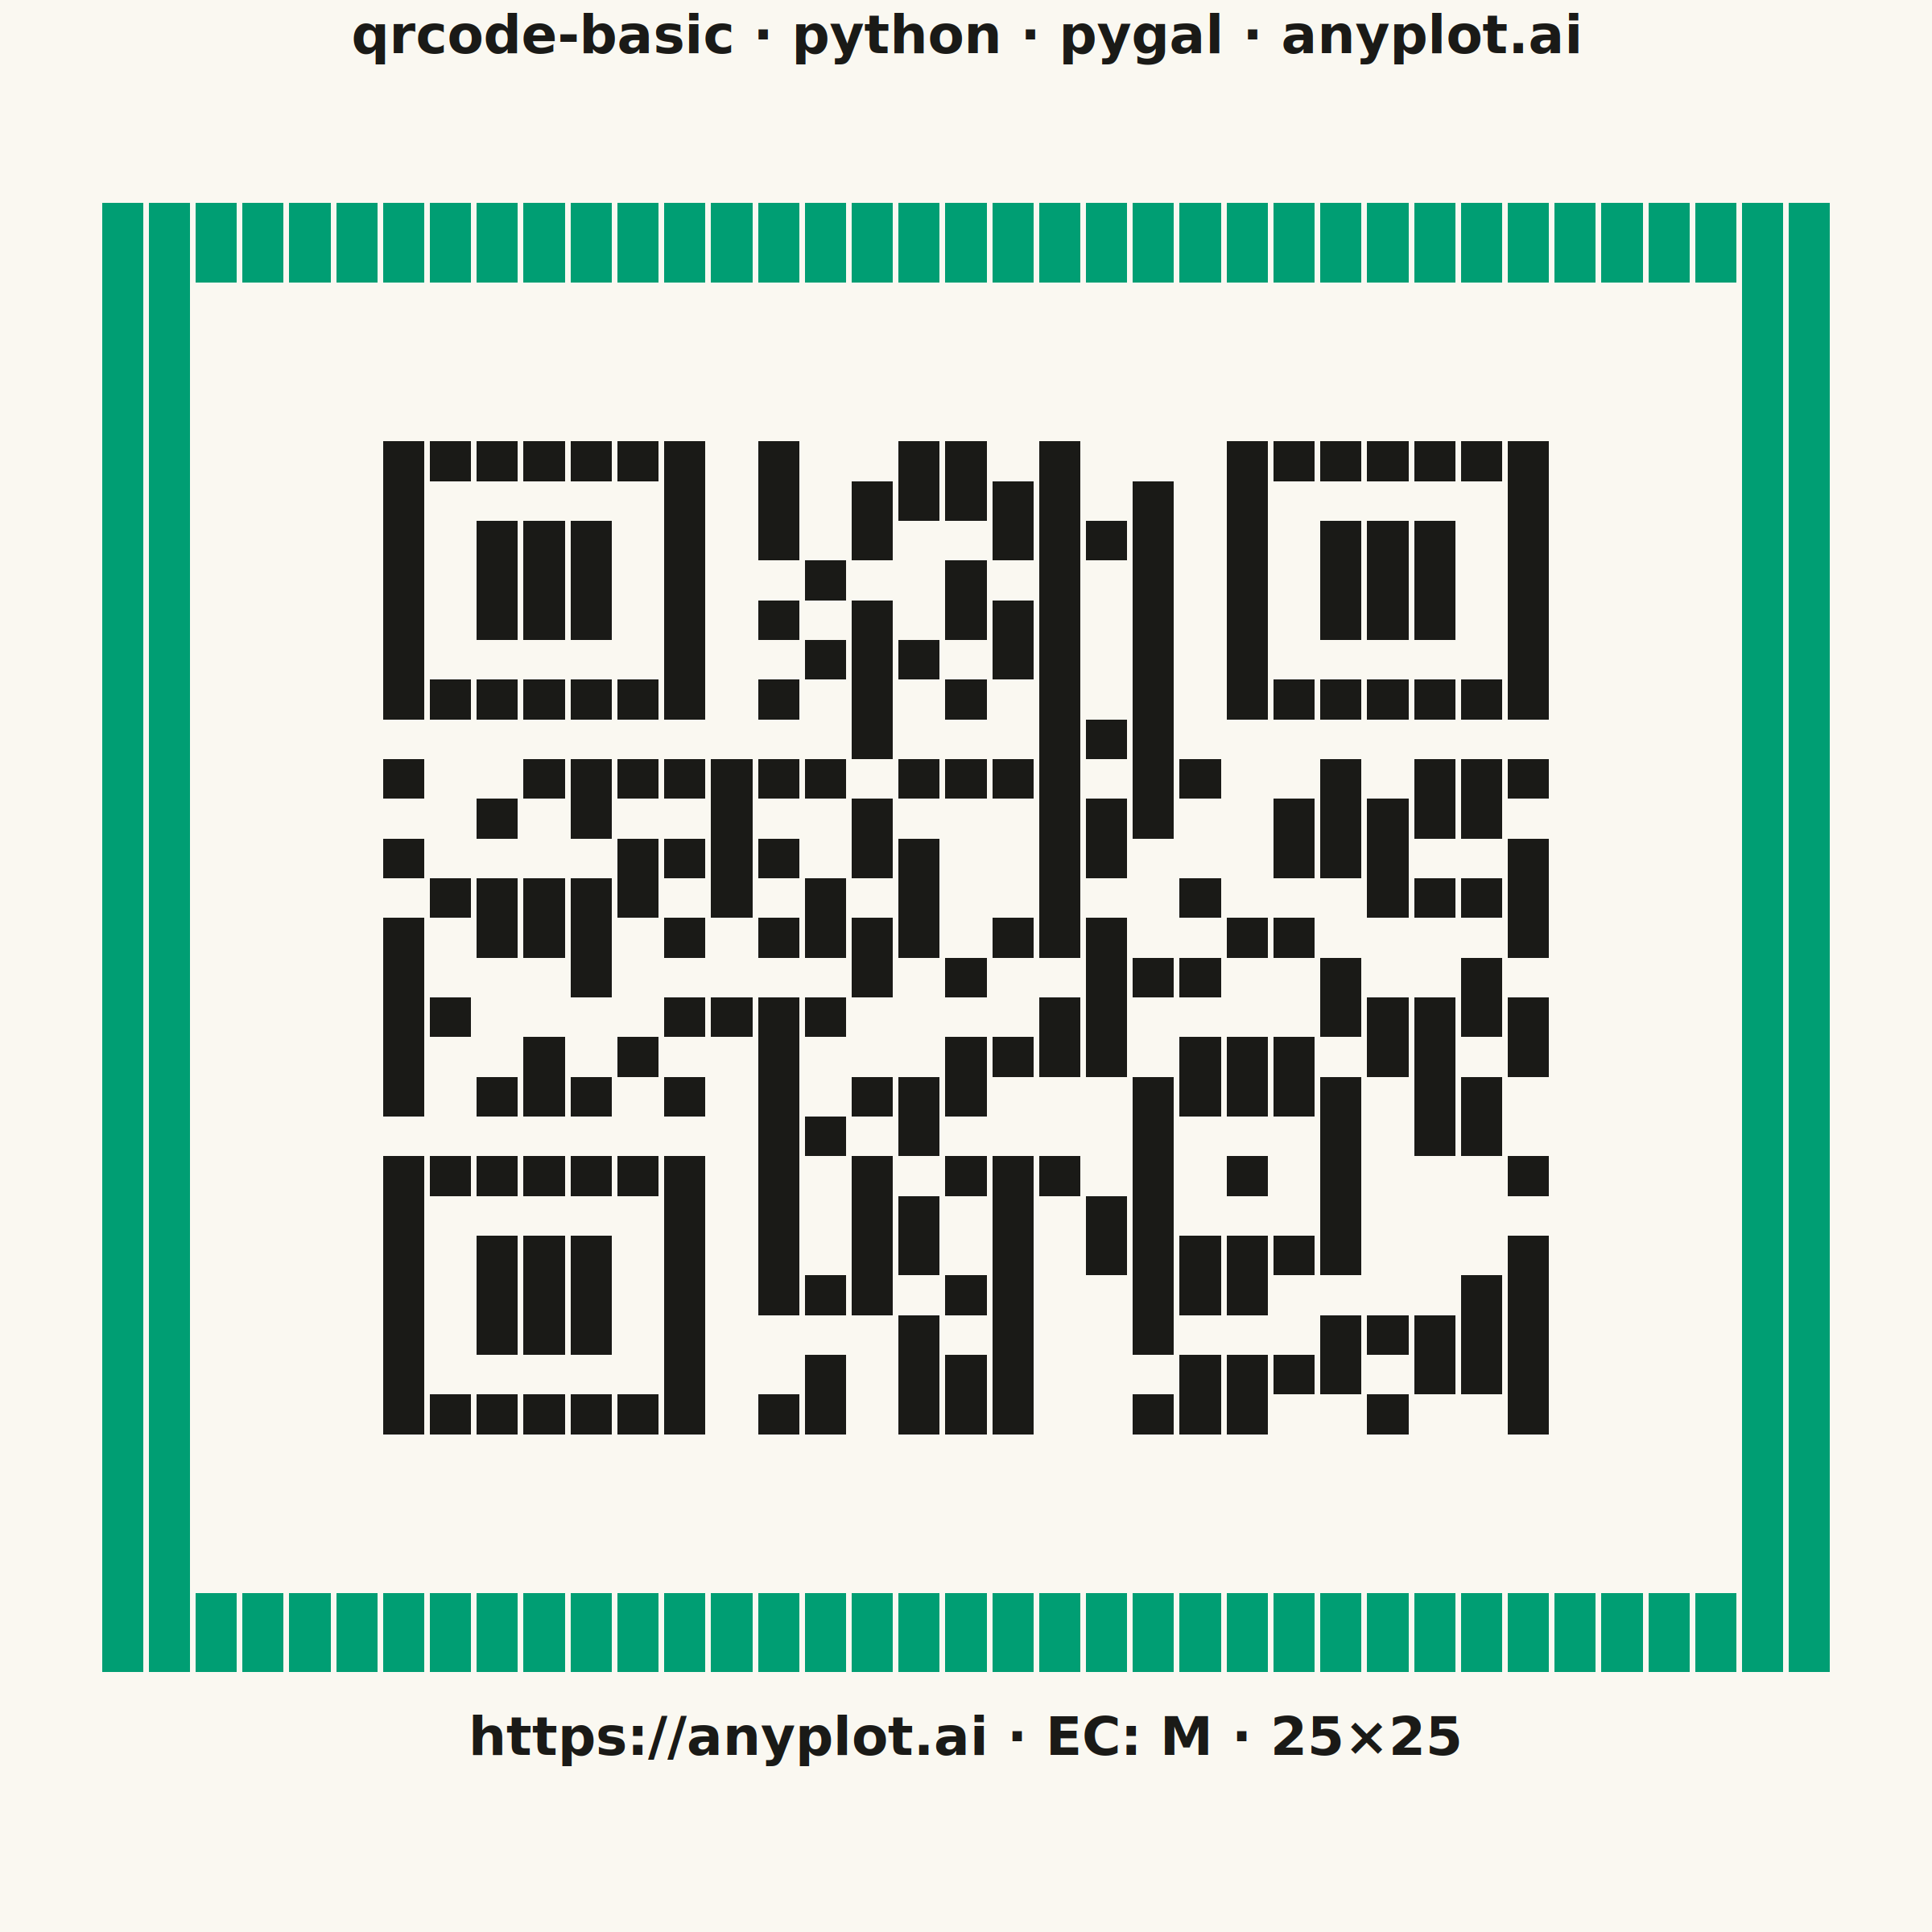
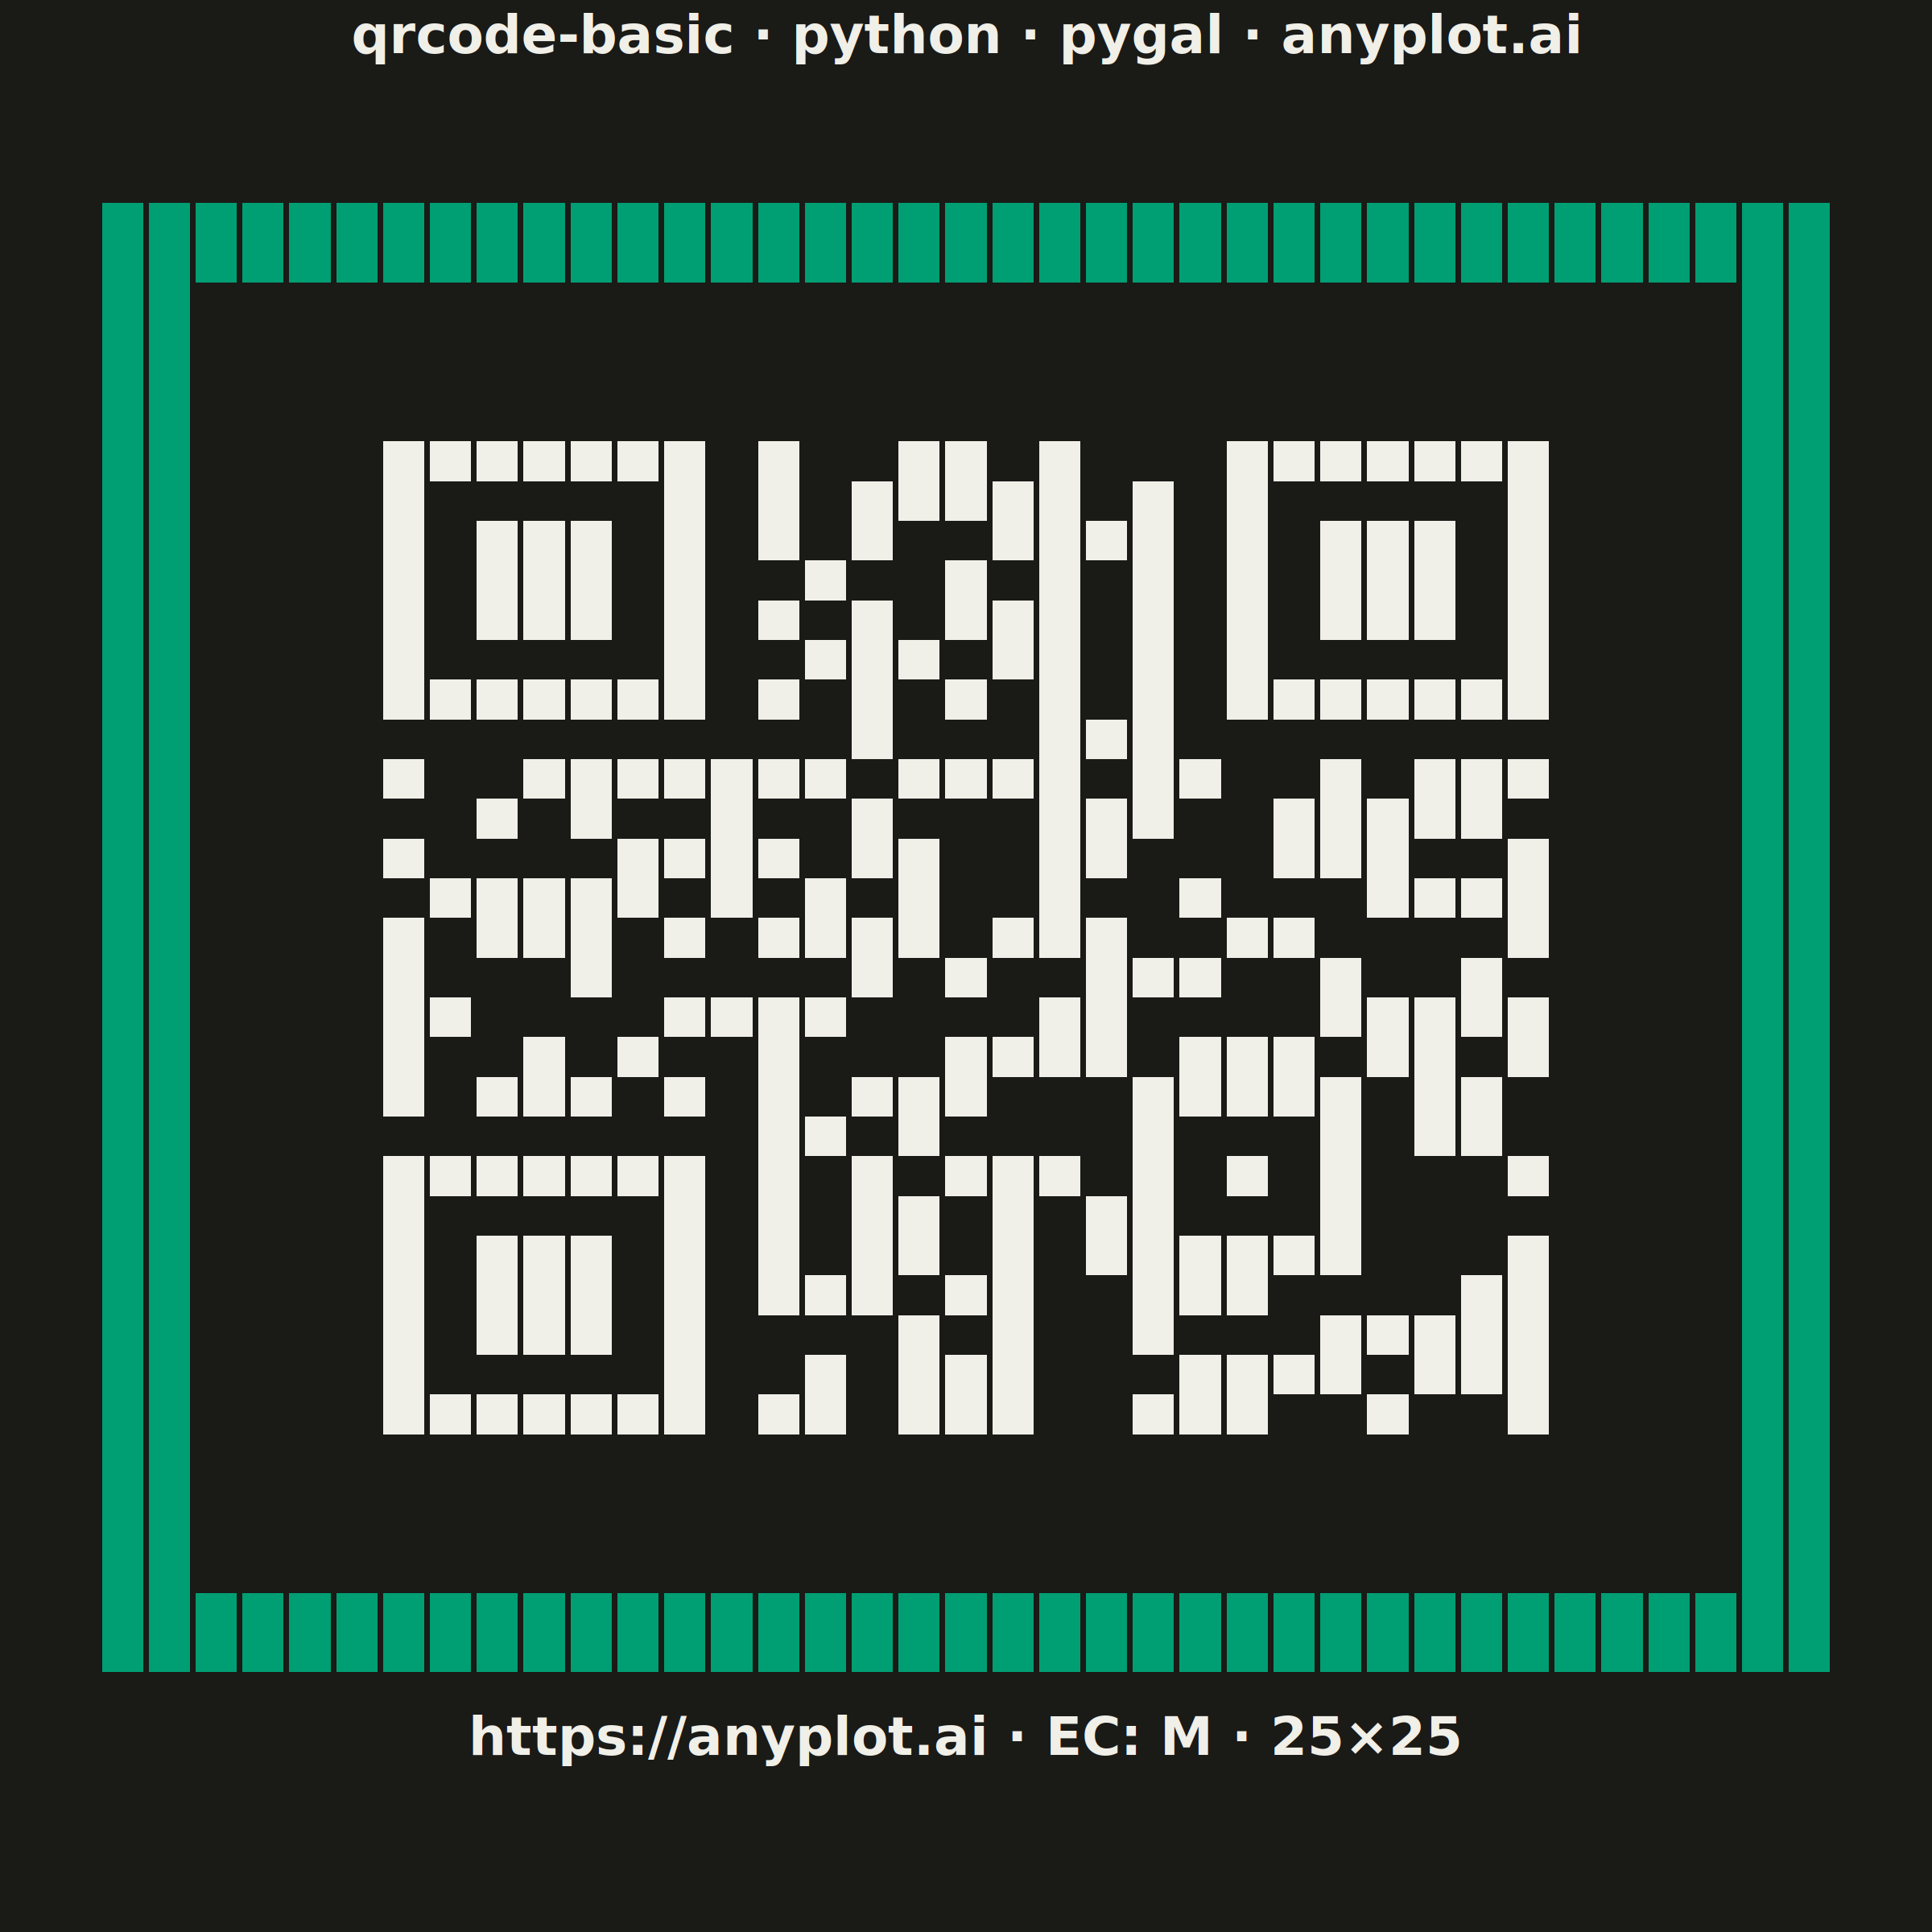
A QR (Quick Response) code visualization that encodes text or URL data into a square matrix barcode pattern. QR codes are two-dimensional barcodes that store information in a grid of black and white squares, readable by smartphones and dedicated scanners. This visualization is useful for generating scannable codes for quick data sharing and mobile access.
""" anyplot.ai
qrcode-basic: Basic QR Code Generator
Library: pygal 3.1.3 | Python 3.13.14
Quality: 88/100 | Updated: 2026-06-24
"""

import os
import sys

import qrcode


# Avoid name collision: pygal.py filename shadows the pygal package
_cwd = sys.path[0] if sys.path[0] else "."
if _cwd in sys.path:
    sys.path.remove(_cwd)

import pygal
from pygal.style import Style


sys.path.insert(0, _cwd)

# --- Theme ---
THEME = os.getenv("ANYPLOT_THEME", "light")
PAGE_BG = "#FAF8F1" if THEME == "light" else "#1A1A17"
INK = "#1A1A17" if THEME == "light" else "#F0EFE8"
INK_MUTED = "#6B6A63" if THEME == "light" else "#A8A79F"

MODULE_DARK = INK  # high-contrast QR dark modules, theme-adaptive
MODULE_LIGHT = PAGE_BG  # QR light modules match page background
FRAME_ACCENT = "#009E73"  # Imprint brand green — quiet-zone frame annotation

# --- Data ---
qr_content = "https://anyplot.ai"
qr = qrcode.QRCode(version=None, error_correction=qrcode.constants.ERROR_CORRECT_M, box_size=1, border=0)
qr.add_data(qr_content)
qr.make(fit=True)
qr_matrix = qr.get_matrix()
matrix_size = len(qr_matrix)

# 4-cell ISO-spec quiet zone + 2-cell brand-green frame annotation (wider = more solid)
inner_quiet = 4
outer_frame = 2
total_cells = matrix_size + 2 * (inner_quiet + outer_frame)

# Slight oversize per cell closes SVG sub-pixel rendering gaps between rows
CELL = 1.05

# --- Style (2400×2400 square canvas — Imprint palette sizing) ---
custom_style = Style(
    background=PAGE_BG,
    plot_background=PAGE_BG,
    foreground=INK,
    foreground_strong=INK,
    foreground_subtle=INK_MUTED,
    colors=(MODULE_DARK, MODULE_LIGHT, FRAME_ACCENT),
    title_font_size=66,
    label_font_size=56,
    major_label_font_size=44,
    legend_font_size=44,
    value_font_size=36,
    font_family="'Helvetica Neue', Helvetica, Arial, sans-serif",
    opacity=1.0,
    opacity_hover=1.0,
    transition="0s",
    stroke_width=0,
)

custom_css = (
    "inline:"
    "rect { stroke-width: 0 !important; stroke: none !important;"
    " shape-rendering: crispEdges !important; }"
    " .title { font-weight: 600 !important; }"
)

chart = pygal.StackedBar(
    width=2400,
    height=2400,
    style=custom_style,
    title="qrcode-basic · python · pygal · anyplot.ai",
    show_legend=False,
    show_x_labels=False,
    show_y_labels=False,
    show_x_guides=False,
    show_y_guides=False,
    spacing=0,
    margin=80,
    margin_top=150,
    margin_bottom=220,
    print_values=False,
    range=(0, total_cells * CELL),
    x_title=f"{qr_content} · EC: M · {matrix_size}×{matrix_size}",
    css=["file://style.css", "file://graph.css", custom_css],
)

# --- Build rows (StackedBar stacks bottom-to-top) ---
full_frame = [FRAME_ACCENT] * total_cells
side_frame = (
    [FRAME_ACCENT] * outer_frame + [MODULE_LIGHT] * (total_cells - 2 * outer_frame) + [FRAME_ACCENT] * outer_frame
)


# Bottom outer frame then quiet zone
for _ in range(outer_frame):
    chart.add("", [{"value": CELL, "color": c} for c in full_frame])
for _ in range(inner_quiet):
    chart.add("", [{"value": CELL, "color": c} for c in side_frame])

# QR matrix rows (reversed so matrix row 0 ends up at the top)
for row_idx in reversed(range(matrix_size)):
    row = (
        [FRAME_ACCENT] * outer_frame
        + [MODULE_LIGHT] * inner_quiet
        + [MODULE_DARK if qr_matrix[row_idx][c] else MODULE_LIGHT for c in range(matrix_size)]
        + [MODULE_LIGHT] * inner_quiet
        + [FRAME_ACCENT] * outer_frame
    )
    chart.add("", [{"value": CELL, "color": c} for c in row])

# Top quiet zone then outer frame
for _ in range(inner_quiet):
    chart.add("", [{"value": CELL, "color": c} for c in side_frame])
for _ in range(outer_frame):
    chart.add("", [{"value": CELL, "color": c} for c in full_frame])

# --- Save ---
chart.render_to_png(f"plot-{THEME}.png")
with open(f"plot-{THEME}.html", "wb") as f:
    f.write(chart.render())
Runnable source as JSON, for any HTTP client: https://api.anyplot.ai/specs/qrcode-basic/pygal/code. Any spec id and library id listed in llms-full.txt fit the same URL shape; every URL below is complete and callable.
{
  "spec_id": "qrcode-basic",
  "language": "python",
  "library": "pygal",
  "page": "https://anyplot.ai/qrcode-basic/python/pygal",
  "hub": "https://anyplot.ai/qrcode-basic",
  "code_json": "https://api.anyplot.ai/specs/qrcode-basic/pygal/code",
  "spec_json": "https://api.anyplot.ai/specs/qrcode-basic",
  "render_light_png": "https://storage.googleapis.com/anyplot-images/plots/qrcode-basic/python/pygal/plot-light.png",
  "render_dark_png": "https://storage.googleapis.com/anyplot-images/plots/qrcode-basic/python/pygal/plot-dark.png",
  "interactive_light_html": "https://storage.googleapis.com/anyplot-images/plots/qrcode-basic/python/pygal/plot-light.html",
  "interactive_dark_html": "https://storage.googleapis.com/anyplot-images/plots/qrcode-basic/python/pygal/plot-dark.html",
  "quality_score": 88.0,
  "license": "MIT",
  "guide": "https://anyplot.ai/llms.txt"
}
Part of Basic QR Code Generator on anyplot.ai.