The same plot in 14 other libraries — JavaScript: Chart.js, D3.js, Apache ECharts, MUI X Charts; Python: Altair, Bokeh, lets-plot, Matplotlib, Plotly, plotnine, Pygal, Seaborn; R: ggplot2; Julia: Makie.jl. Compare all 15 side by side: Basic QR Code Generator in Python, R, Julia and JavaScript.
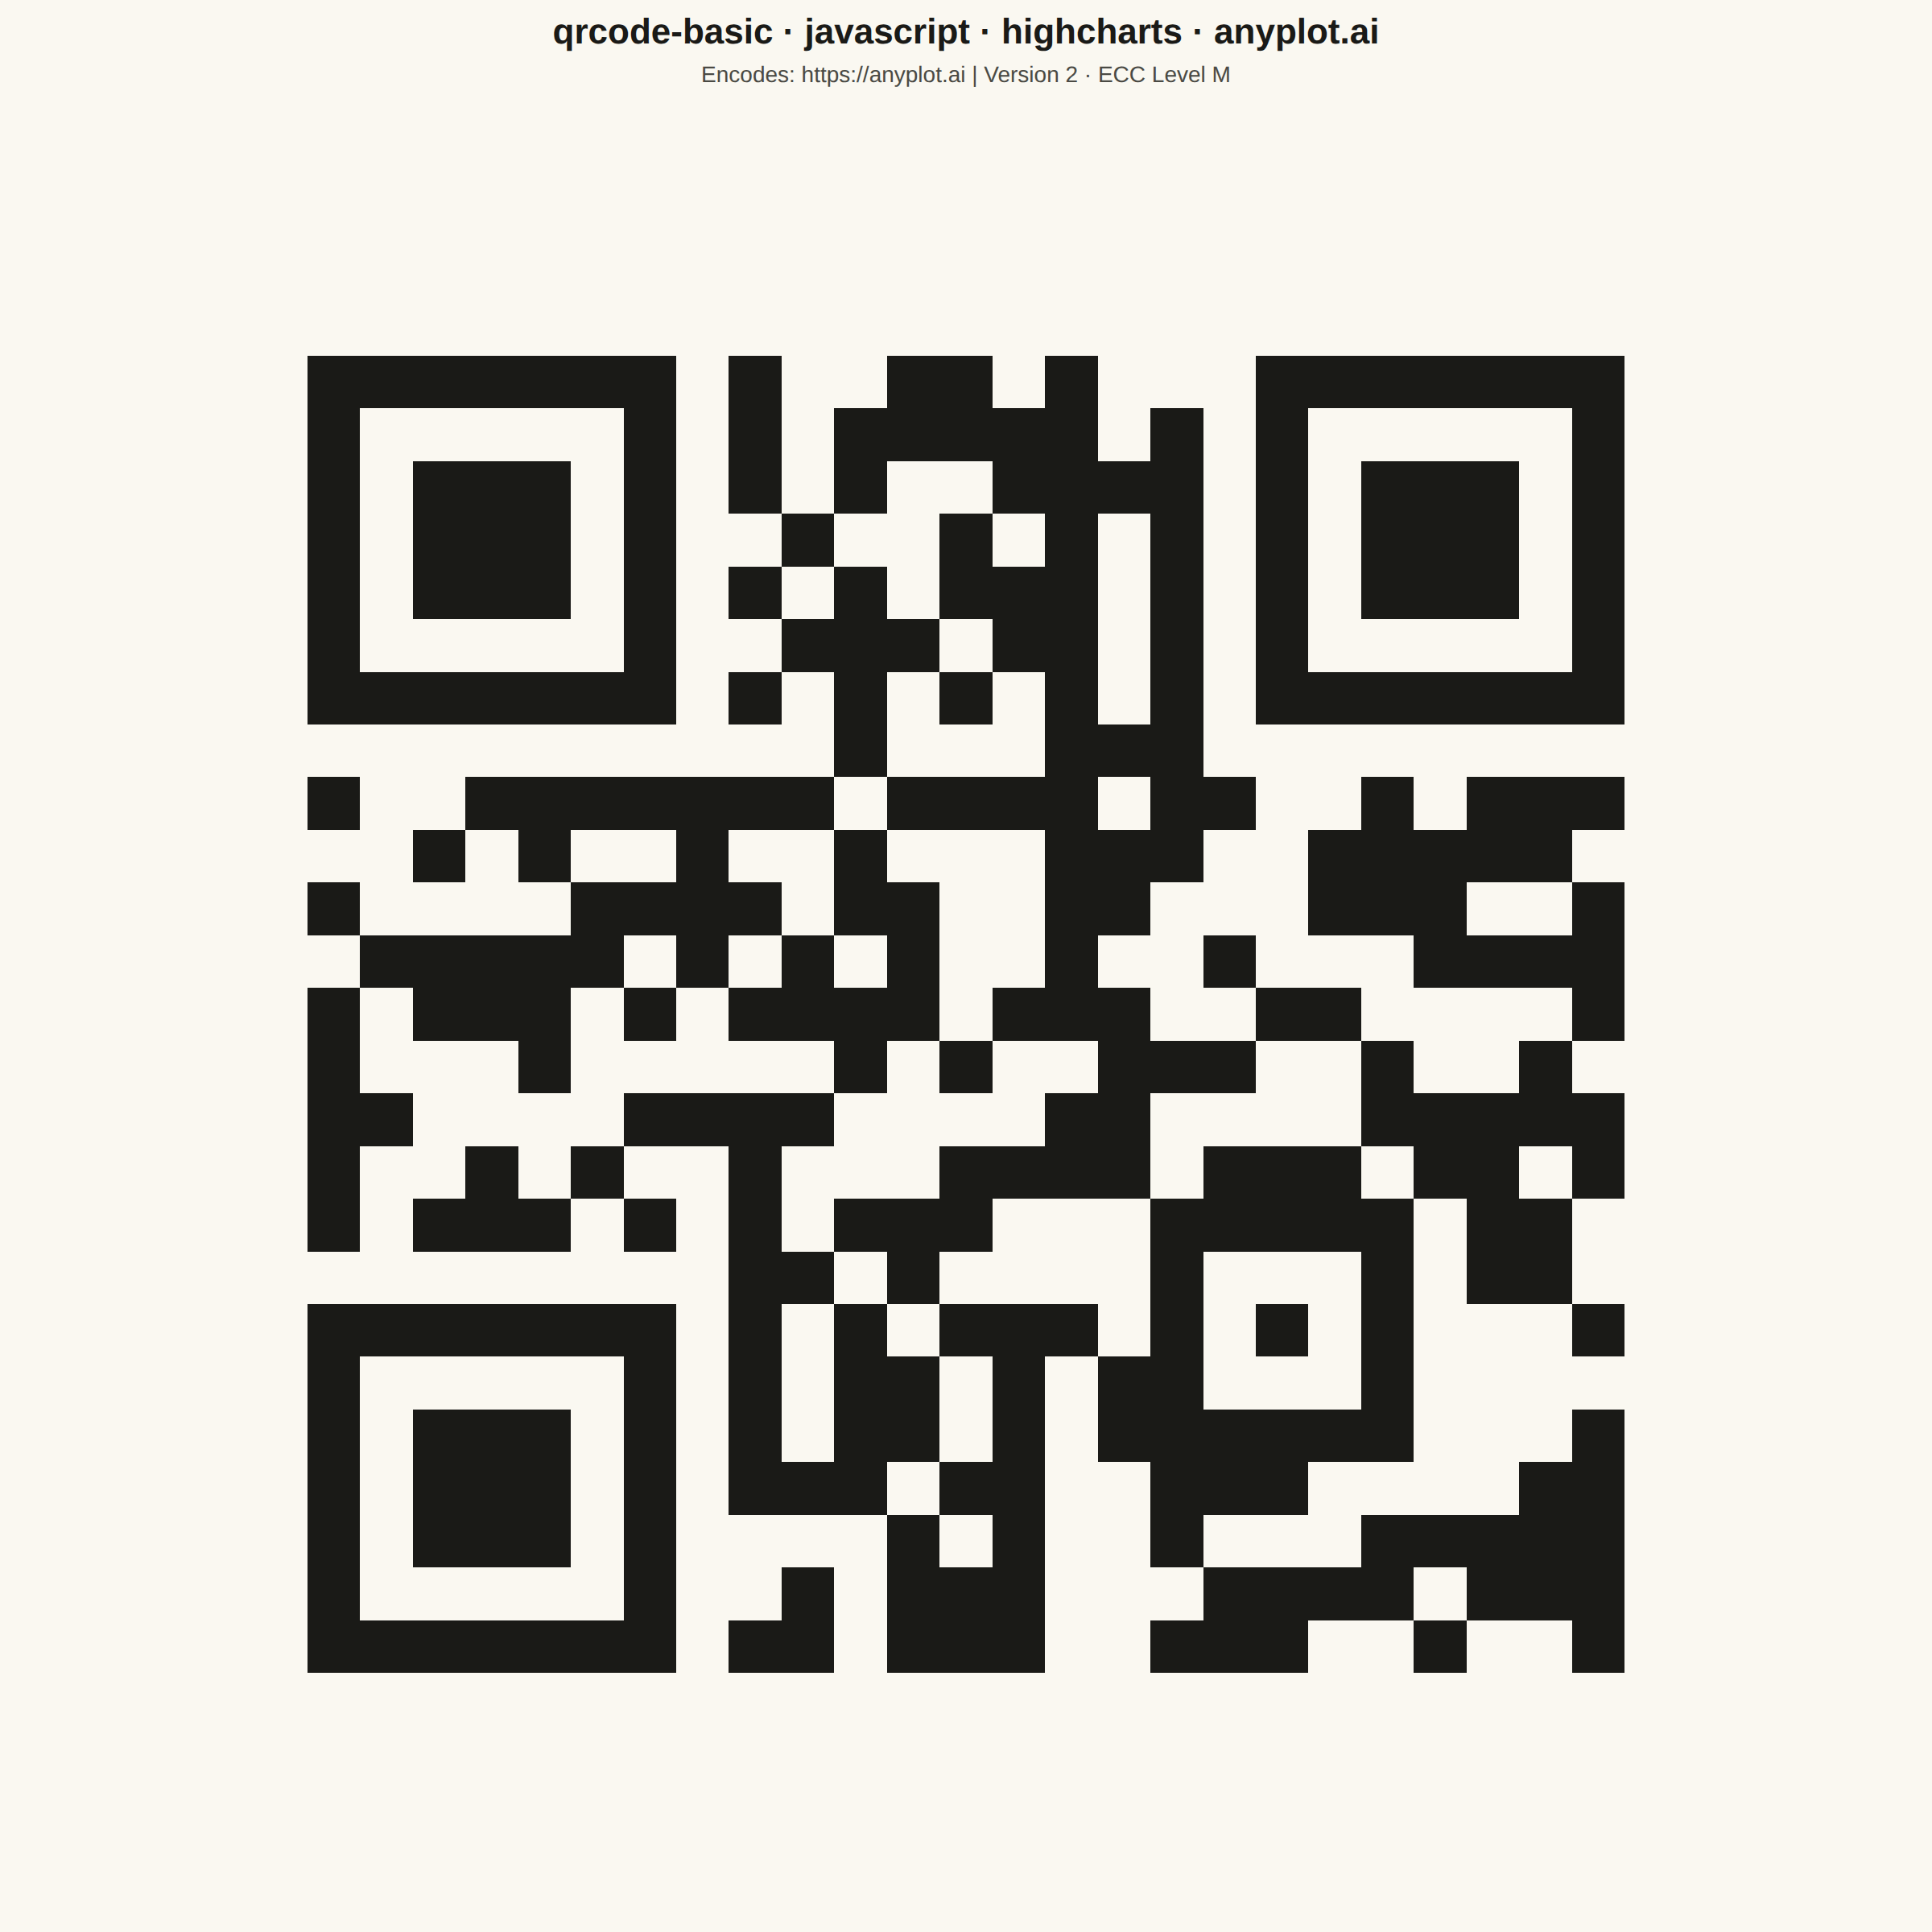
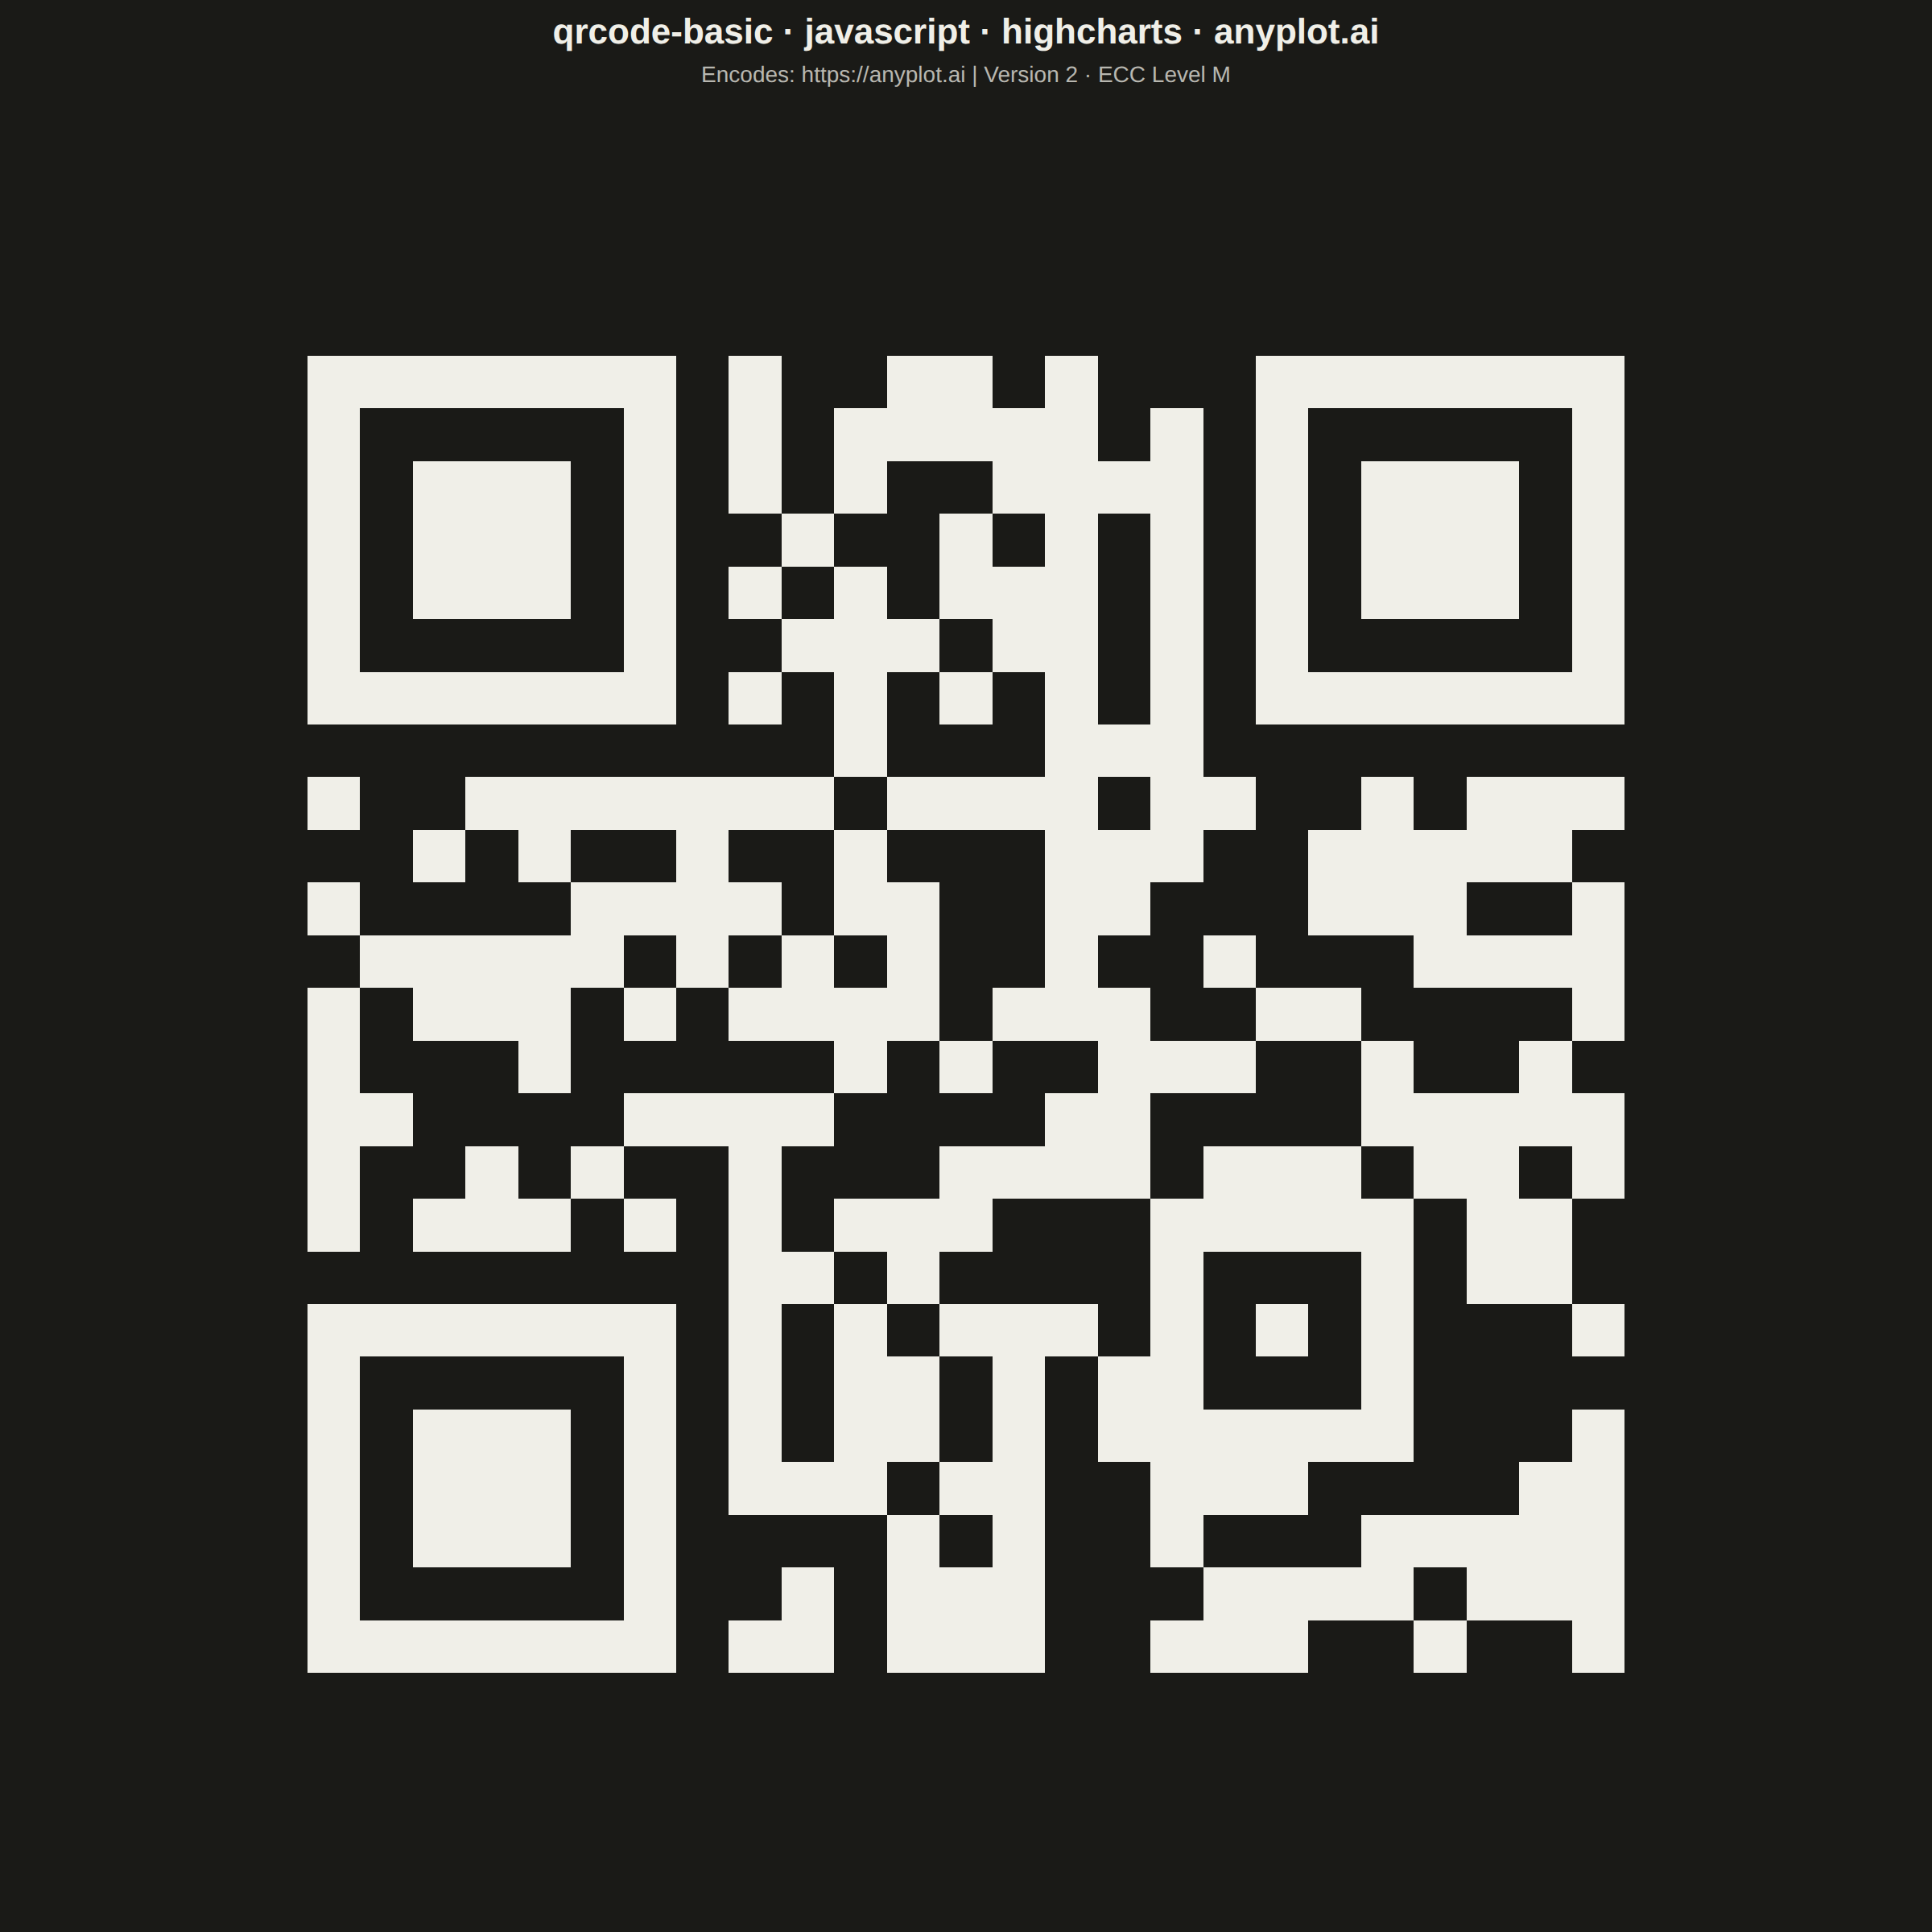
A QR (Quick Response) code visualization that encodes text or URL data into a square matrix barcode pattern. QR codes are two-dimensional barcodes that store information in a grid of black and white squares, readable by smartphones and dedicated scanners. This visualization is useful for generating scannable codes for quick data sharing and mobile access.
// anyplot.ai
// qrcode-basic: Basic QR Code Generator
// Library: highcharts 12.6.0 | JavaScript 22.23.0
// Quality: 89/100 | Created: 2026-06-24
//# anyplot-orientation: square

const t = window.ANYPLOT_TOKENS;

// Pre-computed QR matrix for "https://anyplot.ai"
// Version 2 (25×25 modules), Error Correction Level M
const QR_MATRIX = [
  [1,1,1,1,1,1,1,0,1,0,0,1,1,0,1,0,0,0,1,1,1,1,1,1,1],
  [1,0,0,0,0,0,1,0,1,0,1,1,1,1,1,0,1,0,1,0,0,0,0,0,1],
  [1,0,1,1,1,0,1,0,1,0,1,0,0,1,1,1,1,0,1,0,1,1,1,0,1],
  [1,0,1,1,1,0,1,0,0,1,0,0,1,0,1,0,1,0,1,0,1,1,1,0,1],
  [1,0,1,1,1,0,1,0,1,0,1,0,1,1,1,0,1,0,1,0,1,1,1,0,1],
  [1,0,0,0,0,0,1,0,0,1,1,1,0,1,1,0,1,0,1,0,0,0,0,0,1],
  [1,1,1,1,1,1,1,0,1,0,1,0,1,0,1,0,1,0,1,1,1,1,1,1,1],
  [0,0,0,0,0,0,0,0,0,0,1,0,0,0,1,1,1,0,0,0,0,0,0,0,0],
  [1,0,0,1,1,1,1,1,1,1,0,1,1,1,1,0,1,1,0,0,1,0,1,1,1],
  [0,0,1,0,1,0,0,1,0,0,1,0,0,0,1,1,1,0,0,1,1,1,1,1,0],
  [1,0,0,0,0,1,1,1,1,0,1,1,0,0,1,1,0,0,0,1,1,1,0,0,1],
  [0,1,1,1,1,1,0,1,0,1,0,1,0,0,1,0,0,1,0,0,0,1,1,1,1],
  [1,0,1,1,1,0,1,0,1,1,1,1,0,1,1,1,0,0,1,1,0,0,0,0,1],
  [1,0,0,0,1,0,0,0,0,0,1,0,1,0,0,1,1,1,0,0,1,0,0,1,0],
  [1,1,0,0,0,0,1,1,1,1,0,0,0,0,1,1,0,0,0,0,1,1,1,1,1],
  [1,0,0,1,0,1,0,0,1,0,0,0,1,1,1,1,0,1,1,1,0,1,1,0,1],
  [1,0,1,1,1,0,1,0,1,0,1,1,1,0,0,0,1,1,1,1,1,0,1,1,0],
  [0,0,0,0,0,0,0,0,1,1,0,1,0,0,0,0,1,0,0,0,1,0,1,1,0],
  [1,1,1,1,1,1,1,0,1,0,1,0,1,1,1,0,1,0,1,0,1,0,0,0,1],
  [1,0,0,0,0,0,1,0,1,0,1,1,0,1,0,1,1,0,0,0,1,0,0,0,0],
  [1,0,1,1,1,0,1,0,1,0,1,1,0,1,0,1,1,1,1,1,1,0,0,0,1],
  [1,0,1,1,1,0,1,0,1,1,1,0,1,1,0,0,1,1,1,0,0,0,0,1,1],
  [1,0,1,1,1,0,1,0,0,0,0,1,0,1,0,0,1,0,0,0,1,1,1,1,1],
  [1,0,0,0,0,0,1,0,0,1,0,1,1,1,0,0,0,1,1,1,1,0,1,1,1],
  [1,1,1,1,1,1,1,0,1,1,0,1,1,1,0,0,1,1,1,0,0,1,0,0,1],
];

// Title — scale font size for length
const TITLE = "qrcode-basic · javascript · highcharts · anyplot.ai";
const titleLen = TITLE.length;
const titleFontSize = titleLen > 67
  ? Math.max(Math.round(22 * 67 / titleLen), 14) + "px"
  : "22px";

// Encoded URL label
const ENCODED_URL = "https://anyplot.ai";

// Module colors: dark ink on cream (light) / near-white on near-black (dark)
const MODULE_COLOR = t.ink;       // dark (#1A1A17) on light / light (#F0EFE8) on dark
const QR_BG       = t.pageBg;    // cream (#FAF8F1) on light / near-black (#1A1A17) on dark

// Chart — square, transparent background, no axes
const chart = Highcharts.chart("container", {
  chart: {
    backgroundColor: "transparent",
    animation: false,
    style: { fontFamily: "inherit" },
    margin: [90, 60, 30, 60],
  },
  credits: { enabled: false },
  colors: t.palette,
  title: {
    text: TITLE,
    style: { color: t.ink, fontSize: titleFontSize, fontWeight: "600" },
    margin: 20,
  },
  subtitle: {
    text: "Encodes: " + ENCODED_URL + "  |  Version 2  ·  ECC Level M",
    style: { color: t.inkSoft, fontSize: "14px" },
  },
  xAxis: { visible: false },
  yAxis: { visible: false },
  legend: { enabled: false },
  plotOptions: { series: { animation: false } },
  series: [],
});

// Draw QR code using Highcharts SVG renderer
const qrSize    = QR_MATRIX.length;  // 25 modules
const quietZone = 4;                 // standard quiet zone
const totalMods = qrSize + 2 * quietZone; // 33

const plotW = chart.plotWidth;
const plotH = chart.plotHeight;

// Center a square QR area within the plot area
const qrAreaSize = Math.min(plotW, plotH);
const offsetX = chart.plotLeft + (plotW - qrAreaSize) / 2;
const offsetY = chart.plotTop  + (plotH - qrAreaSize) / 2;

const cellSize = qrAreaSize / totalMods;

// White quiet zone background
chart.renderer.rect(offsetX, offsetY, qrAreaSize, qrAreaSize)
  .attr({ fill: QR_BG, zIndex: 3, 'shape-rendering': 'crispEdges' })
  .add();

// Black QR modules
for (let row = 0; row < qrSize; row++) {
  for (let col = 0; col < qrSize; col++) {
    if (QR_MATRIX[row][col]) {
      chart.renderer.rect(
        offsetX + (col + quietZone) * cellSize,
        offsetY + (row + quietZone) * cellSize,
        cellSize,
        cellSize
      ).attr({ fill: MODULE_COLOR, zIndex: 4, 'shape-rendering': 'crispEdges' }).add();
    }
  }
}
Runnable source as JSON, for any HTTP client: https://api.anyplot.ai/specs/qrcode-basic/highcharts/code. Any spec id and library id listed in llms-full.txt fit the same URL shape; every URL below is complete and callable.
{
  "spec_id": "qrcode-basic",
  "language": "javascript",
  "library": "highcharts",
  "page": "https://anyplot.ai/qrcode-basic/javascript/highcharts",
  "hub": "https://anyplot.ai/qrcode-basic",
  "code_json": "https://api.anyplot.ai/specs/qrcode-basic/highcharts/code",
  "spec_json": "https://api.anyplot.ai/specs/qrcode-basic",
  "render_light_png": "https://storage.googleapis.com/anyplot-images/plots/qrcode-basic/javascript/highcharts/plot-light.png",
  "render_dark_png": "https://storage.googleapis.com/anyplot-images/plots/qrcode-basic/javascript/highcharts/plot-dark.png",
  "interactive_light_html": "https://storage.googleapis.com/anyplot-images/plots/qrcode-basic/javascript/highcharts/plot-light.html",
  "interactive_dark_html": "https://storage.googleapis.com/anyplot-images/plots/qrcode-basic/javascript/highcharts/plot-dark.html",
  "quality_score": 89.0,
  "license": "MIT",
  "guide": "https://anyplot.ai/llms.txt"
}
Part of Basic QR Code Generator on anyplot.ai.