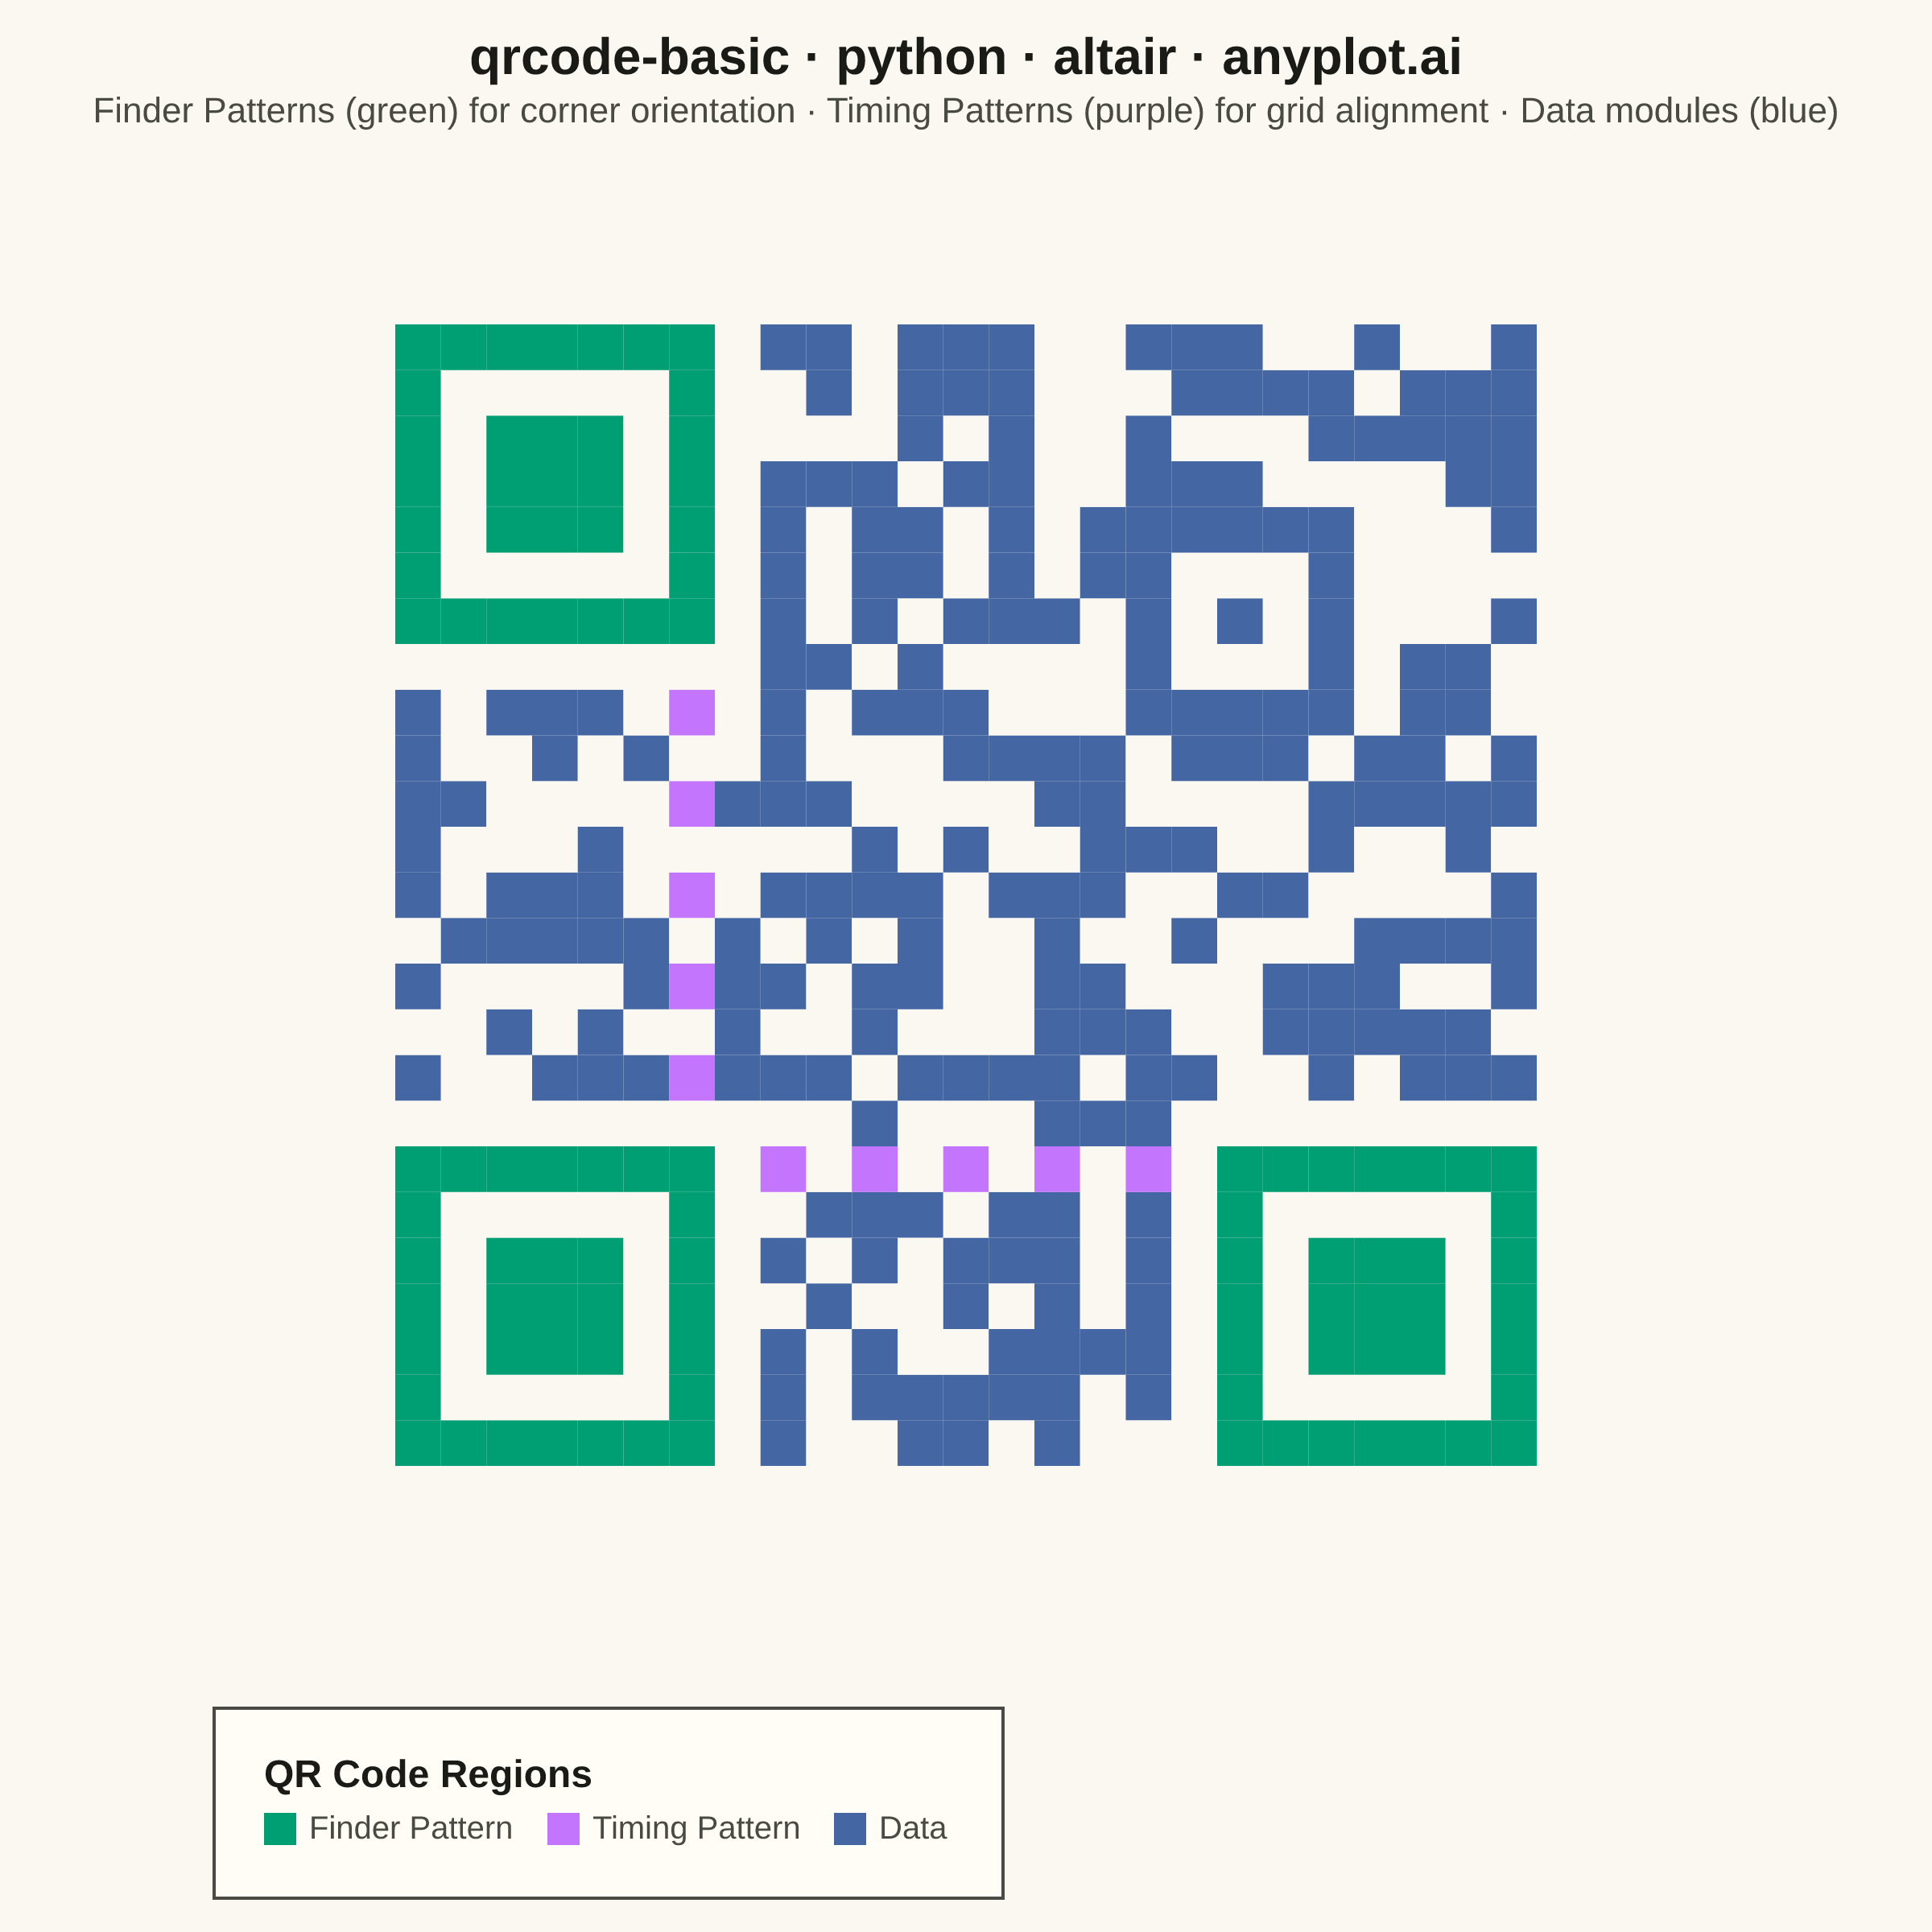
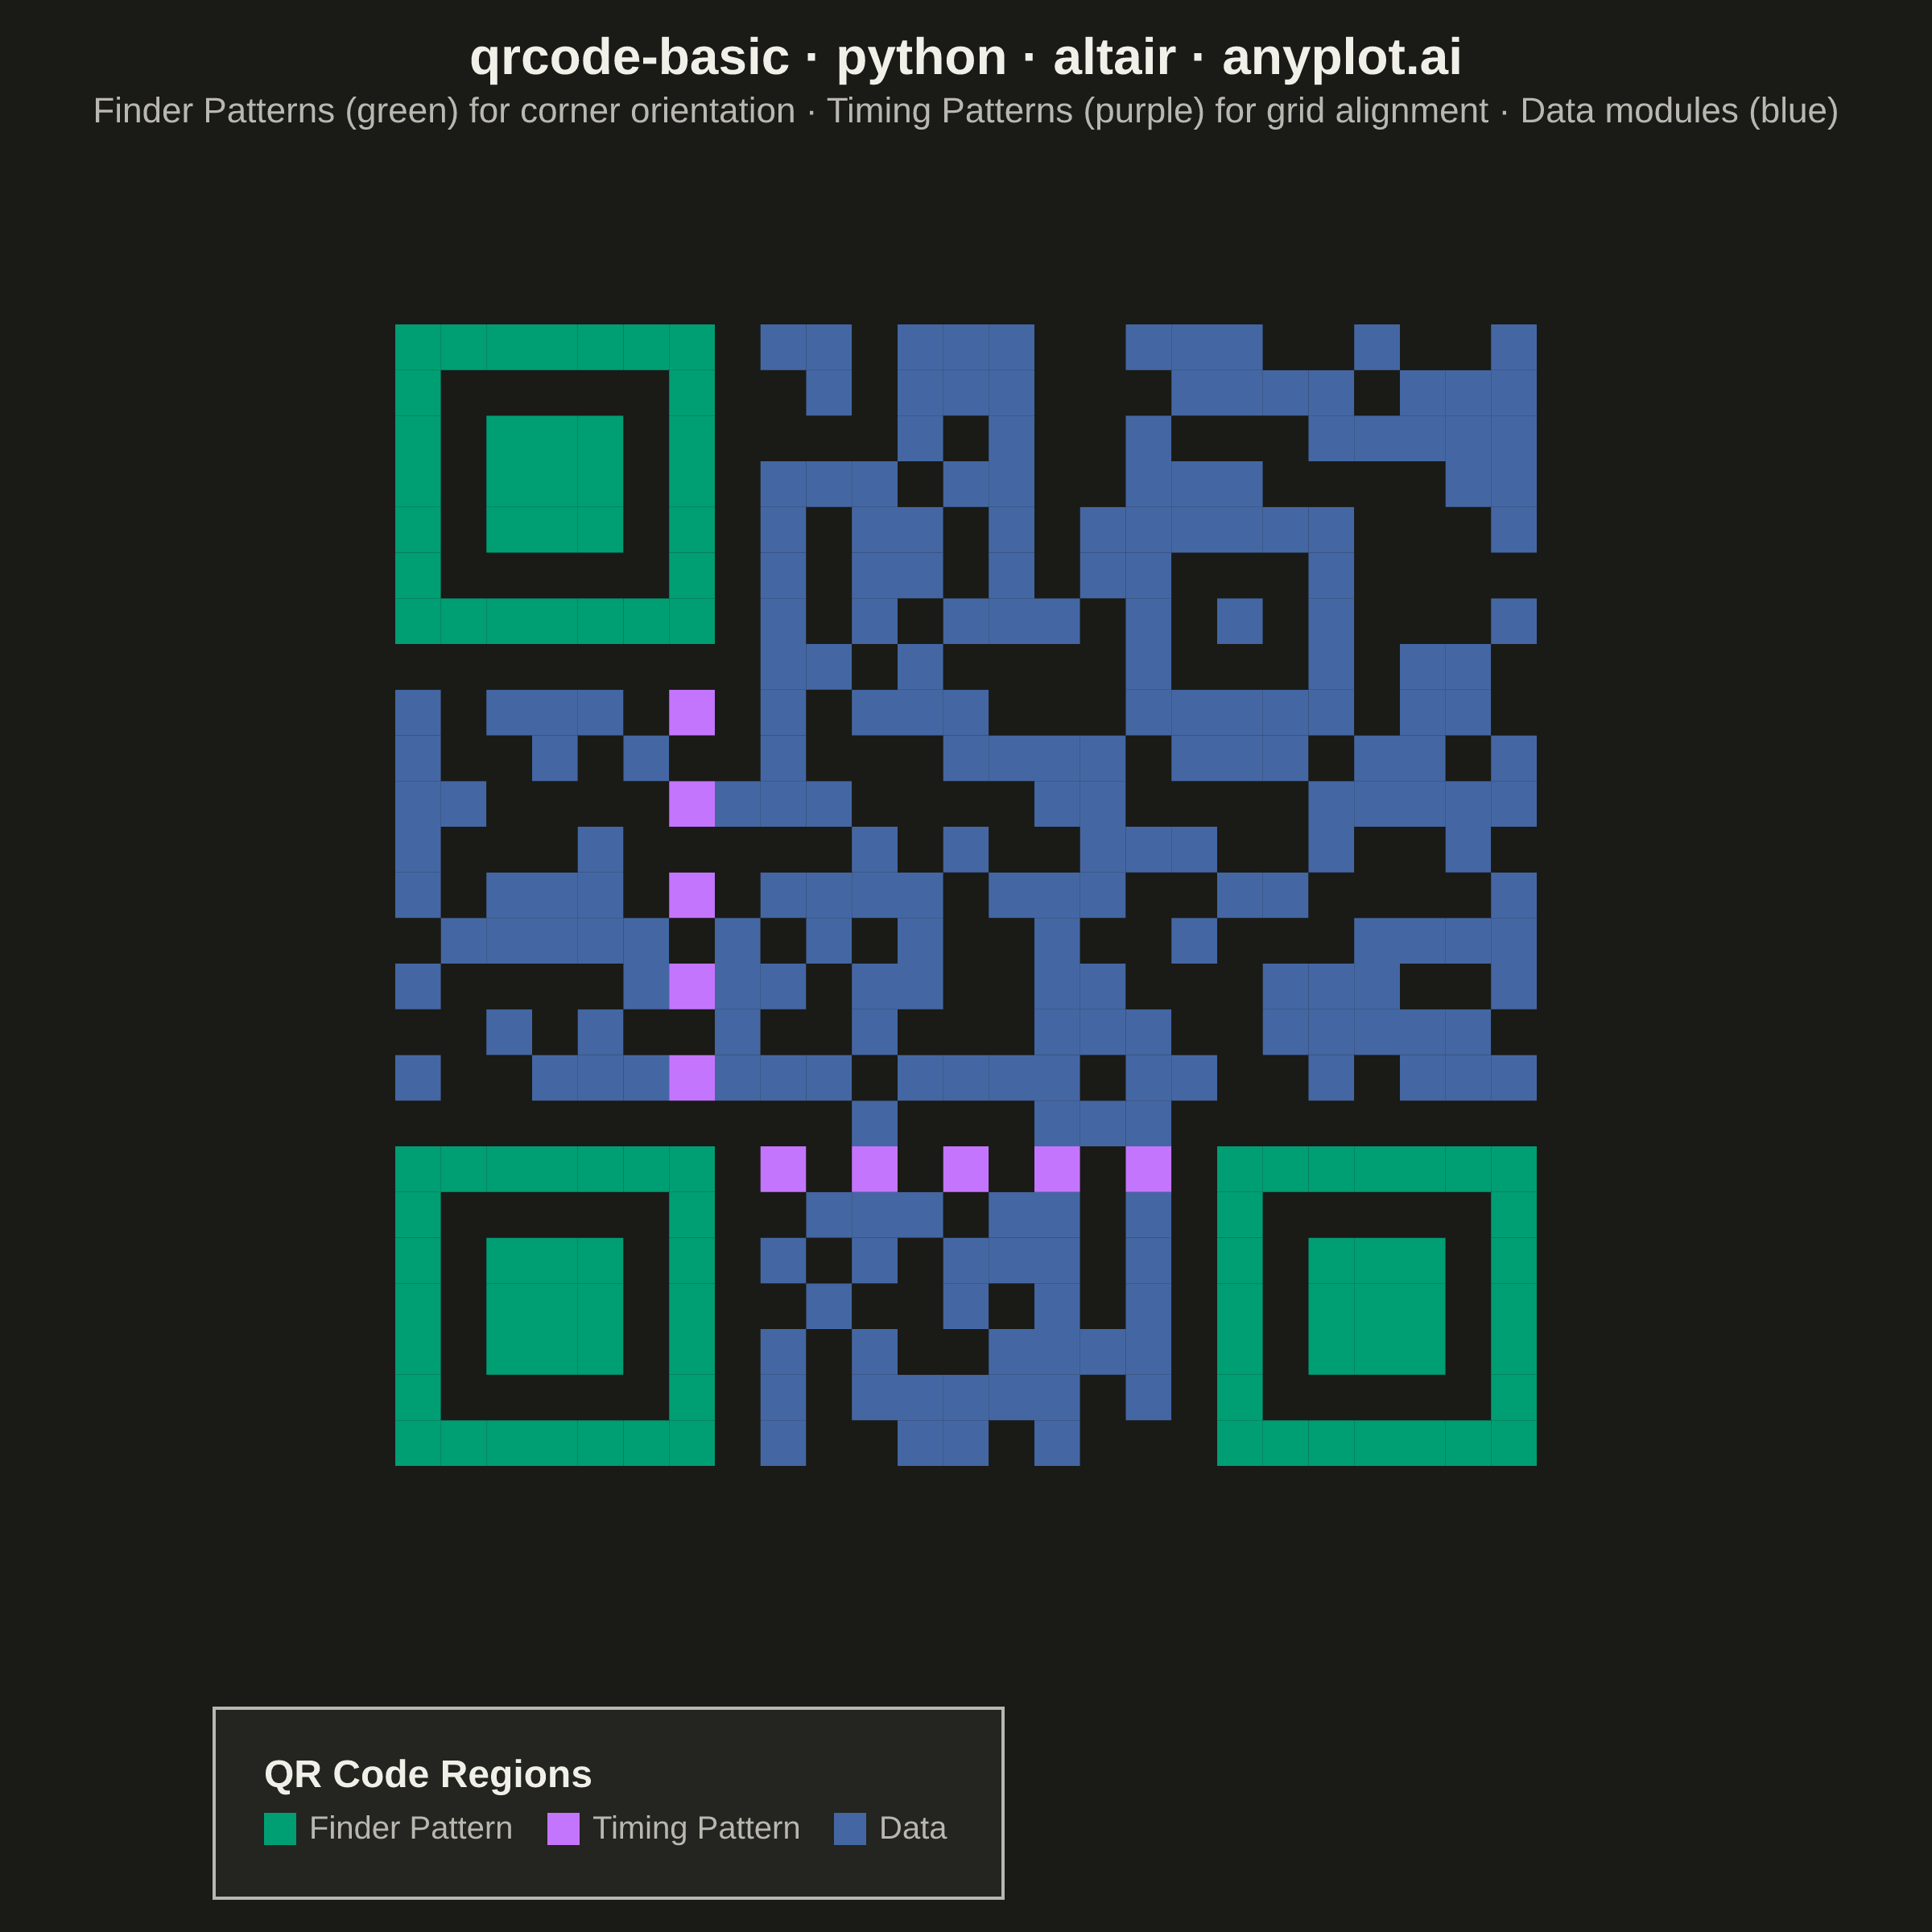
A QR (Quick Response) code visualization that encodes text or URL data into a square matrix barcode pattern. QR codes are two-dimensional barcodes that store information in a grid of black and white squares, readable by smartphones and dedicated scanners. This visualization is useful for generating scannable codes for quick data sharing and mobile access.
""" anyplot.ai
qrcode-basic: Basic QR Code Generator
Library: altair 6.2.2 | Python 3.13.14
Quality: 87/100 | Updated: 2026-06-24
"""

import os
import sys


# Remove script directory from sys.path to avoid importing local altair.py
_script_dir = os.path.dirname(os.path.abspath(__file__))
if _script_dir in sys.path:
    sys.path.remove(_script_dir)

import altair as alt
import numpy as np
import pandas as pd
import qrcode
from PIL import Image


# Theme tokens (Imprint palette)
THEME = os.getenv("ANYPLOT_THEME", "light")
PAGE_BG = "#FAF8F1" if THEME == "light" else "#1A1A17"
ELEVATED_BG = "#FFFDF6" if THEME == "light" else "#242420"
INK = "#1A1A17" if THEME == "light" else "#F0EFE8"
INK_SOFT = "#4A4A44" if THEME == "light" else "#B8B7B0"

# Imprint categorical palette — structurally distinct region colors
FINDER_COLOR = "#009E73"  # Imprint 1 (green)  — corner orientation markers
TIMING_COLOR = "#C475FD"  # Imprint 2 (purple) — row/column timing strips
DATA_COLOR = "#4467A3"  # Imprint 3 (blue)   — encoded data modules

# Data — real, scannable QR code encoding anyplot.ai
content = "https://anyplot.ai"

qr = qrcode.QRCode(version=1, error_correction=qrcode.constants.ERROR_CORRECT_M, box_size=1, border=0)
qr.add_data(content)
qr.make(fit=True)

qr_matrix = np.array(qr.get_matrix(), dtype=int)
quiet_zone = 4
padded = np.zeros((qr_matrix.shape[0] + 2 * quiet_zone, qr_matrix.shape[1] + 2 * quiet_zone), dtype=int)
padded[quiet_zone : quiet_zone + qr_matrix.shape[0], quiet_zone : quiet_zone + qr_matrix.shape[1]] = qr_matrix
total_size = padded.shape[0]

# Build DataFrame with structural region classification
rows, cols = np.where(np.ones_like(padded, dtype=bool))
records = []
for r, c in zip(rows, cols, strict=True):
    qr_r, qr_c = r - quiet_zone, c - quiet_zone
    if qr_r < 0 or qr_r >= qr_matrix.shape[0] or qr_c < 0 or qr_c >= qr_matrix.shape[1]:
        region = "Quiet Zone"
    elif (
        (qr_r < 7 and qr_c < 7)
        or (qr_r < 7 and qr_c >= qr_matrix.shape[1] - 7)
        or (qr_r >= qr_matrix.shape[0] - 7 and qr_c < 7)
    ):
        region = "Finder Pattern"
    elif qr_r == 6 or qr_c == 6:
        region = "Timing Pattern"
    else:
        region = "Data"
    val = padded[r, c]
    display_region = region if val == 1 else "Background"
    records.append({"x": c, "y": total_size - 1 - r, "value": val, "region": region, "display": display_region})

data = pd.DataFrame(records)

# Color mapping: dark modules use Imprint palette; background cells use PAGE_BG
display_domain = ["Finder Pattern", "Timing Pattern", "Data", "Background"]
display_colors = [FINDER_COLOR, TIMING_COLOR, DATA_COLOR, PAGE_BG]

# Plot — QR code with color-annotated structural regions
chart = (
    alt.Chart(data)
    .mark_rect(stroke=None, strokeWidth=0)
    .encode(
        x=alt.X("x:O", axis=None),
        y=alt.Y("y:O", axis=None),
        color=alt.Color(
            "display:N",
            scale=alt.Scale(domain=display_domain, range=display_colors),
            legend=alt.Legend(
                title="QR Code Regions",
                titleFontSize=12,
                labelFontSize=10,
                orient="bottom",
                direction="horizontal",
                values=["Finder Pattern", "Timing Pattern", "Data"],
            ),
        ),
        tooltip=[
            alt.Tooltip("region:N", title="Region"),
            alt.Tooltip("x:O", title="Col"),
            alt.Tooltip("y:O", title="Row"),
        ],
    )
    .properties(
        width=468,
        height=468,
        background=PAGE_BG,
        title=alt.Title(
            "qrcode-basic · python · altair · anyplot.ai",
            subtitle="Finder Patterns (green) for corner orientation · Timing Patterns (purple) for grid alignment · Data modules (blue)",
            fontSize=16,
            subtitleFontSize=11,
            subtitleColor=INK_SOFT,
            color=INK,
            anchor="middle",
        ),
    )
    .configure_view(strokeWidth=0, fill=PAGE_BG)
    .configure_axis(grid=False)
    .configure_legend(
        fillColor=ELEVATED_BG,
        strokeColor=INK_SOFT,
        symbolStrokeWidth=0,
        padding=16,
        labelColor=INK_SOFT,
        titleColor=INK,
    )
)

# Save — square canvas 2400×2400; pad if vl-convert undershoots
TW, TH = 2400, 2400
chart.save(f"plot-{THEME}.png", scale_factor=4.0)

_img = Image.open(f"plot-{THEME}.png").convert("RGB")
_w, _h = _img.size
if _w > TW or _h > TH:
    raise SystemExit(
        f"altair vl-convert produced {_w}×{_h}, exceeds target {TW}×{TH}. "
        f"Shrink chart .properties(width=, height=) values and re-render."
    )
if _w < TW or _h < TH:
    _canvas = Image.new("RGB", (TW, TH), PAGE_BG)
    _canvas.paste(_img, ((TW - _w) // 2, (TH - _h) // 2))
    _canvas.save(f"plot-{THEME}.png")

chart.save(f"plot-{THEME}.html")
Runnable source as JSON, for any HTTP client: https://api.anyplot.ai/specs/qrcode-basic/altair/code. Any spec id and library id listed in llms-full.txt fit the same URL shape; every URL below is complete and callable.
{
  "spec_id": "qrcode-basic",
  "language": "python",
  "library": "altair",
  "page": "https://anyplot.ai/qrcode-basic/python/altair",
  "hub": "https://anyplot.ai/qrcode-basic",
  "code_json": "https://api.anyplot.ai/specs/qrcode-basic/altair/code",
  "spec_json": "https://api.anyplot.ai/specs/qrcode-basic",
  "render_light_png": "https://storage.googleapis.com/anyplot-images/plots/qrcode-basic/python/altair/plot-light.png",
  "render_dark_png": "https://storage.googleapis.com/anyplot-images/plots/qrcode-basic/python/altair/plot-dark.png",
  "interactive_light_html": "https://storage.googleapis.com/anyplot-images/plots/qrcode-basic/python/altair/plot-light.html",
  "interactive_dark_html": "https://storage.googleapis.com/anyplot-images/plots/qrcode-basic/python/altair/plot-dark.html",
  "quality_score": 87.0,
  "license": "MIT",
  "guide": "https://anyplot.ai/llms.txt"
}
Part of Basic QR Code Generator on anyplot.ai.