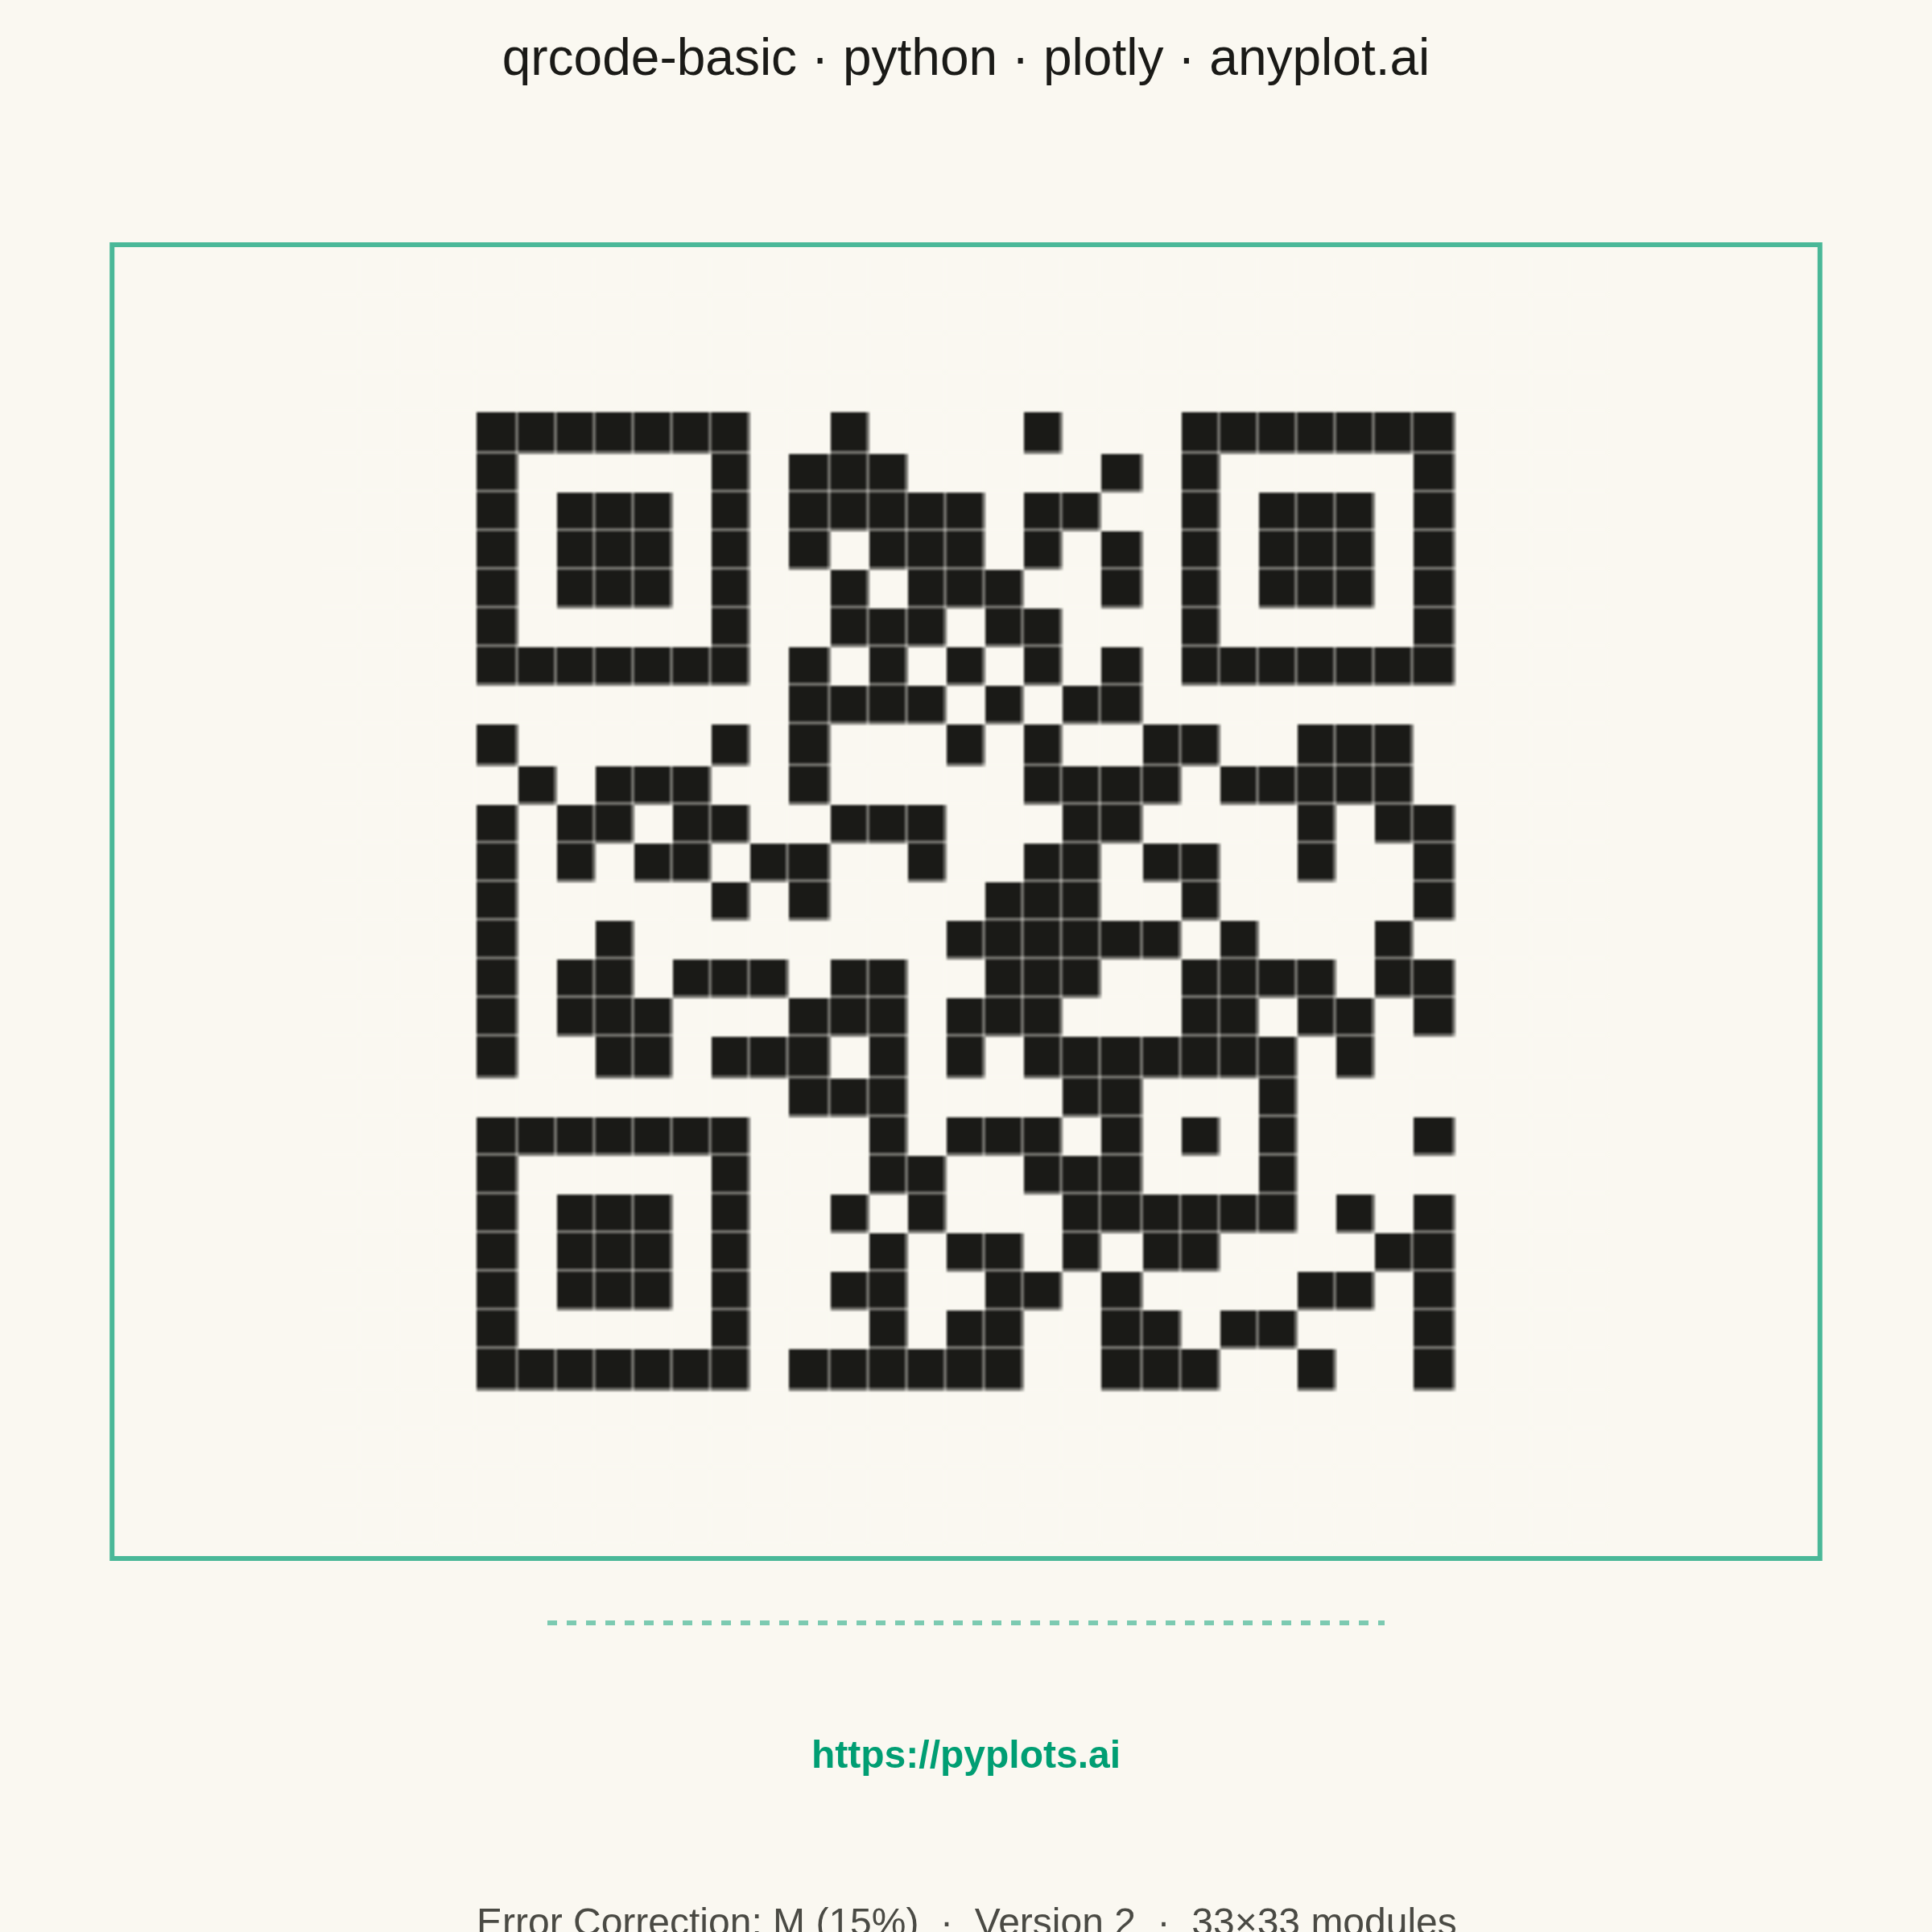
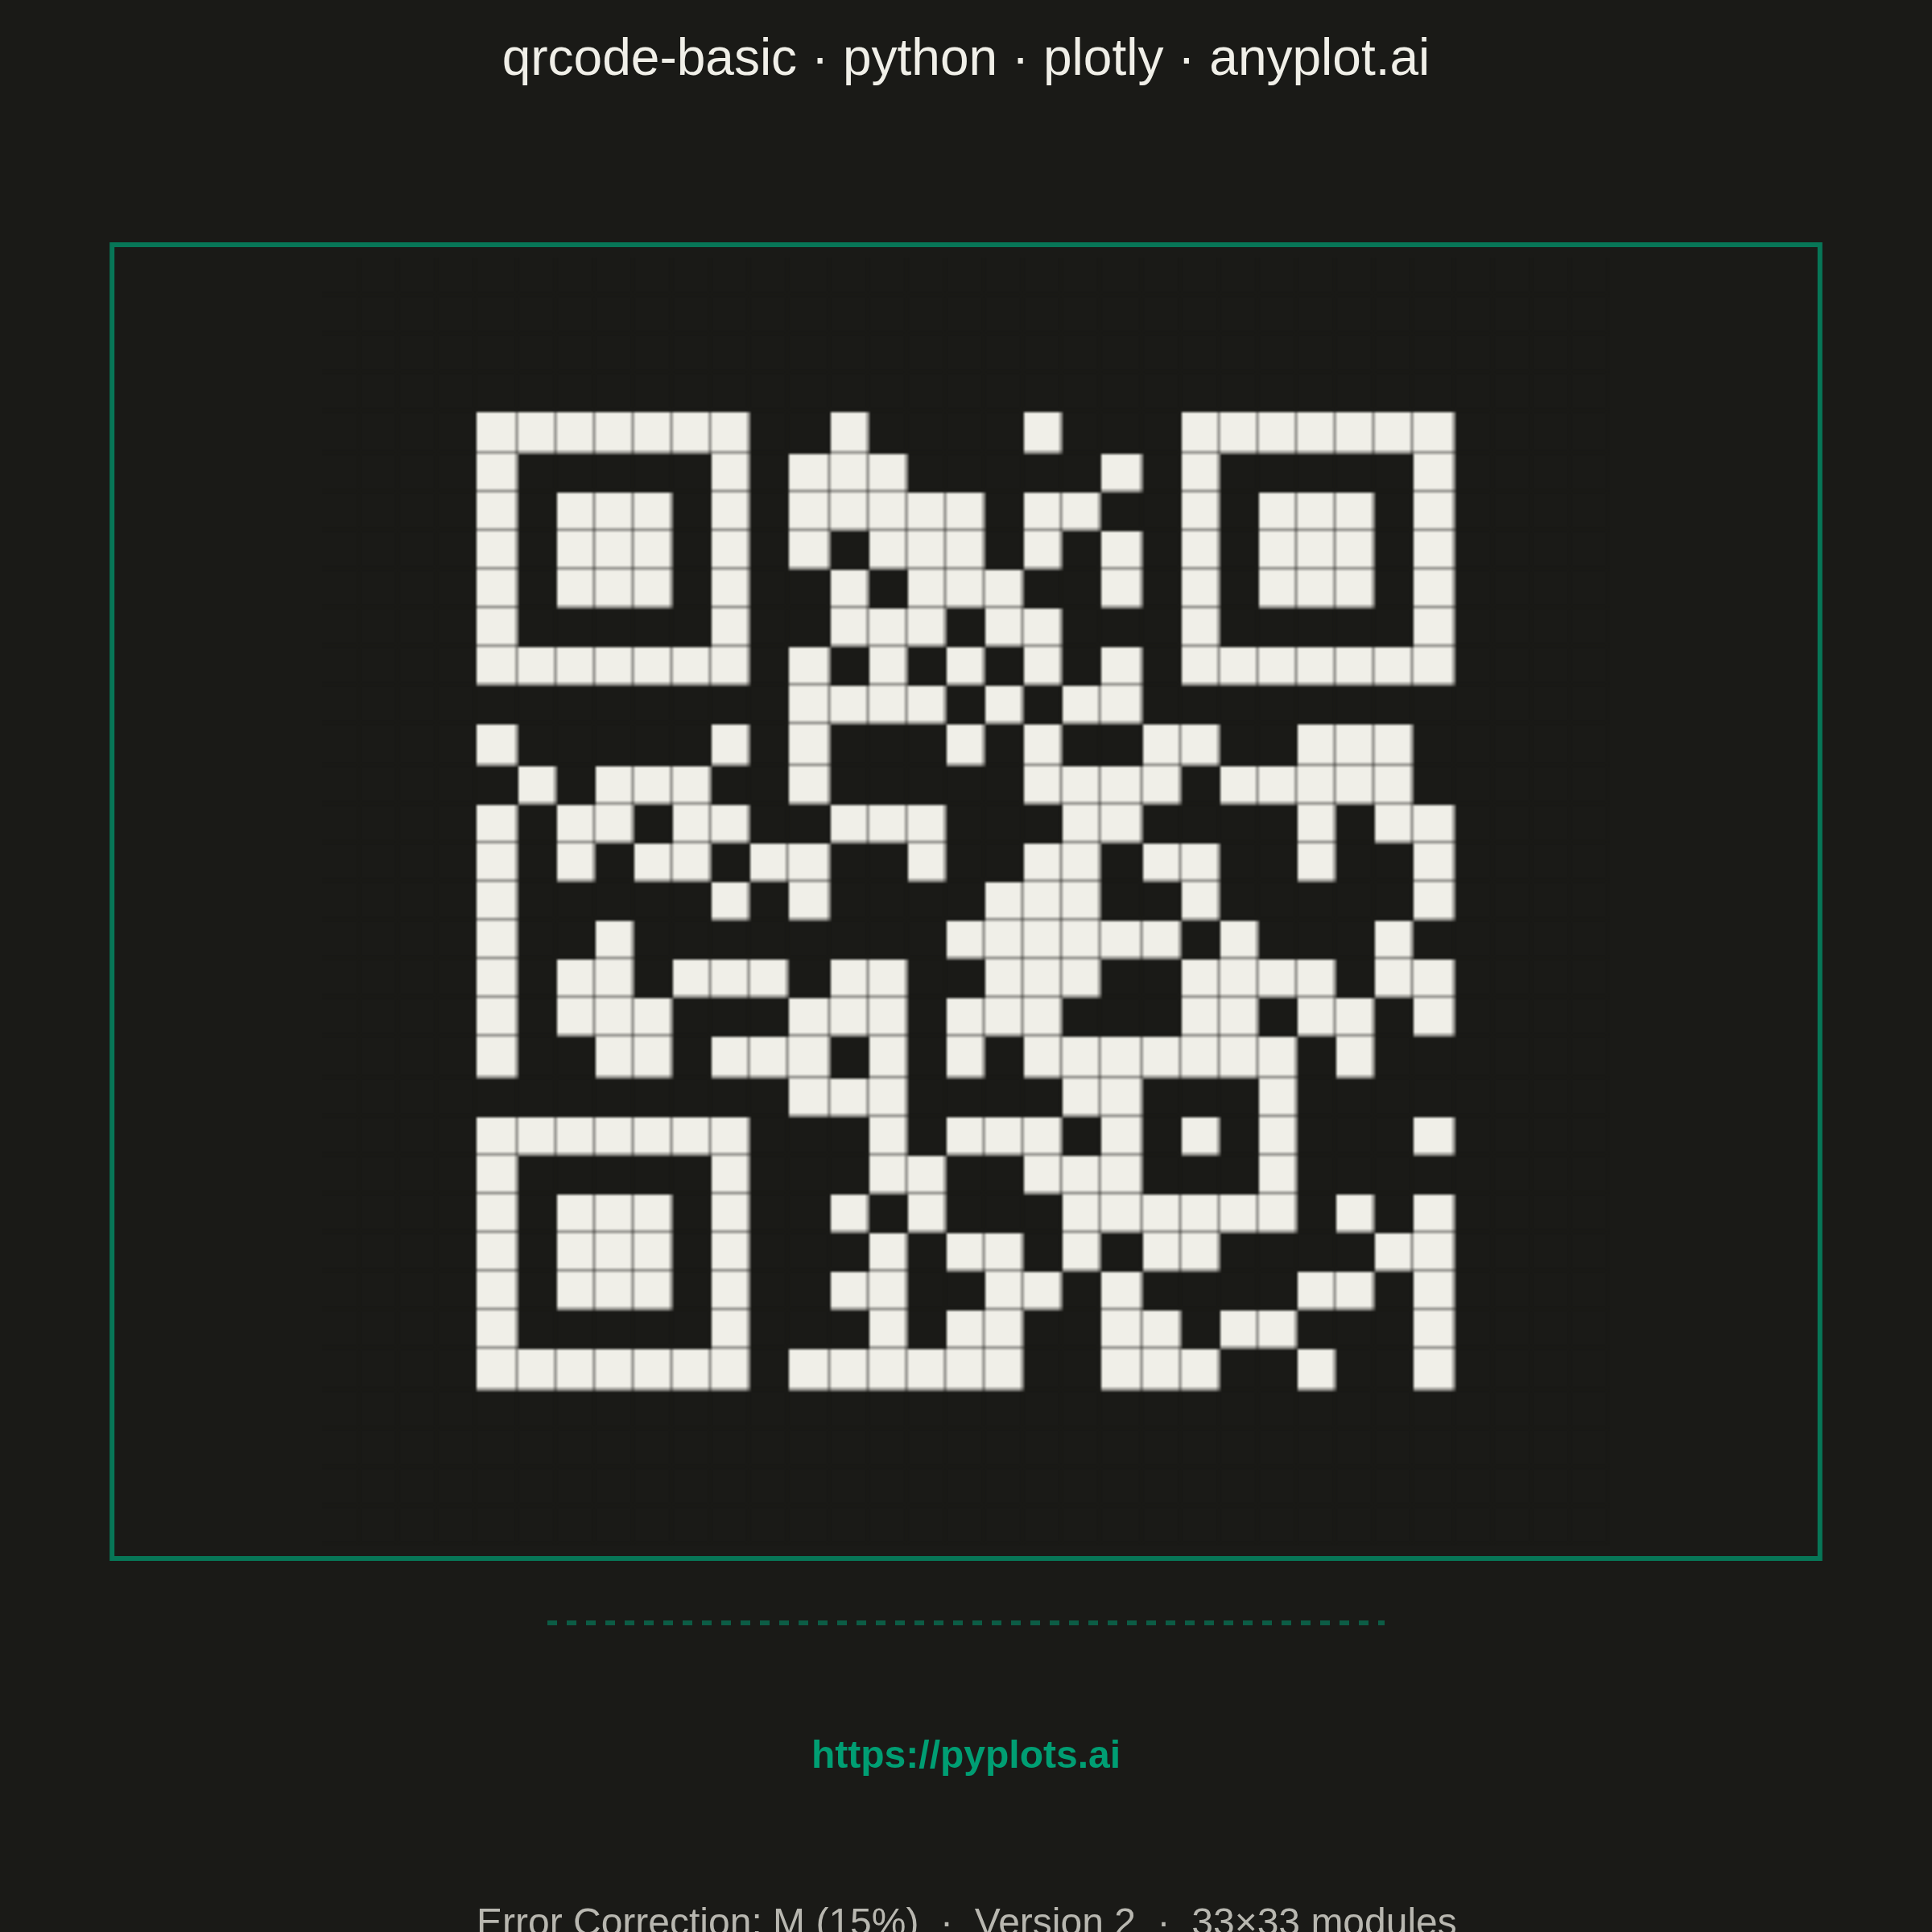
A QR (Quick Response) code visualization that encodes text or URL data into a square matrix barcode pattern. QR codes are two-dimensional barcodes that store information in a grid of black and white squares, readable by smartphones and dedicated scanners. This visualization is useful for generating scannable codes for quick data sharing and mobile access.
""" anyplot.ai
qrcode-basic: Basic QR Code Generator
Library: plotly 6.8.0 | Python 3.13.14
Quality: 88/100 | Updated: 2026-06-24
"""

import os
import sys


# Remove this script's directory from sys.path so `import plotly` finds the
# installed package rather than this file itself (plotly.py would shadow it).
_here = os.path.dirname(os.path.abspath(__file__))
sys.path = [p for p in sys.path if os.path.abspath(p) != _here]

import numpy as np
import plotly.graph_objects as go
import qrcode


# Theme-adaptive chrome tokens (Imprint palette)
THEME = os.getenv("ANYPLOT_THEME", "light")
PAGE_BG = "#FAF8F1" if THEME == "light" else "#1A1A17"
ELEVATED_BG = "#FFFDF6" if THEME == "light" else "#242420"
INK = "#1A1A17" if THEME == "light" else "#F0EFE8"
INK_SOFT = "#4A4A44" if THEME == "light" else "#B8B7B0"

# Imprint palette position 1 — brand green accent for chrome
ACCENT = "#009E73"

# QR code modules: ink on page background for maximum contrast + theme consistency
MODULE_DARK = INK
MODULE_LIGHT = PAGE_BG

# Data — generate QR code for pyplots.ai
content = "https://pyplots.ai"
qr = qrcode.QRCode(version=None, error_correction=qrcode.constants.ERROR_CORRECT_M, box_size=1, border=4)
qr.add_data(content)
qr.make(fit=True)
qr_matrix = np.array(qr.get_matrix(), dtype=int)
n_modules = qr_matrix.shape[0]

# Plot — render as heatmap with theme-adaptive colorscale
fig = go.Figure(
    data=go.Heatmap(
        z=qr_matrix,
        colorscale=[[0, MODULE_LIGHT], [1, MODULE_DARK]],
        showscale=False,
        xgap=0.4,
        ygap=0.4,
        hovertemplate="Module: (%{x}, %{y})<extra></extra>",
    )
)

fig.update_layout(
    autosize=False,
    paper_bgcolor=PAGE_BG,
    plot_bgcolor=PAGE_BG,
    font={"color": INK},
    title={
        "text": "qrcode-basic · python · plotly · anyplot.ai",
        "font": {"size": 16, "color": INK, "family": "Arial Black, sans-serif"},
        "x": 0.5,
        "xanchor": "center",
        "y": 0.98,
    },
    xaxis={
        "showticklabels": False,
        "showgrid": False,
        "zeroline": False,
        "scaleanchor": "y",
        "scaleratio": 1,
        "constrain": "domain",
        "showline": False,
        "range": [-0.5, n_modules - 0.5],
    },
    yaxis={
        "showticklabels": False,
        "showgrid": False,
        "zeroline": False,
        "autorange": "reversed",
        "constrain": "domain",
        "showline": False,
        "range": [-0.5, n_modules - 0.5],
    },
    margin={"l": 40, "r": 40, "t": 80, "b": 130},
)

# Accent border framing the QR code area
fig.add_shape(
    type="rect",
    xref="paper",
    yref="paper",
    x0=-0.01,
    y0=-0.01,
    x1=1.01,
    y1=1.01,
    line={"color": ACCENT, "width": 1.5},
    fillcolor="rgba(0,0,0,0)",
    opacity=0.7,
)

# Dotted divider between QR code and annotation area
fig.add_shape(
    type="line",
    xref="paper",
    yref="paper",
    x0=0.25,
    y0=-0.06,
    x1=0.75,
    y1=-0.06,
    line={"color": ACCENT, "width": 1.5, "dash": "dot"},
    opacity=0.5,
)

# Encoded URL — prominent, just below the divider
fig.add_annotation(
    text=f"<b>{content}</b>",
    xref="paper",
    yref="paper",
    x=0.5,
    y=-0.14,
    showarrow=False,
    font={"size": 12, "color": ACCENT, "family": "Arial, sans-serif"},
    xanchor="center",
    yanchor="top",
)

# QR code metadata — version, error correction, module count
fig.add_annotation(
    text=f"Error Correction: M (15%)  ·  Version {qr.version}  ·  {n_modules}×{n_modules} modules",
    xref="paper",
    yref="paper",
    x=0.5,
    y=-0.27,
    showarrow=False,
    font={"size": 12, "color": INK_SOFT, "family": "Arial, sans-serif"},
    xanchor="center",
    yanchor="top",
)

# Save — square canvas: 600×600 logical → 2400×2400 px at scale=4
fig.write_image(f"plot-{THEME}.png", width=600, height=600, scale=4)
fig.write_html(f"plot-{THEME}.html", include_plotlyjs="cdn")
Runnable source as JSON, for any HTTP client: https://api.anyplot.ai/specs/qrcode-basic/plotly/code. Any spec id and library id listed in llms-full.txt fit the same URL shape; every URL below is complete and callable.
{
  "spec_id": "qrcode-basic",
  "language": "python",
  "library": "plotly",
  "page": "https://anyplot.ai/qrcode-basic/python/plotly",
  "hub": "https://anyplot.ai/qrcode-basic",
  "code_json": "https://api.anyplot.ai/specs/qrcode-basic/plotly/code",
  "spec_json": "https://api.anyplot.ai/specs/qrcode-basic",
  "render_light_png": "https://storage.googleapis.com/anyplot-images/plots/qrcode-basic/python/plotly/plot-light.png",
  "render_dark_png": "https://storage.googleapis.com/anyplot-images/plots/qrcode-basic/python/plotly/plot-dark.png",
  "interactive_light_html": "https://storage.googleapis.com/anyplot-images/plots/qrcode-basic/python/plotly/plot-light.html",
  "interactive_dark_html": "https://storage.googleapis.com/anyplot-images/plots/qrcode-basic/python/plotly/plot-dark.html",
  "quality_score": 88.0,
  "license": "MIT",
  "guide": "https://anyplot.ai/llms.txt"
}
Part of Basic QR Code Generator on anyplot.ai.