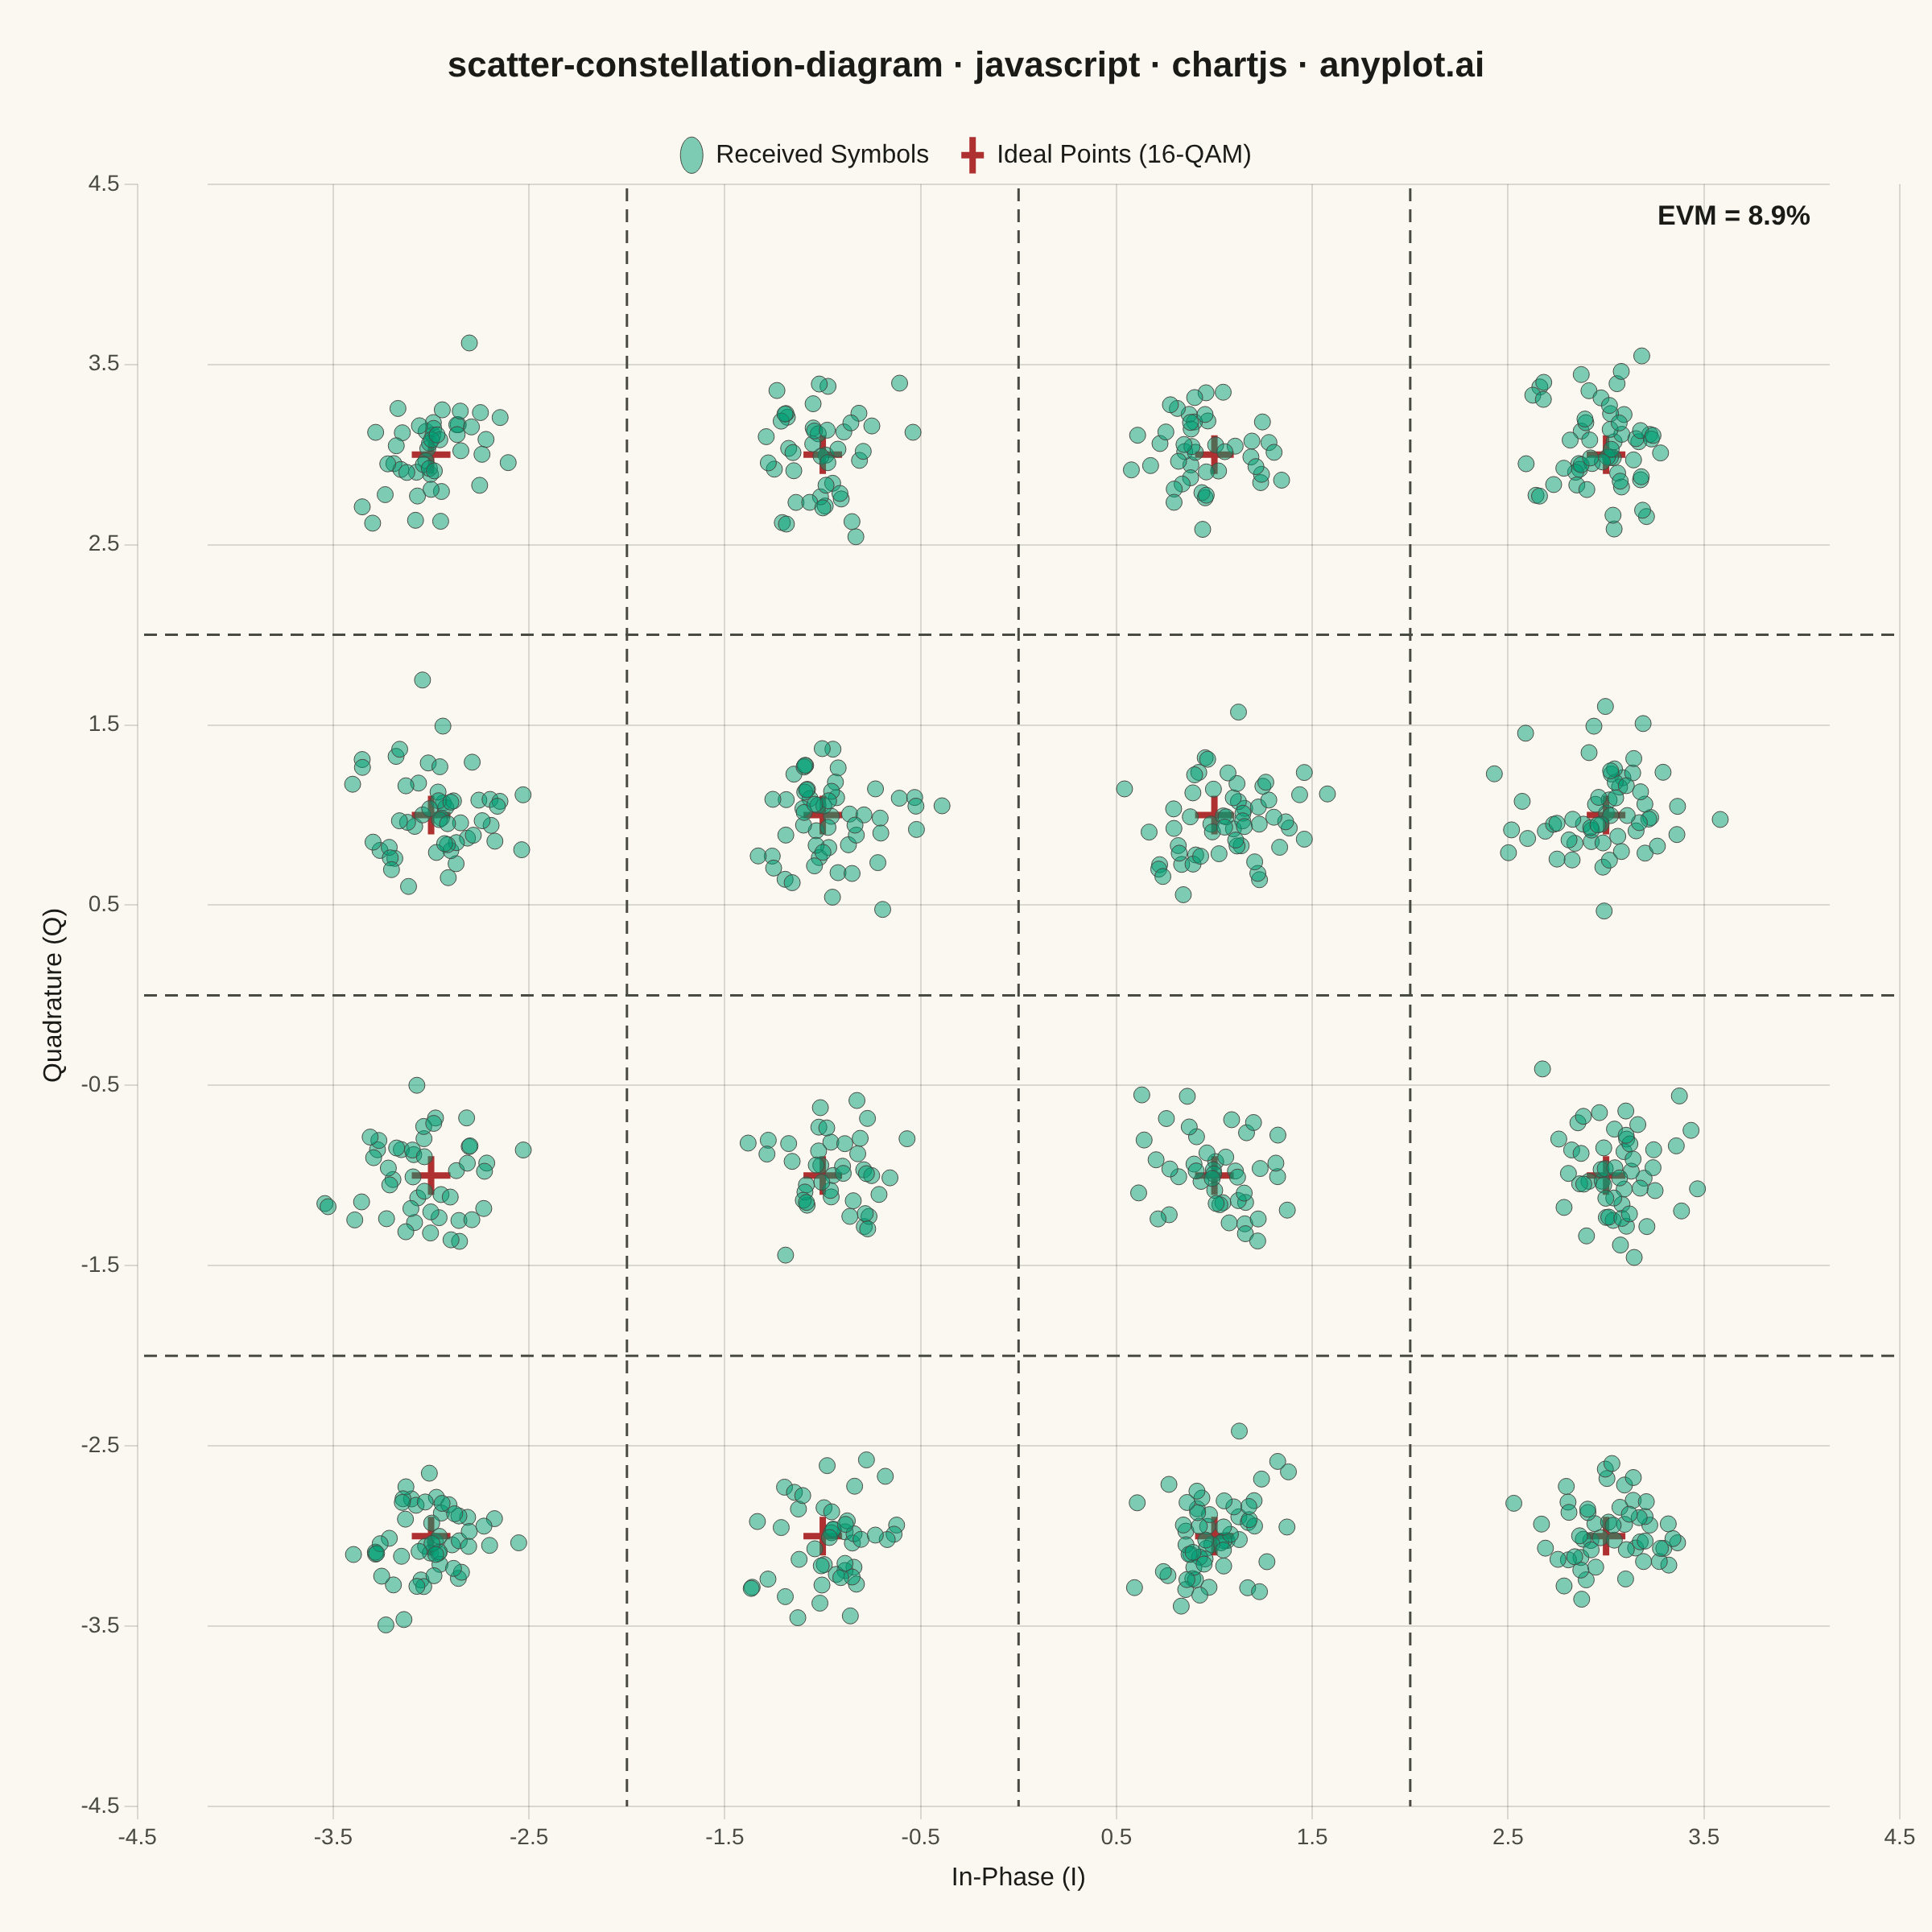
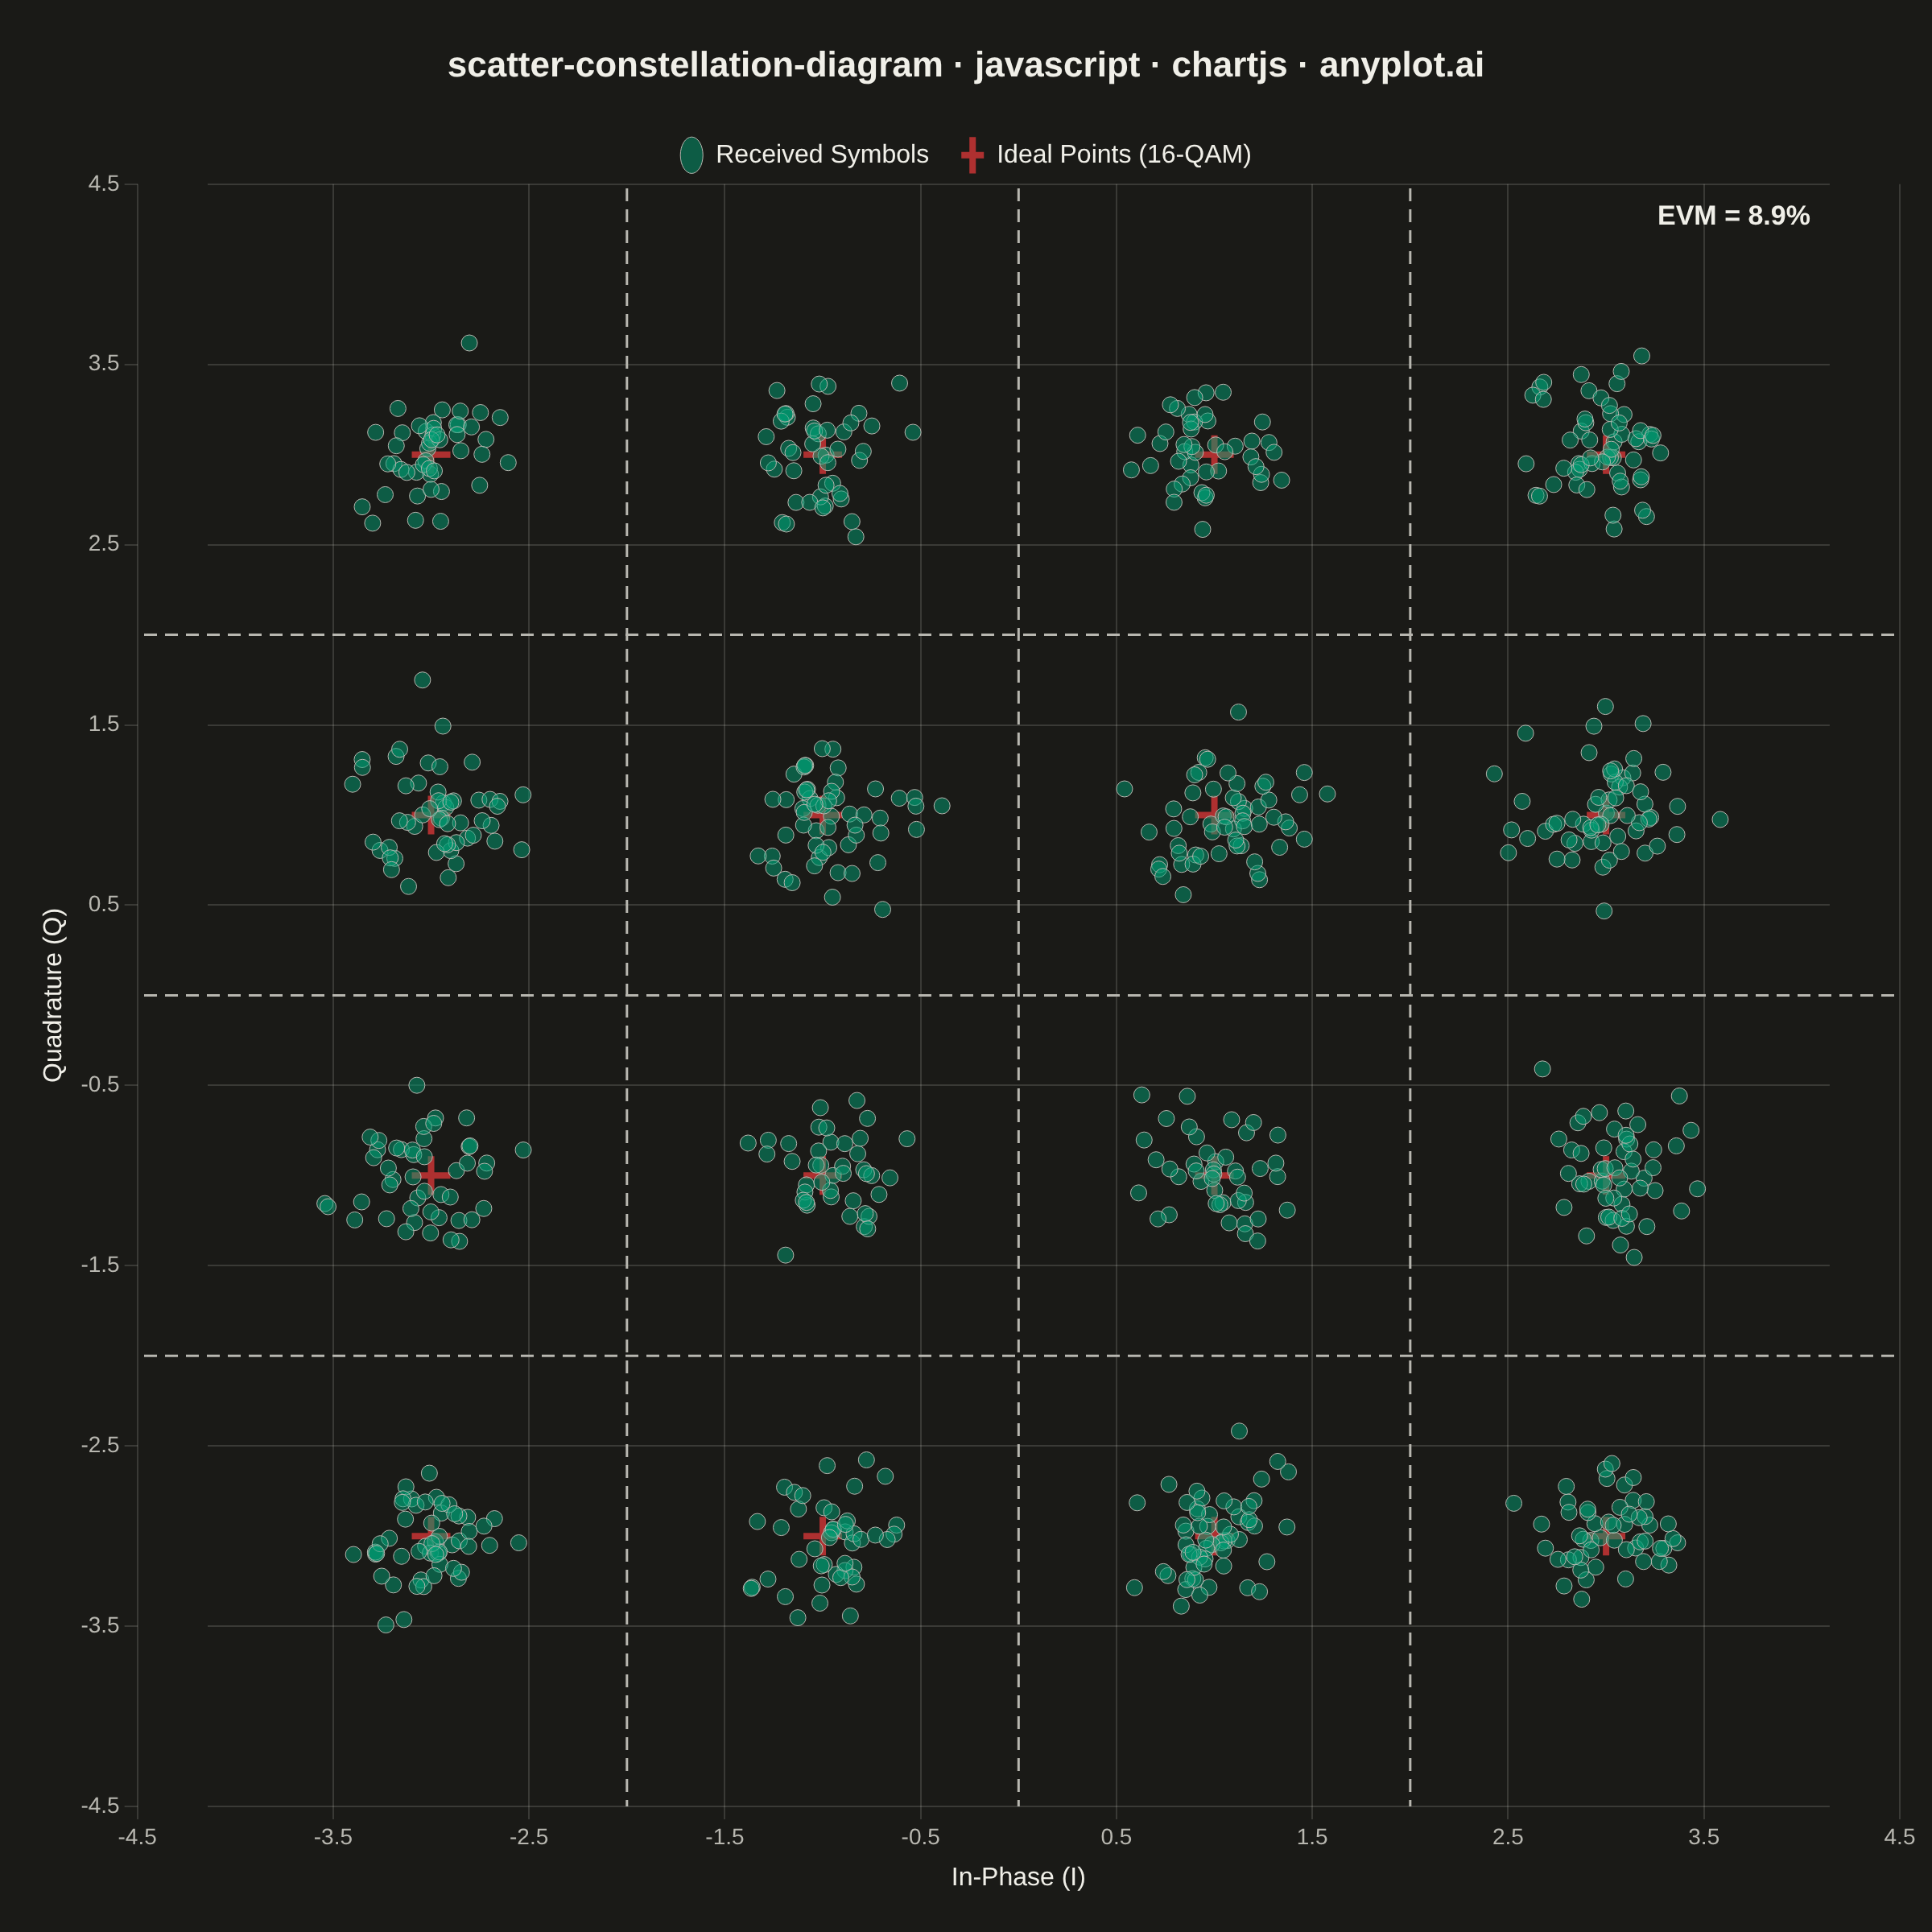
An I/Q (In-phase/Quadrature) scatter plot showing symbol positions of a digitally modulated signal. Ideal constellation points are displayed as reference markers with received symbols scattered around them, revealing modulation quality and signal impairments such as noise, phase offset, and amplitude distortion. This plot is the standard diagnostic tool for evaluating digital modulation schemes like 16-QAM.
// anyplot.ai
// scatter-constellation-diagram: Digital Modulation Constellation Diagram
// Library: chartjs 4.4.7 | JavaScript 22.22.3
// Quality: 91/100 | Created: 2026-06-18
//# anyplot-orientation: square

const t = window.ANYPLOT_TOKENS;

// Deterministic LCG (seed 42) — no Math.random() in the render harness
let seed = 42;
function lcg() {
  seed = ((1664525 * seed + 1013904223) >>> 0);
  return seed / 0x100000000;
}
function randn() {
  const u1 = Math.max(lcg(), 1e-10);
  const u2 = lcg();
  return Math.sqrt(-2 * Math.log(u1)) * Math.cos(2 * Math.PI * u2);
}

// 16-QAM ideal constellation — 4×4 grid at {-3,-1,+1,+3}²
const levels = [-3, -1, 1, 3];
const idealPoints = [];
for (const q of levels) {
  for (const i of levels) {
    idealPoints.push({ x: i, y: q });
  }
}

// Received symbols — 800 samples with per-axis Gaussian noise (σ = 0.20)
const noiseSigma = 0.20;
const receivedSymbols = [];
for (let n = 0; n < 800; n++) {
  const p = idealPoints[Math.floor(lcg() * 16)];
  const noiseI = randn() * noiseSigma;
  const noiseQ = randn() * noiseSigma;
  receivedSymbols.push({ x: p.x + noiseI, y: p.y + noiseQ });
}

// Theoretical RMS EVM: sqrt(2σ² / P_avg) × 100%
// P_avg = mean(|s|²) = mean(i²) + mean(q²) = 10 for this 16-QAM grid
const evmPct = (Math.sqrt(2 * noiseSigma * noiseSigma / 10) * 100).toFixed(1);

// Decision boundary lines — dashed at {-2, 0, +2} on both axes
const mkBoundary = (axis, v) => ({
  type: 'line',
  label: '',
  data: axis === 'v'
    ? [{ x: v, y: -5 }, { x: v, y: 5 }]
    : [{ x: -5, y: v }, { x: 5, y: v }],
  borderColor: t.inkSoft,
  borderWidth: 1.5,
  borderDash: [8, 5],
  pointRadius: 0,
  fill: false,
  tension: 0,
});
const boundaries = [
  ...[-2, 0, 2].map((v) => mkBoundary('v', v)),
  ...[-2, 0, 2].map((v) => mkBoundary('h', v)),
];

// Mount
const canvas = document.createElement('canvas');
document.getElementById('container').appendChild(canvas);

// Chart
new Chart(canvas, {
  type: 'scatter',
  data: {
    datasets: [
      {
        label: 'Received Symbols',
        data: receivedSymbols,
        backgroundColor: t.palette[0] + '80',
        borderColor: t.inkSoft,
        borderWidth: 0.5,
        pointRadius: 5,
        pointHoverRadius: 5,
      },
      {
        label: 'Ideal Points (16-QAM)',
        data: idealPoints,
        backgroundColor: '#AE3030',
        borderColor: '#AE3030',
        pointStyle: 'cross',
        pointRadius: 12,
        pointBorderWidth: 4,
        pointHoverRadius: 12,
      },
      ...boundaries,
    ],
  },
  options: {
    responsive: true,
    maintainAspectRatio: false,
    animation: false,
    layout: { padding: 20 },
    plugins: {
      title: {
        display: true,
        text: 'scatter-constellation-diagram · javascript · chartjs · anyplot.ai',
        color: t.ink,
        font: { size: 22 },
        padding: { top: 8, bottom: 14 },
      },
      legend: {
        labels: {
          color: t.ink,
          font: { size: 16 },
          filter: (item) => item.text !== '',
          usePointStyle: true,
          pointStyleWidth: 14,
          padding: 20,
        },
      },
    },
    scales: {
      x: {
        type: 'linear',
        min: -4.5,
        max: 4.5,
        ticks: { color: t.inkSoft, font: { size: 14 }, stepSize: 1 },
        grid: { color: t.grid },
        border: { display: false },
        title: {
          display: true,
          text: 'In-Phase (I)',
          color: t.ink,
          font: { size: 16 },
        },
      },
      y: {
        type: 'linear',
        min: -4.5,
        max: 4.5,
        ticks: { color: t.inkSoft, font: { size: 14 }, stepSize: 1 },
        grid: { color: t.grid },
        border: { display: false },
        title: {
          display: true,
          text: 'Quadrature (Q)',
          color: t.ink,
          font: { size: 16 },
        },
      },
    },
  },
  plugins: [
    {
      id: 'bgFill',
      beforeDraw(chart) {
        const { ctx } = chart;
        ctx.save();
        ctx.fillStyle = t.pageBg;
        ctx.fillRect(0, 0, chart.width, chart.height);
        ctx.restore();
      },
    },
    {
      // Force inner chartArea to a square so the I/Q geometry is preserved 1:1
      id: 'squareAspect',
      afterLayout(chart) {
        const ca = chart.chartArea;
        const w = ca.right - ca.left;
        const h = ca.bottom - ca.top;
        if (w > h) {
          const d = (w - h) / 2;
          ca.left += d;
          ca.right -= d;
        } else if (h > w) {
          const d = (h - w) / 2;
          ca.top += d;
          ca.bottom -= d;
        }
      },
    },
    {
      id: 'evmLabel',
      afterDraw(chart) {
        const { ctx, chartArea } = chart;
        const fontFamily = Chart.defaults.font.family || 'sans-serif';
        ctx.save();
        ctx.font = `bold 17px ${fontFamily}`;
        ctx.fillStyle = t.ink;
        ctx.textAlign = 'right';
        ctx.textBaseline = 'top';
        ctx.fillText(`EVM = ${evmPct}%`, chartArea.right - 12, chartArea.top + 12);
        ctx.restore();
      },
    },
  ],
});
Runnable source as JSON, for any HTTP client: https://api.anyplot.ai/specs/scatter-constellation-diagram/chartjs/code. Any spec id and library id listed in llms-full.txt fit the same URL shape; every URL below is complete and callable.
{
  "spec_id": "scatter-constellation-diagram",
  "language": "javascript",
  "library": "chartjs",
  "page": "https://anyplot.ai/scatter-constellation-diagram/javascript/chartjs",
  "hub": "https://anyplot.ai/scatter-constellation-diagram",
  "code_json": "https://api.anyplot.ai/specs/scatter-constellation-diagram/chartjs/code",
  "spec_json": "https://api.anyplot.ai/specs/scatter-constellation-diagram",
  "render_light_png": "https://storage.googleapis.com/anyplot-images/plots/scatter-constellation-diagram/javascript/chartjs/plot-light.png",
  "render_dark_png": "https://storage.googleapis.com/anyplot-images/plots/scatter-constellation-diagram/javascript/chartjs/plot-dark.png",
  "interactive_light_html": "https://storage.googleapis.com/anyplot-images/plots/scatter-constellation-diagram/javascript/chartjs/plot-light.html",
  "interactive_dark_html": "https://storage.googleapis.com/anyplot-images/plots/scatter-constellation-diagram/javascript/chartjs/plot-dark.html",
  "quality_score": 91.0,
  "license": "MIT",
  "guide": "https://anyplot.ai/llms.txt"
}
Part of Digital Modulation Constellation Diagram on anyplot.ai.