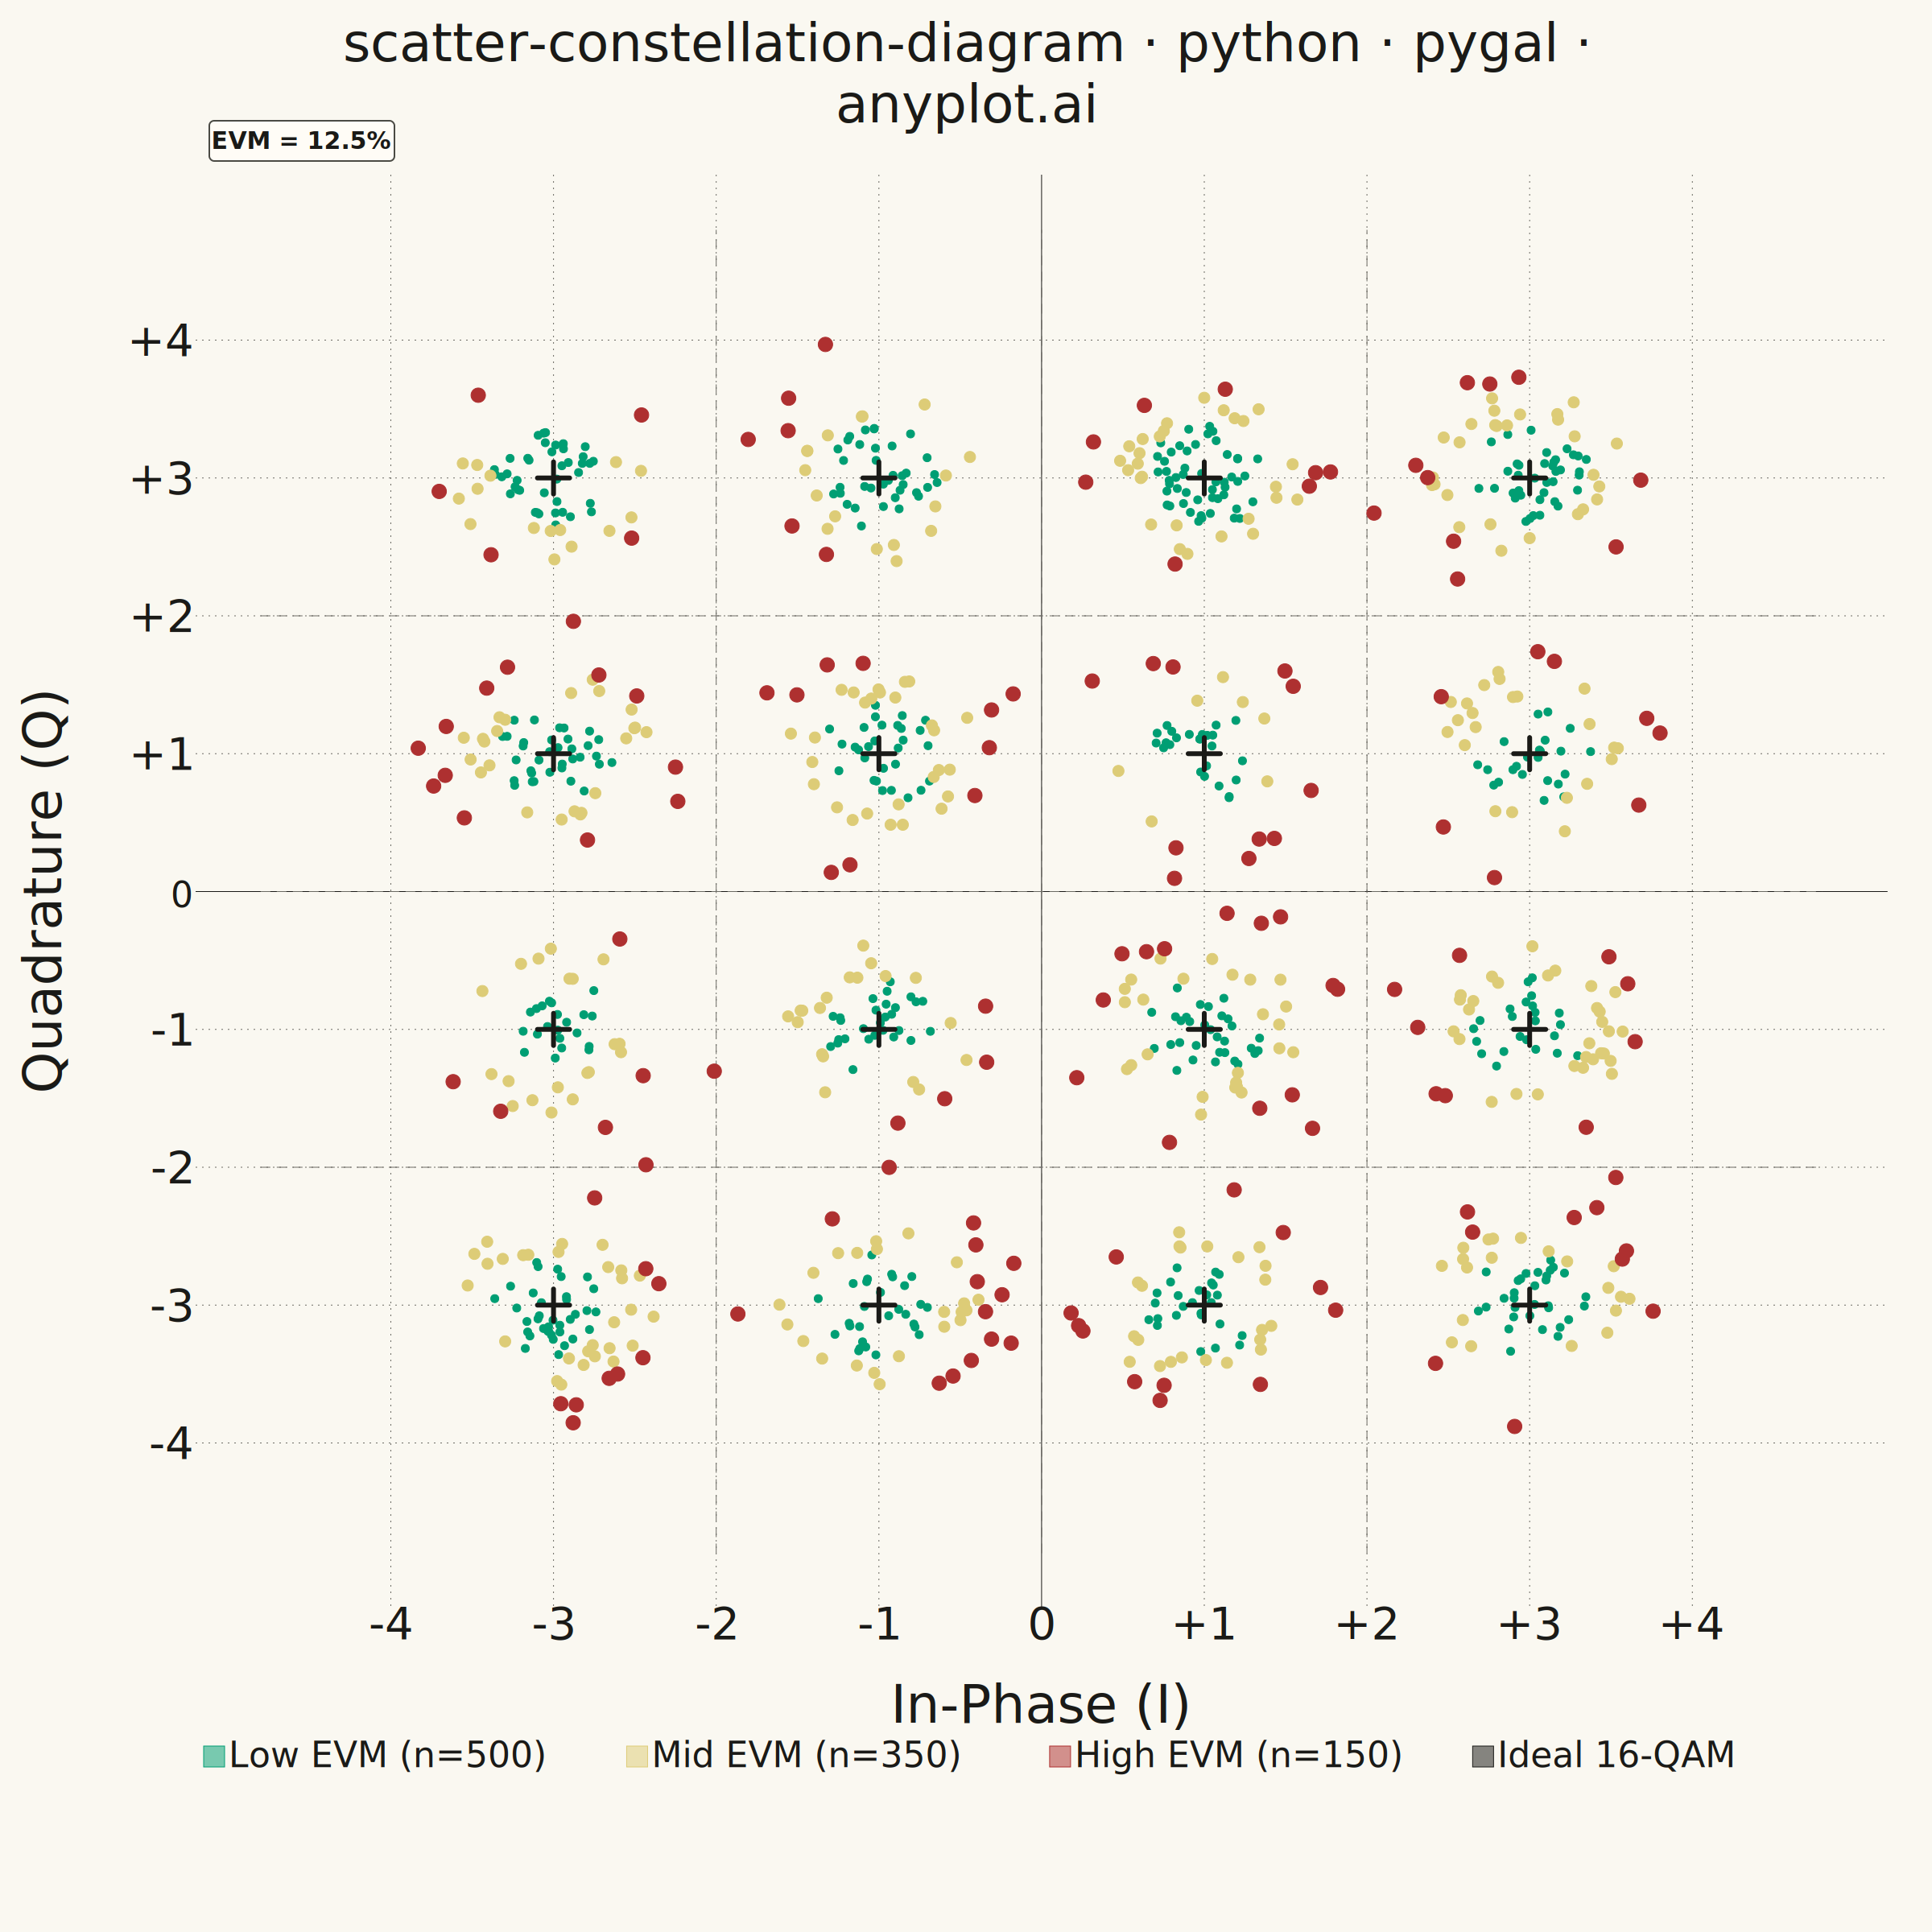
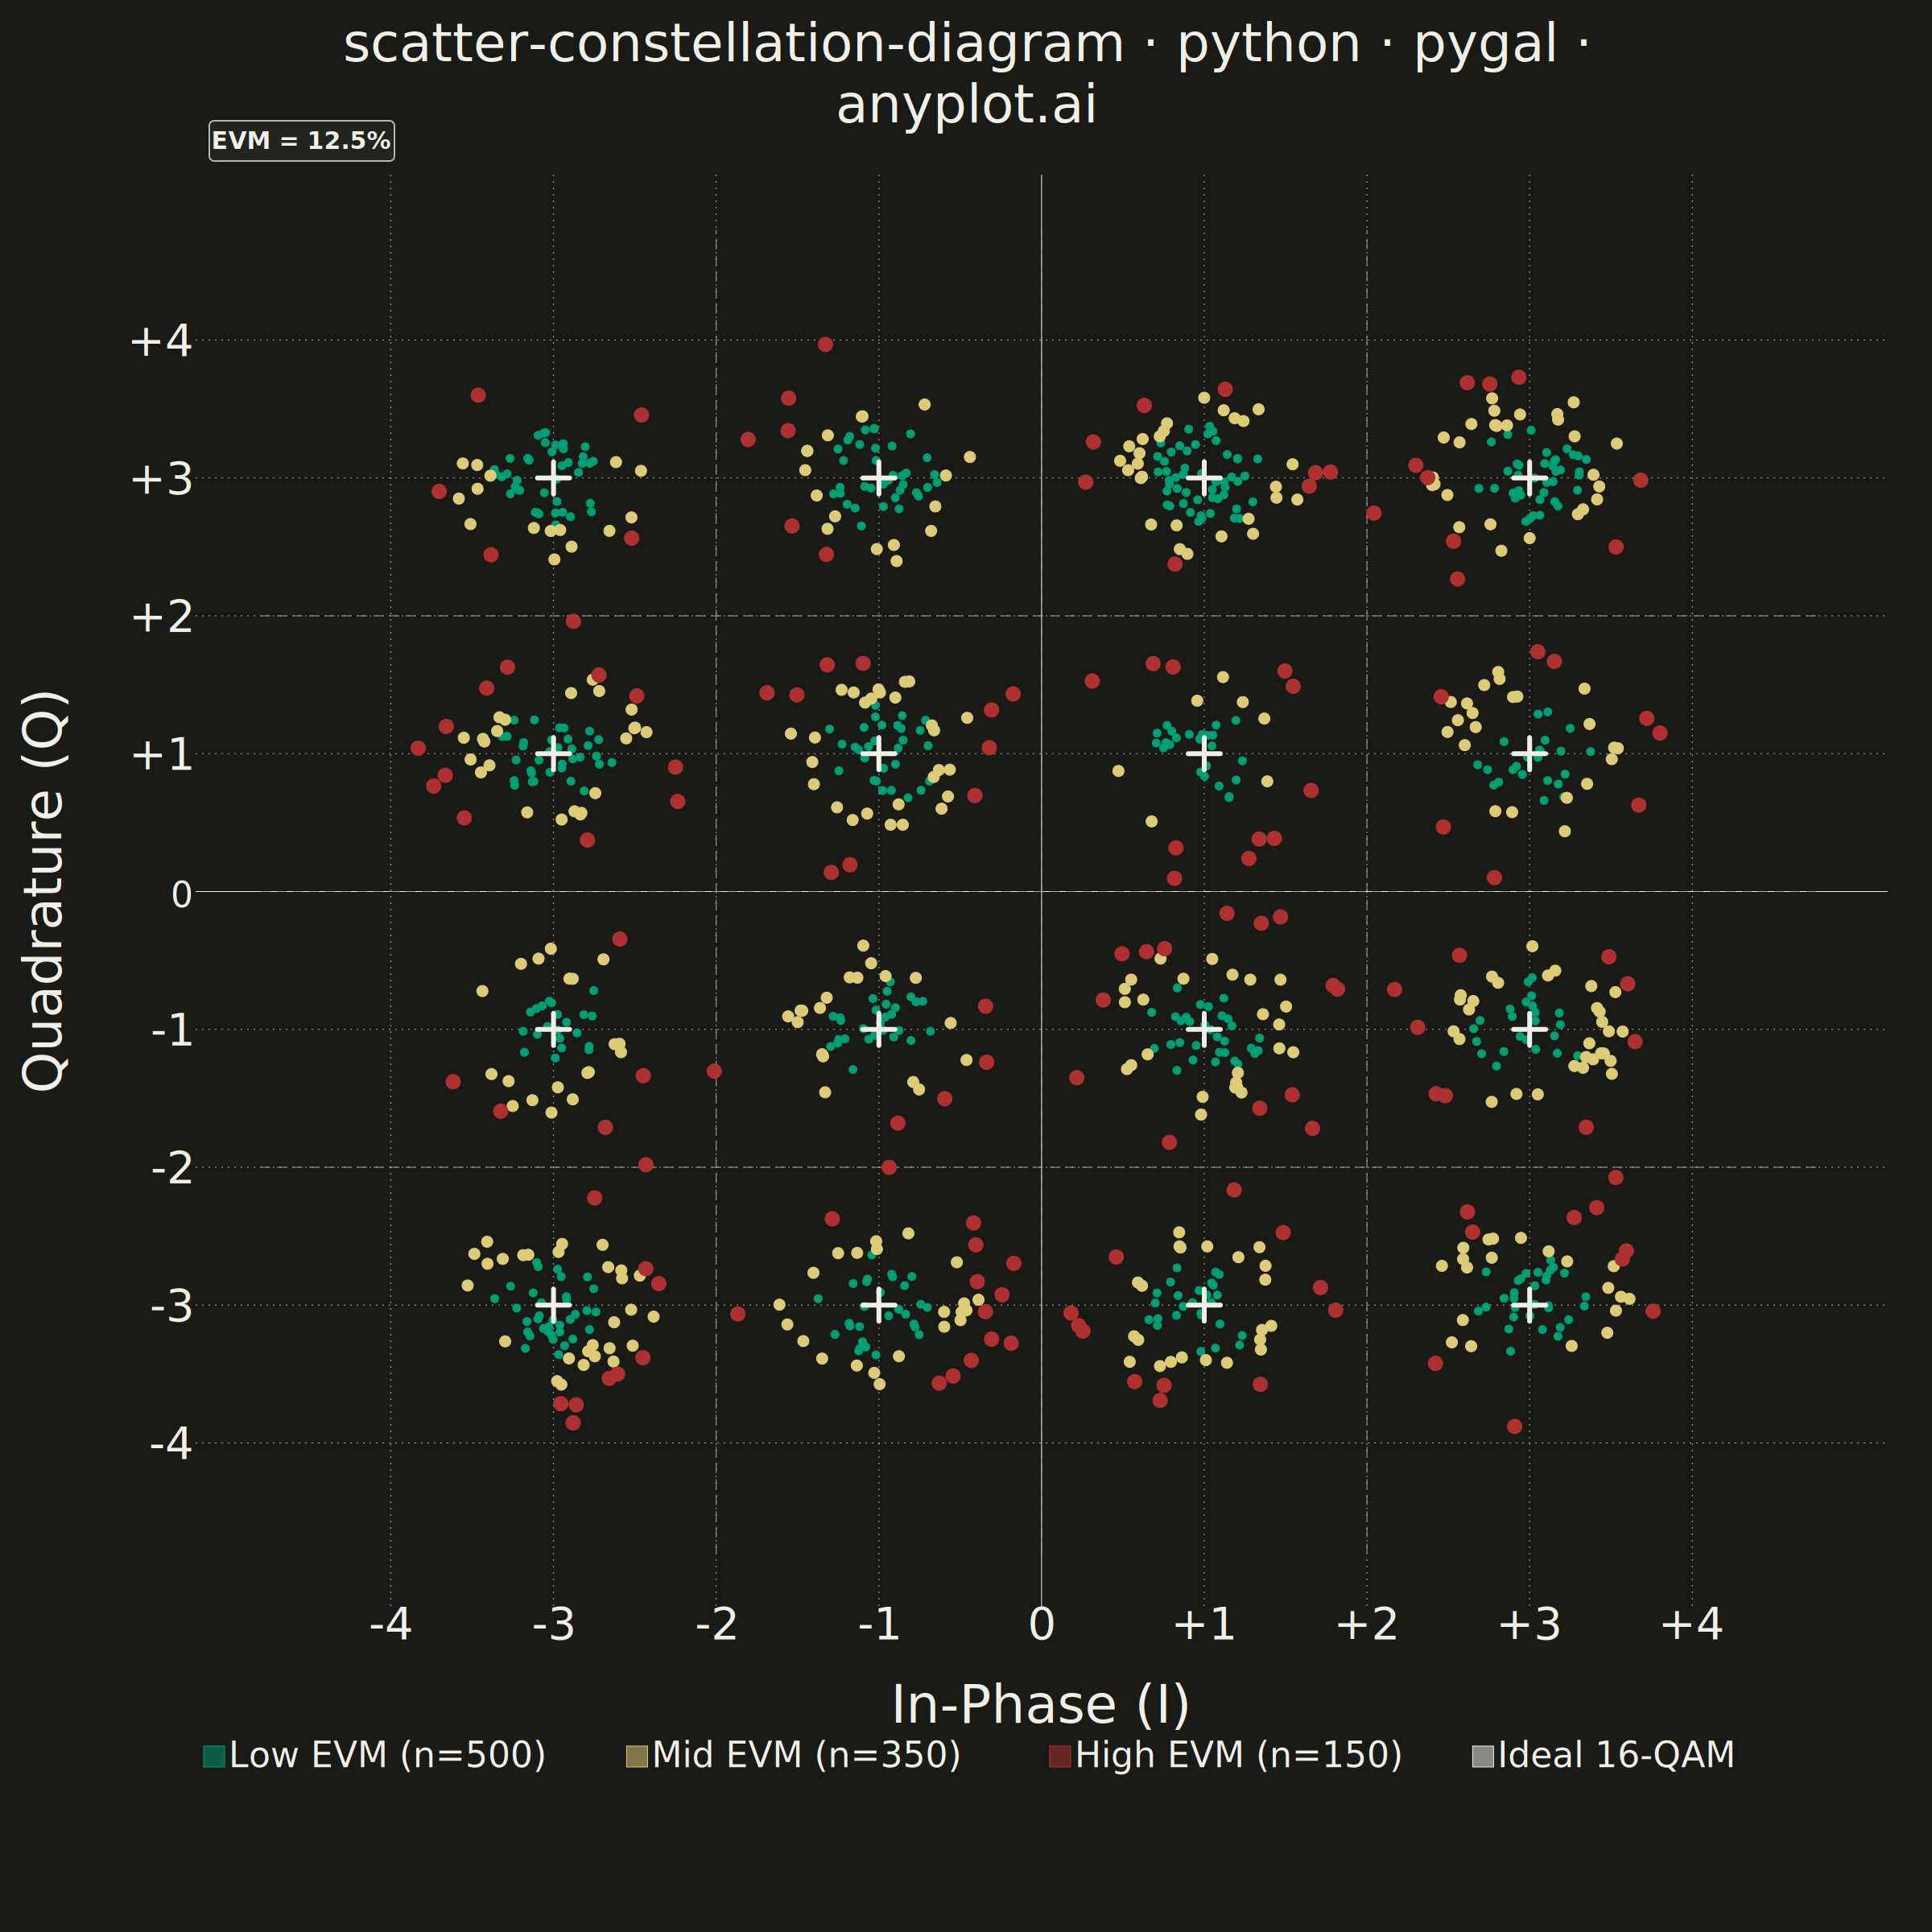
An I/Q (In-phase/Quadrature) scatter plot showing symbol positions of a digitally modulated signal. Ideal constellation points are displayed as reference markers with received symbols scattered around them, revealing modulation quality and signal impairments such as noise, phase offset, and amplitude distortion. This plot is the standard diagnostic tool for evaluating digital modulation schemes like 16-QAM.
""" anyplot.ai
scatter-constellation-diagram: Digital Modulation Constellation Diagram
Library: pygal 3.1.0 | Python 3.13.13
Quality: 84/100 | Updated: 2026-06-18
"""

import os
import re
import sys


# This file is named pygal.py and would shadow the installed pygal package.
# Remove this script's own directory from sys.path before importing pygal.
_here = os.path.dirname(os.path.abspath(__file__))
sys.path = [p for p in sys.path if os.path.abspath(p) != _here]
del _here

import cairosvg
import numpy as np
import pygal
from pygal.style import Style


# Theme — Imprint palette, theme-adaptive chrome
THEME = os.getenv("ANYPLOT_THEME", "light")
PAGE_BG = "#FAF8F1" if THEME == "light" else "#1A1A17"
ELEVATED_BG = "#FFFDF6" if THEME == "light" else "#242420"
INK = "#1A1A17" if THEME == "light" else "#F0EFE8"
INK_SOFT = "#4A4A44" if THEME == "light" else "#B8B7B0"
INK_MUTED = "#6B6A63" if THEME == "light" else "#A8A79F"
ANYPLOT_AMBER = "#DDCC77"

# Data — 16-QAM constellation with received symbols under additive Gaussian noise
np.random.seed(42)

ideal_vals = [-3, -1, 1, 3]
ideal_i = np.array([i for i in ideal_vals for _ in ideal_vals])
ideal_q = np.array([q for _ in ideal_vals for q in ideal_vals])

n_symbols = 1000
symbol_indices = np.random.randint(0, 16, n_symbols)
snr_db = 20
signal_power = np.mean(ideal_i**2 + ideal_q**2)
noise_std = np.sqrt(signal_power * 10 ** (-snr_db / 10))
received_i = ideal_i[symbol_indices] + np.random.normal(0, noise_std, n_symbols)
received_q = ideal_q[symbol_indices] + np.random.normal(0, noise_std, n_symbols)

# Slight phase offset for realistic impairment
phase_offset = 0.015
r = np.sqrt(ideal_i[symbol_indices] ** 2 + ideal_q[symbol_indices] ** 2)
received_i += -phase_offset * received_q * (r / r.max())
received_q += phase_offset * received_i * (r / r.max())

# EVM per symbol
error_vectors = np.sqrt((received_i - ideal_i[symbol_indices]) ** 2 + (received_q - ideal_q[symbol_indices]) ** 2)
avg_power = np.sqrt(signal_power)
evm_percent = float(np.mean(error_vectors) / avg_power * 100)

evm_per_symbol = error_vectors / avg_power * 100
p50, p85 = np.percentile(evm_per_symbol, 50), np.percentile(evm_per_symbol, 85)
low_mask = evm_per_symbol <= p50
mid_mask = (evm_per_symbol > p50) & (evm_per_symbol <= p85)
high_mask = evm_per_symbol > p85

# Imprint palette with semantic EVM severity coloring:
# Low EVM = good → #009E73 (brand green), Mid EVM = caution → #DDCC77 (amber),
# High EVM = error → #AE3030 (matte red). Decision boundaries → INK_MUTED (subtle).
# Ideal reference points → INK (theme-adaptive neutral).
font = "DejaVu Sans, Helvetica, Arial, sans-serif"

custom_style = Style(
    background=PAGE_BG,
    plot_background=PAGE_BG,
    foreground=INK,
    foreground_strong=INK,
    foreground_subtle=INK_MUTED,
    guide_stroke_color=INK_MUTED,
    guide_stroke_dasharray="2, 6",
    colors=(
        INK_MUTED,  # boundary vertical 1
        INK_MUTED,  # boundary vertical 2
        INK_MUTED,  # boundary vertical 3
        INK_MUTED,  # boundary horizontal 1
        INK_MUTED,  # boundary horizontal 2
        INK_MUTED,  # boundary horizontal 3
        "#009E73",  # Low EVM — green (good)
        ANYPLOT_AMBER,  # Mid EVM — amber (caution)
        "#AE3030",  # High EVM — red (error)
        INK,  # Ideal 16-QAM — neutral reference
    ),
    font_family=font,
    title_font_family=font,
    title_font_size=66,
    label_font_size=56,
    major_label_font_size=44,
    legend_font_size=44,
    legend_font_family=font,
    value_font_size=36,
    tooltip_font_size=30,
    tooltip_font_family=font,
    opacity=0.52,
    opacity_hover=0.95,
    stroke_opacity=1,
    stroke_opacity_hover=1,
)

axis_labels = [{"value": v, "label": "0" if v == 0 else f"{v:+.0f}"} for v in [-4, -3, -2, -1, 0, 1, 2, 3, 4]]

# Chart — square canvas for equal aspect ratio (2400×2400 canonical)
chart = pygal.XY(
    width=2400,
    height=2400,
    style=custom_style,
    title="scatter-constellation-diagram · python · pygal · anyplot.ai",
    x_title="In-Phase (I)",
    y_title="Quadrature (Q)",
    show_legend=True,
    legend_at_bottom=True,
    legend_at_bottom_columns=4,
    legend_box_size=26,
    stroke=False,
    dots_size=5,
    show_x_guides=True,
    show_y_guides=True,
    x_labels=axis_labels,
    y_labels=axis_labels,
    x_value_formatter=lambda x: f"{x:+.1f}",
    value_formatter=lambda y: f"{y:+.1f}",
    margin_bottom=140,
    margin_left=90,
    margin_right=55,
    margin_top=65,
    range=(-5, 5),
    xrange=(-5, 5),
    print_values=False,
    print_zeroes=False,
    truncate_legend=-1,
    js=[],
)

# Decision boundaries — dashed lines at +/-2, 0 (6 series consuming first 6 color slots)
boundary_vals = [-2.0, 0.0, 2.0]
for bv in boundary_vals:
    chart.add(
        None,
        [{"value": (bv, -4.8)}, {"value": (bv, 4.8)}],
        stroke=True,
        show_dots=False,
        stroke_style={"width": 2, "dasharray": "12, 8", "linecap": "butt"},
    )
    chart.add(
        None,
        [{"value": (-4.8, bv)}, {"value": (4.8, bv)}],
        stroke=True,
        show_dots=False,
        stroke_style={"width": 2, "dasharray": "12, 8", "linecap": "butt"},
    )

# Received symbols split by EVM magnitude (semantic Imprint colors, size encodes severity)
low_points = [
    {
        "value": (float(received_i[i]), float(received_q[i])),
        "label": f"I={received_i[i]:+.2f}  Q={received_q[i]:+.2f}  EVM={evm_per_symbol[i]:.1f}%",
    }
    for i in range(n_symbols)
    if low_mask[i]
]
mid_points = [
    {
        "value": (float(received_i[i]), float(received_q[i])),
        "label": f"I={received_i[i]:+.2f}  Q={received_q[i]:+.2f}  EVM={evm_per_symbol[i]:.1f}%",
    }
    for i in range(n_symbols)
    if mid_mask[i]
]
high_points = [
    {
        "value": (float(received_i[i]), float(received_q[i])),
        "label": f"I={received_i[i]:+.2f}  Q={received_q[i]:+.2f}  EVM={evm_per_symbol[i]:.1f}%",
    }
    for i in range(n_symbols)
    if high_mask[i]
]

chart.add(f"Low EVM (n={len(low_points)})", low_points, stroke=False, dots_size=5)
chart.add(f"Mid EVM (n={len(mid_points)})", mid_points, stroke=False, dots_size=7)
chart.add(f"High EVM (n={len(high_points)})", high_points, stroke=False, dots_size=9)

# Ideal constellation points — dots_size=15 → r="15" circles, replaced with crosses below
ideal_points = [
    {"value": (float(ideal_i[k]), float(ideal_q[k])), "label": f"Ideal ({int(ideal_i[k]):+d}, {int(ideal_q[k]):+d})"}
    for k in range(16)
]
chart.add("Ideal 16-QAM", ideal_points, stroke=False, dots_size=15)

svg_content = chart.render(is_unicode=True)


# Replace ideal point circles (r=15) with cross markers via SVG post-processing
# pygal's SVG-native architecture makes this the idiomatic way to use custom marker shapes
def replace_circle_with_cross(m):
    full = m.group(0)
    coords = re.search(r'cx="([^"]+)".*?cy="([^"]+)"', full)
    if not coords:
        return full
    cx, cy = float(coords.group(1)), float(coords.group(2))
    arm = 20
    return (
        f'<g><line x1="{cx - arm}" y1="{cy}" x2="{cx + arm}" y2="{cy}" '
        f'stroke="{INK}" stroke-width="6" stroke-linecap="round"/>'
        f'<line x1="{cx}" y1="{cy - arm}" x2="{cx}" y2="{cy + arm}" '
        f'stroke="{INK}" stroke-width="6" stroke-linecap="round"/></g>'
    )


svg_content = re.sub(r'<circle[^>]*r="15"[^>]*/>', replace_circle_with_cross, svg_content)

# Theme-adaptive EVM annotation box
evm_box = (
    f'<g transform="translate(260, 150)">'
    f'<rect x="0" y="0" width="230" height="50" rx="6" ry="6" '
    f'fill="{ELEVATED_BG}" fill-opacity="0.92" stroke="{INK_SOFT}" stroke-width="2"/>'
    f'<text x="115" y="35" font-size="30" font-family="{font}" '
    f'font-weight="bold" fill="{INK}" text-anchor="middle">'
    f"EVM = {evm_percent:.1f}%</text></g>"
)
svg_content = svg_content.replace("</svg>", f"{evm_box}</svg>")

# Save PNG and interactive HTML
cairosvg.svg2png(bytestring=svg_content.encode("utf-8"), write_to=f"plot-{THEME}.png")
with open(f"plot-{THEME}.html", "w") as f:
    f.write(f"<!DOCTYPE html><html><body style='margin:0;background:{PAGE_BG}'>{svg_content}</body></html>")
Runnable source as JSON, for any HTTP client: https://api.anyplot.ai/specs/scatter-constellation-diagram/pygal/code. Any spec id and library id listed in llms-full.txt fit the same URL shape; every URL below is complete and callable.
{
  "spec_id": "scatter-constellation-diagram",
  "language": "python",
  "library": "pygal",
  "page": "https://anyplot.ai/scatter-constellation-diagram/python/pygal",
  "hub": "https://anyplot.ai/scatter-constellation-diagram",
  "code_json": "https://api.anyplot.ai/specs/scatter-constellation-diagram/pygal/code",
  "spec_json": "https://api.anyplot.ai/specs/scatter-constellation-diagram",
  "render_light_png": "https://storage.googleapis.com/anyplot-images/plots/scatter-constellation-diagram/python/pygal/plot-light.png",
  "render_dark_png": "https://storage.googleapis.com/anyplot-images/plots/scatter-constellation-diagram/python/pygal/plot-dark.png",
  "interactive_light_html": "https://storage.googleapis.com/anyplot-images/plots/scatter-constellation-diagram/python/pygal/plot-light.html",
  "interactive_dark_html": "https://storage.googleapis.com/anyplot-images/plots/scatter-constellation-diagram/python/pygal/plot-dark.html",
  "quality_score": 84.0,
  "license": "MIT",
  "guide": "https://anyplot.ai/llms.txt"
}
Part of Digital Modulation Constellation Diagram on anyplot.ai.