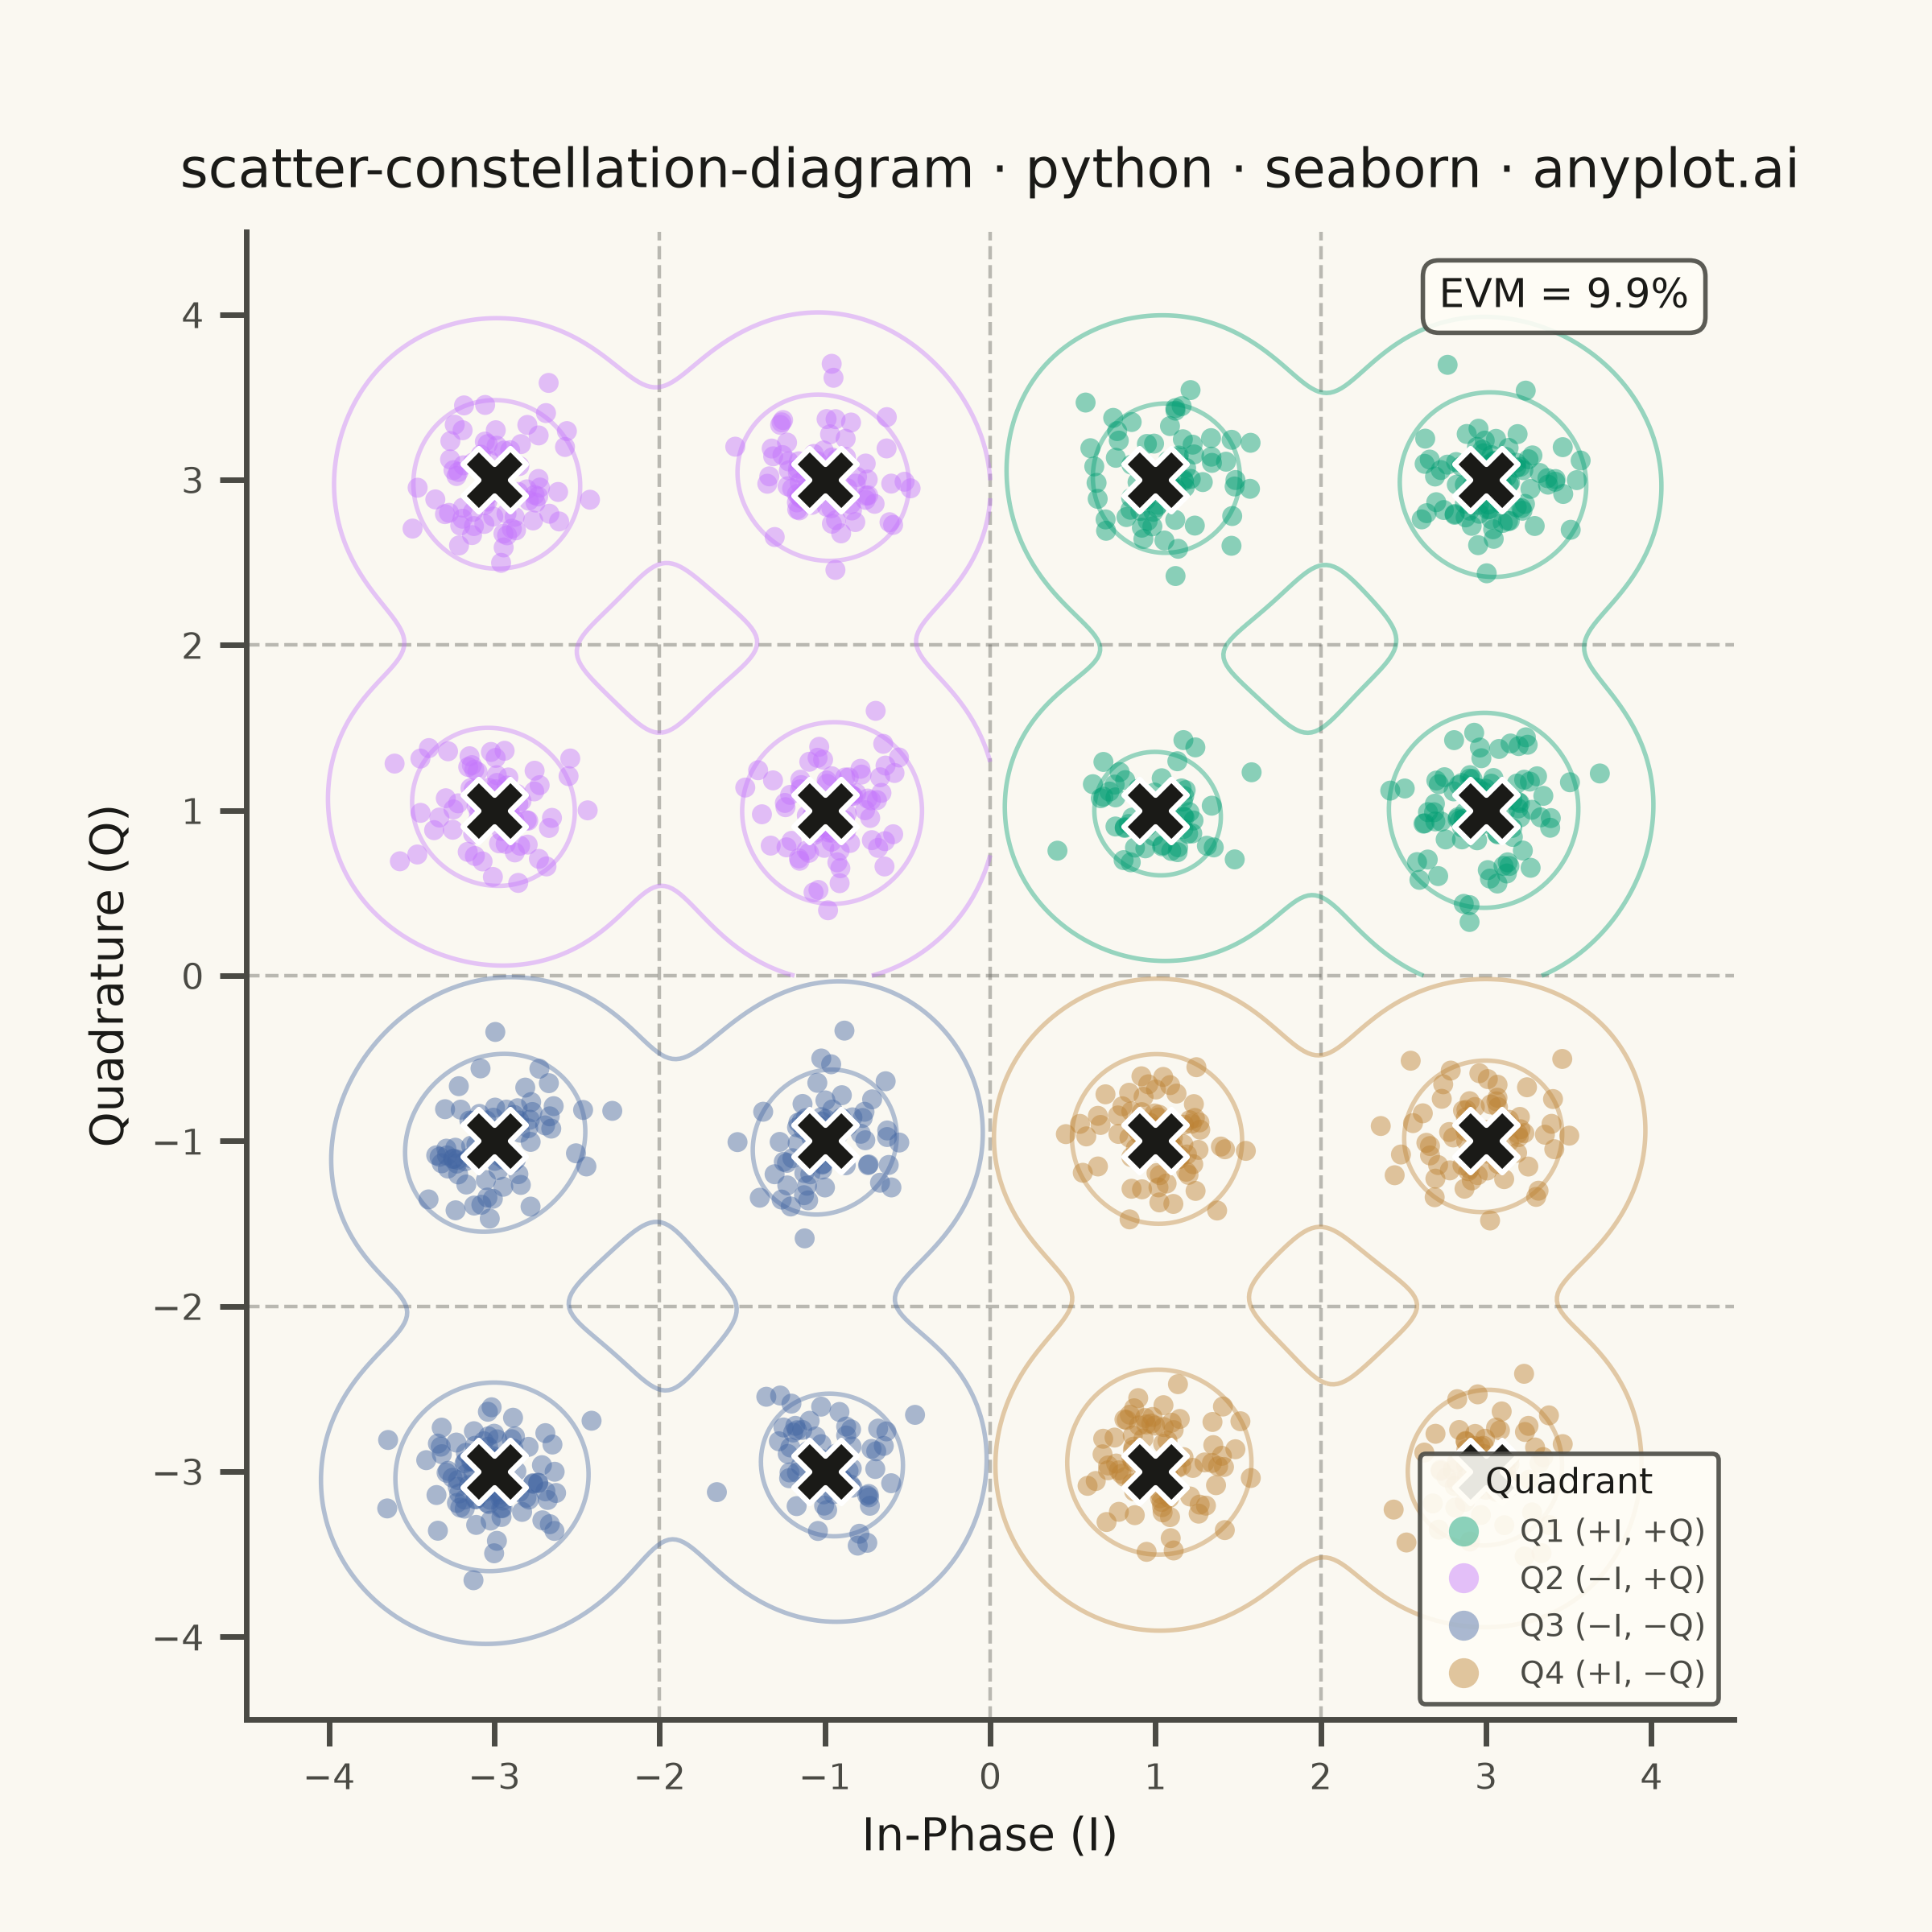
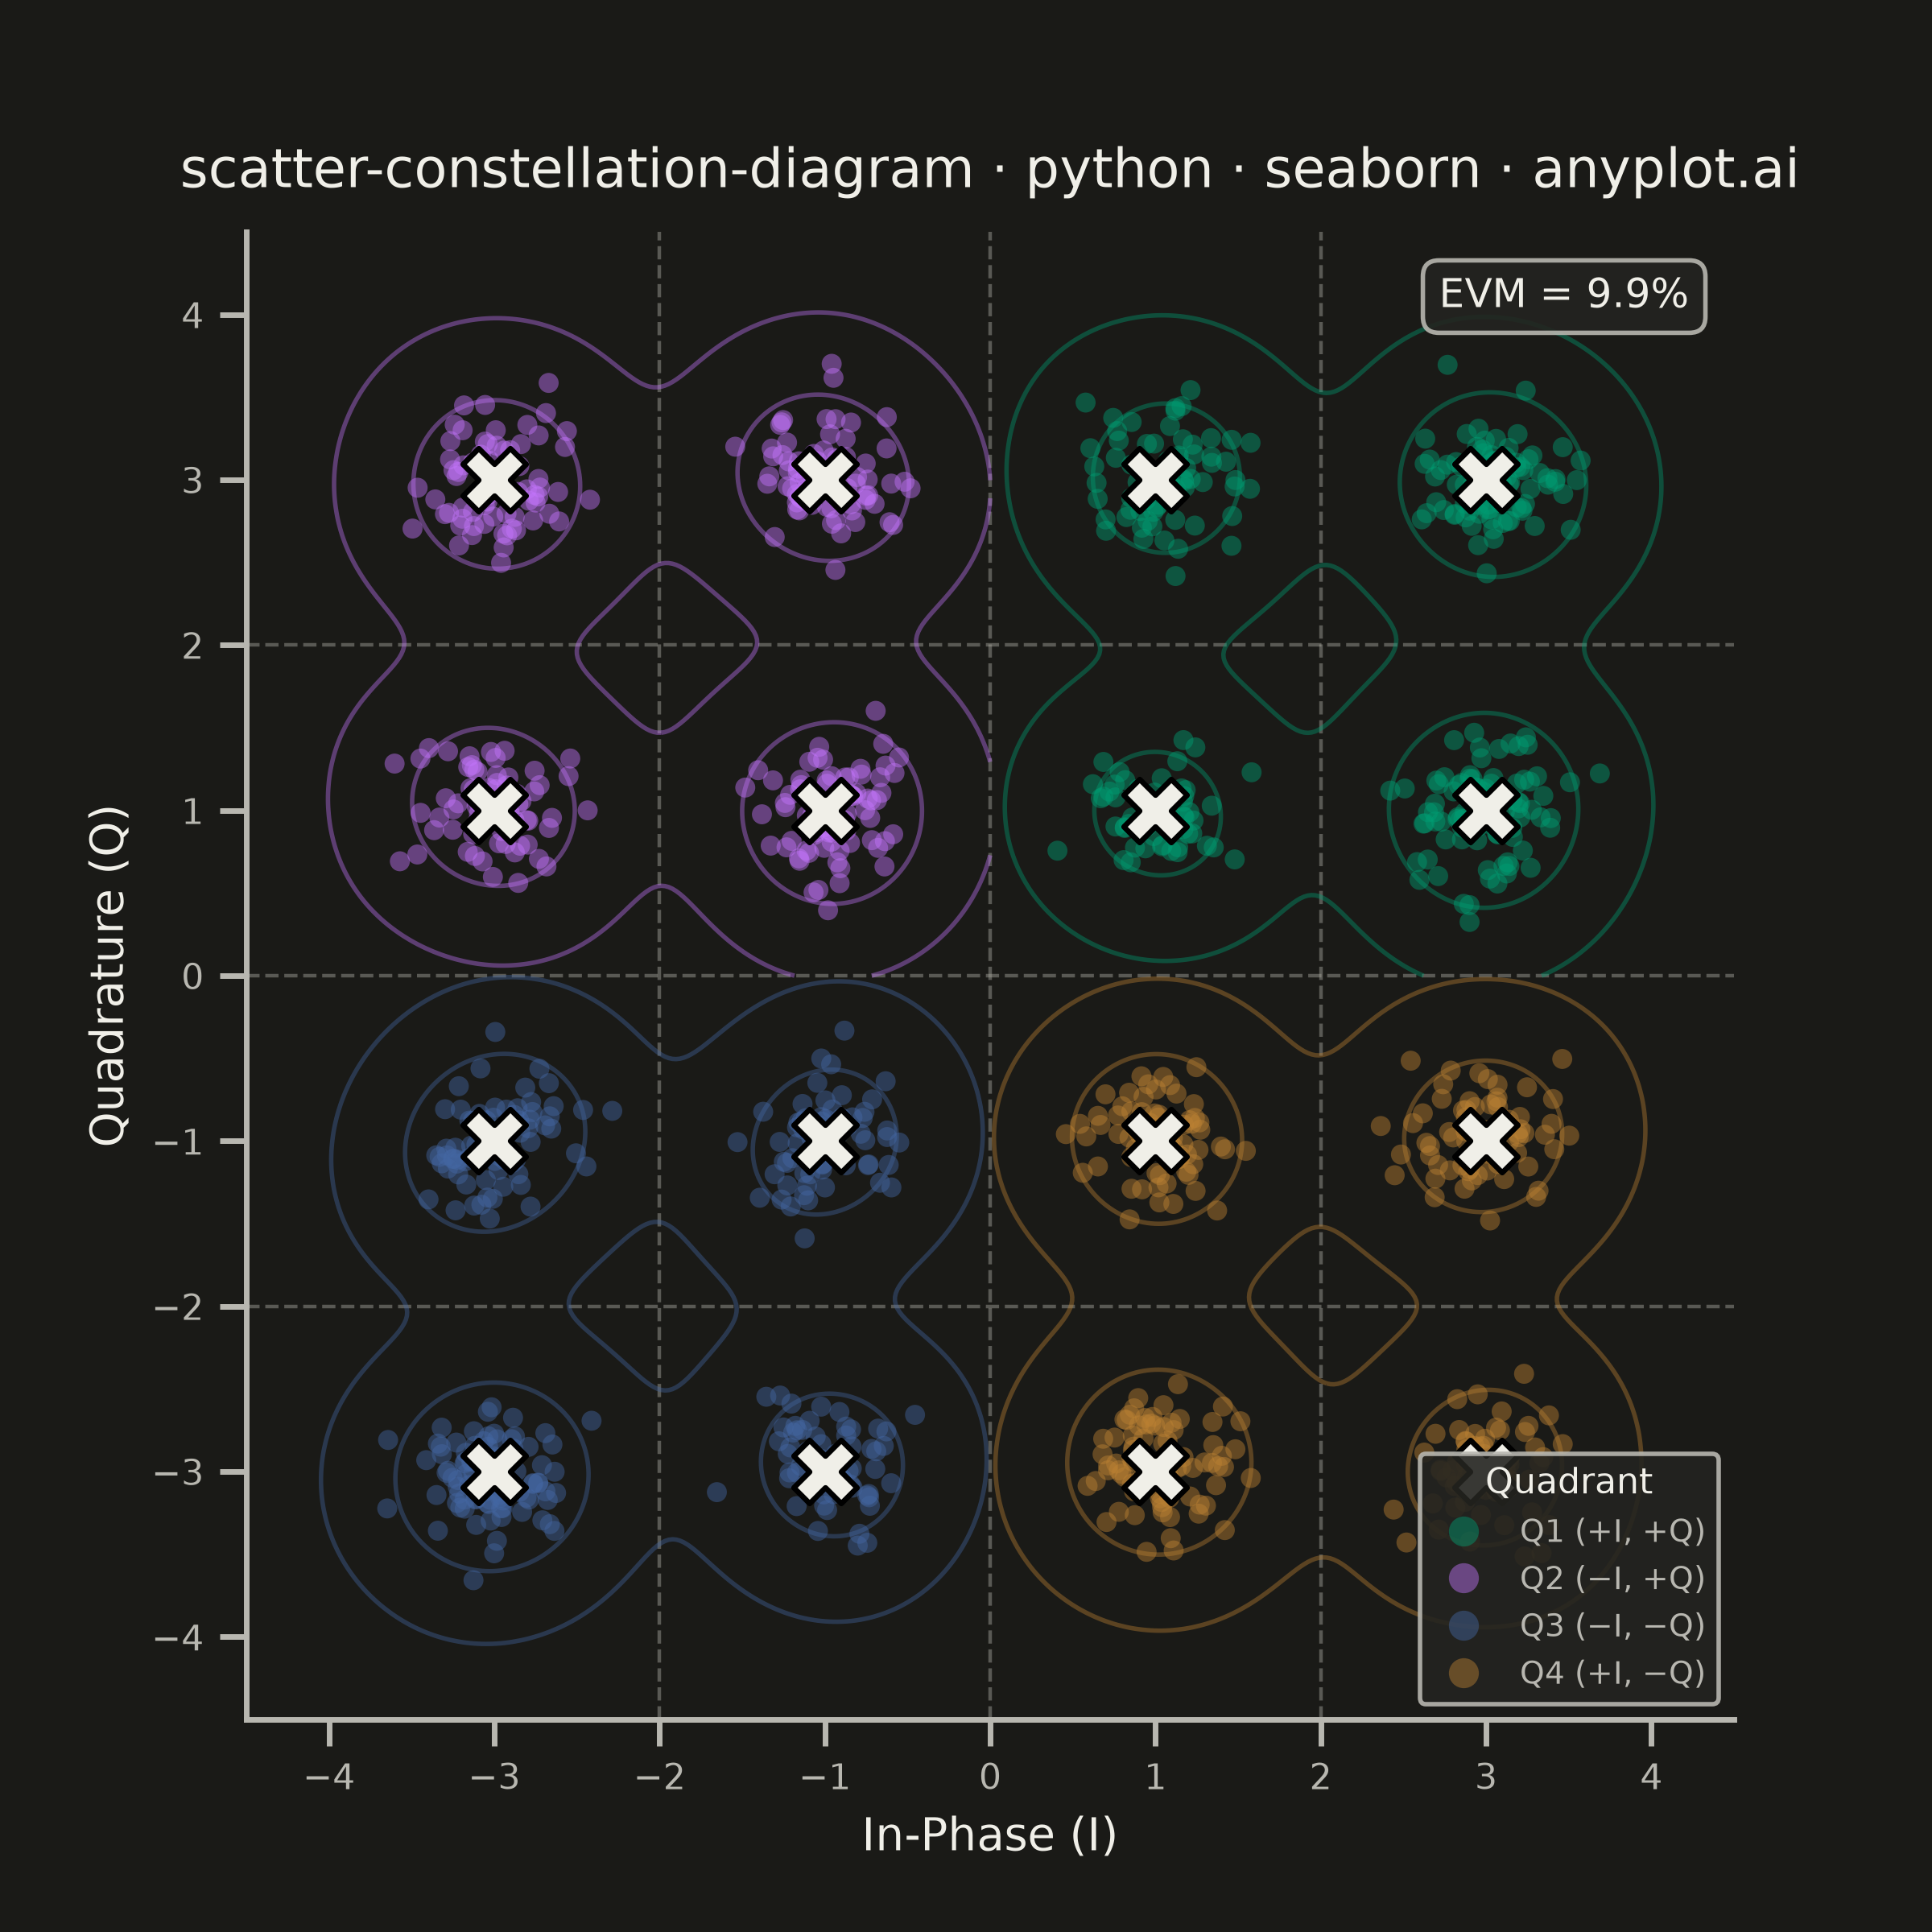
An I/Q (In-phase/Quadrature) scatter plot showing symbol positions of a digitally modulated signal. Ideal constellation points are displayed as reference markers with received symbols scattered around them, revealing modulation quality and signal impairments such as noise, phase offset, and amplitude distortion. This plot is the standard diagnostic tool for evaluating digital modulation schemes like 16-QAM.
""" anyplot.ai
scatter-constellation-diagram: Digital Modulation Constellation Diagram
Library: seaborn 0.13.2 | Python 3.13.14
Quality: 89/100 | Updated: 2026-06-18
"""

import os

import matplotlib.pyplot as plt
import numpy as np
import pandas as pd
import seaborn as sns


# ── Theme ──────────────────────────────────────────────────────────────────
THEME = os.getenv("ANYPLOT_THEME", "light")
PAGE_BG = "#FAF8F1" if THEME == "light" else "#1A1A17"
ELEVATED_BG = "#FFFDF6" if THEME == "light" else "#242420"
INK = "#1A1A17" if THEME == "light" else "#F0EFE8"
INK_SOFT = "#4A4A44" if THEME == "light" else "#B8B7B0"
INK_MUTED = "#6B6A63" if THEME == "light" else "#A8A79F"

# Imprint palette — canonical order, first series always #009E73
IMPRINT = ["#009E73", "#C475FD", "#4467A3", "#BD8233", "#AE3030", "#2ABCCD", "#954477", "#99B314"]

# ── Data ───────────────────────────────────────────────────────────────────
np.random.seed(42)

ideal_levels = np.array([-3, -1, 1, 3])
ideal_i, ideal_q = np.meshgrid(ideal_levels, ideal_levels)
ideal_i = ideal_i.ravel()
ideal_q = ideal_q.ravel()

n_symbols = 1200
symbol_indices = np.random.randint(0, 16, size=n_symbols)

snr_db = 20
noise_std = np.sqrt(5 / (10 ** (snr_db / 10)))

received_i = ideal_i[symbol_indices] + np.random.normal(0, noise_std, n_symbols)
received_q = ideal_q[symbol_indices] + np.random.normal(0, noise_std, n_symbols)

error_vectors = np.sqrt((received_i - ideal_i[symbol_indices]) ** 2 + (received_q - ideal_q[symbol_indices]) ** 2)
rms_signal = np.sqrt(np.mean(ideal_i**2 + ideal_q**2))
evm_pct = np.sqrt(np.mean(error_vectors**2)) / rms_signal * 100

# Vectorised quadrant labelling
qi_vals = ideal_i[symbol_indices]
qq_vals = ideal_q[symbol_indices]
quad_labels = np.where(
    (qi_vals > 0) & (qq_vals > 0),
    "Q1 (+I, +Q)",
    np.where(
        (qi_vals < 0) & (qq_vals > 0),
        "Q2 (−I, +Q)",
        np.where((qi_vals < 0) & (qq_vals < 0), "Q3 (−I, −Q)", "Q4 (+I, −Q)"),
    ),
)

df_received = pd.DataFrame({"In-Phase (I)": received_i, "Quadrature (Q)": received_q, "Quadrant": quad_labels})
df_ideal = pd.DataFrame({"In-Phase (I)": ideal_i, "Quadrature (Q)": ideal_q})

# ── Style ──────────────────────────────────────────────────────────────────
sns.set_theme(
    style="ticks",
    rc={
        "figure.facecolor": PAGE_BG,
        "axes.facecolor": PAGE_BG,
        "axes.edgecolor": INK_SOFT,
        "axes.labelcolor": INK,
        "text.color": INK,
        "xtick.color": INK_SOFT,
        "ytick.color": INK_SOFT,
        "grid.color": INK,
        "grid.alpha": 0.15,
        "legend.facecolor": ELEVATED_BG,
        "legend.edgecolor": INK_SOFT,
    },
)

# ── Canvas ─────────────────────────────────────────────────────────────────
fig, ax = plt.subplots(figsize=(6, 6), dpi=400)  # → 2400 × 2400 px (square)

# ── Decision boundaries ────────────────────────────────────────────────────
for b in [-2, 0, 2]:
    ax.axhline(y=b, color=INK_MUTED, linestyle="--", linewidth=0.8, alpha=0.45)
    ax.axvline(x=b, color=INK_MUTED, linestyle="--", linewidth=0.8, alpha=0.45)

# ── Quadrant ordering and palette ─────────────────────────────────────────
QUAD_ORDER = ["Q1 (+I, +Q)", "Q2 (−I, +Q)", "Q3 (−I, −Q)", "Q4 (+I, −Q)"]
QUAD_PALETTE = IMPRINT[:4]

# Clip regions per quadrant to prevent KDE bleed across decision boundaries
QUAD_CLIPS = [
    ((0, 4.5), (0, 4.5)),  # Q1: +I, +Q
    ((-4.5, 0), (0, 4.5)),  # Q2: −I, +Q
    ((-4.5, 0), (-4.5, 0)),  # Q3: −I, −Q
    ((0, 4.5), (-4.5, 0)),  # Q4: +I, −Q
]

# ── KDE density contours per quadrant ──────────────────────────────────────
for i, (quad, clip) in enumerate(zip(QUAD_ORDER, QUAD_CLIPS, strict=True)):
    subset = df_received[df_received["Quadrant"] == quad]
    sns.kdeplot(
        data=subset,
        x="In-Phase (I)",
        y="Quadrature (Q)",
        levels=3,
        color=QUAD_PALETTE[i],
        alpha=0.4,
        linewidths=1.0,
        clip=clip,
        ax=ax,
    )

# ── Received symbols ───────────────────────────────────────────────────────
sns.scatterplot(
    data=df_received,
    x="In-Phase (I)",
    y="Quadrature (Q)",
    hue="Quadrant",
    hue_order=QUAD_ORDER,
    palette=QUAD_PALETTE,
    alpha=0.45,
    s=20,
    edgecolor="none",
    ax=ax,
    legend=True,
)

# ── Ideal constellation markers ────────────────────────────────────────────
IDEAL_EDGE = "#FFFFFF" if THEME == "light" else "#000000"
sns.scatterplot(
    data=df_ideal,
    x="In-Phase (I)",
    y="Quadrature (Q)",
    color=INK,
    s=200,
    marker="X",
    edgecolor=IDEAL_EDGE,
    linewidth=1.2,
    ax=ax,
    legend=False,
    zorder=5,
)

# ── Chrome ─────────────────────────────────────────────────────────────────
ax.set_title(
    "scatter-constellation-diagram · python · seaborn · anyplot.ai", fontsize=12, fontweight="medium", color=INK, pad=10
)
ax.set_xlabel("In-Phase (I)", fontsize=10, color=INK)
ax.set_ylabel("Quadrature (Q)", fontsize=10, color=INK)
ax.tick_params(axis="both", labelsize=8, colors=INK_SOFT)

ax.set_xlim(-4.5, 4.5)
ax.set_ylim(-4.5, 4.5)
ax.set_aspect("equal")

ax.spines["top"].set_visible(False)
ax.spines["right"].set_visible(False)

# ── Legend ─────────────────────────────────────────────────────────────────
legend = ax.legend(
    title="Quadrant",
    title_fontsize=8,
    fontsize=7,
    loc="lower right",
    framealpha=0.9,
    edgecolor=INK_SOFT,
    markerscale=1.5,
)
legend.get_title().set_color(INK)
for text in legend.get_texts():
    text.set_color(INK_SOFT)

# ── EVM annotation ─────────────────────────────────────────────────────────
ax.text(
    0.97,
    0.97,
    f"EVM = {evm_pct:.1f}%",
    transform=ax.transAxes,
    fontsize=9,
    fontweight="medium",
    ha="right",
    va="top",
    color=INK,
    bbox={"boxstyle": "round,pad=0.4", "facecolor": ELEVATED_BG, "edgecolor": INK_SOFT, "alpha": 0.9},
)

# ── Save ───────────────────────────────────────────────────────────────────
plt.savefig(f"plot-{THEME}.png", dpi=400, facecolor=PAGE_BG)
plt.close()
Runnable source as JSON, for any HTTP client: https://api.anyplot.ai/specs/scatter-constellation-diagram/seaborn/code. Any spec id and library id listed in llms-full.txt fit the same URL shape; every URL below is complete and callable.
{
  "spec_id": "scatter-constellation-diagram",
  "language": "python",
  "library": "seaborn",
  "page": "https://anyplot.ai/scatter-constellation-diagram/python/seaborn",
  "hub": "https://anyplot.ai/scatter-constellation-diagram",
  "code_json": "https://api.anyplot.ai/specs/scatter-constellation-diagram/seaborn/code",
  "spec_json": "https://api.anyplot.ai/specs/scatter-constellation-diagram",
  "render_light_png": "https://storage.googleapis.com/anyplot-images/plots/scatter-constellation-diagram/python/seaborn/plot-light.png",
  "render_dark_png": "https://storage.googleapis.com/anyplot-images/plots/scatter-constellation-diagram/python/seaborn/plot-dark.png",
  "quality_score": 89.0,
  "license": "MIT",
  "guide": "https://anyplot.ai/llms.txt"
}
Part of Digital Modulation Constellation Diagram on anyplot.ai.