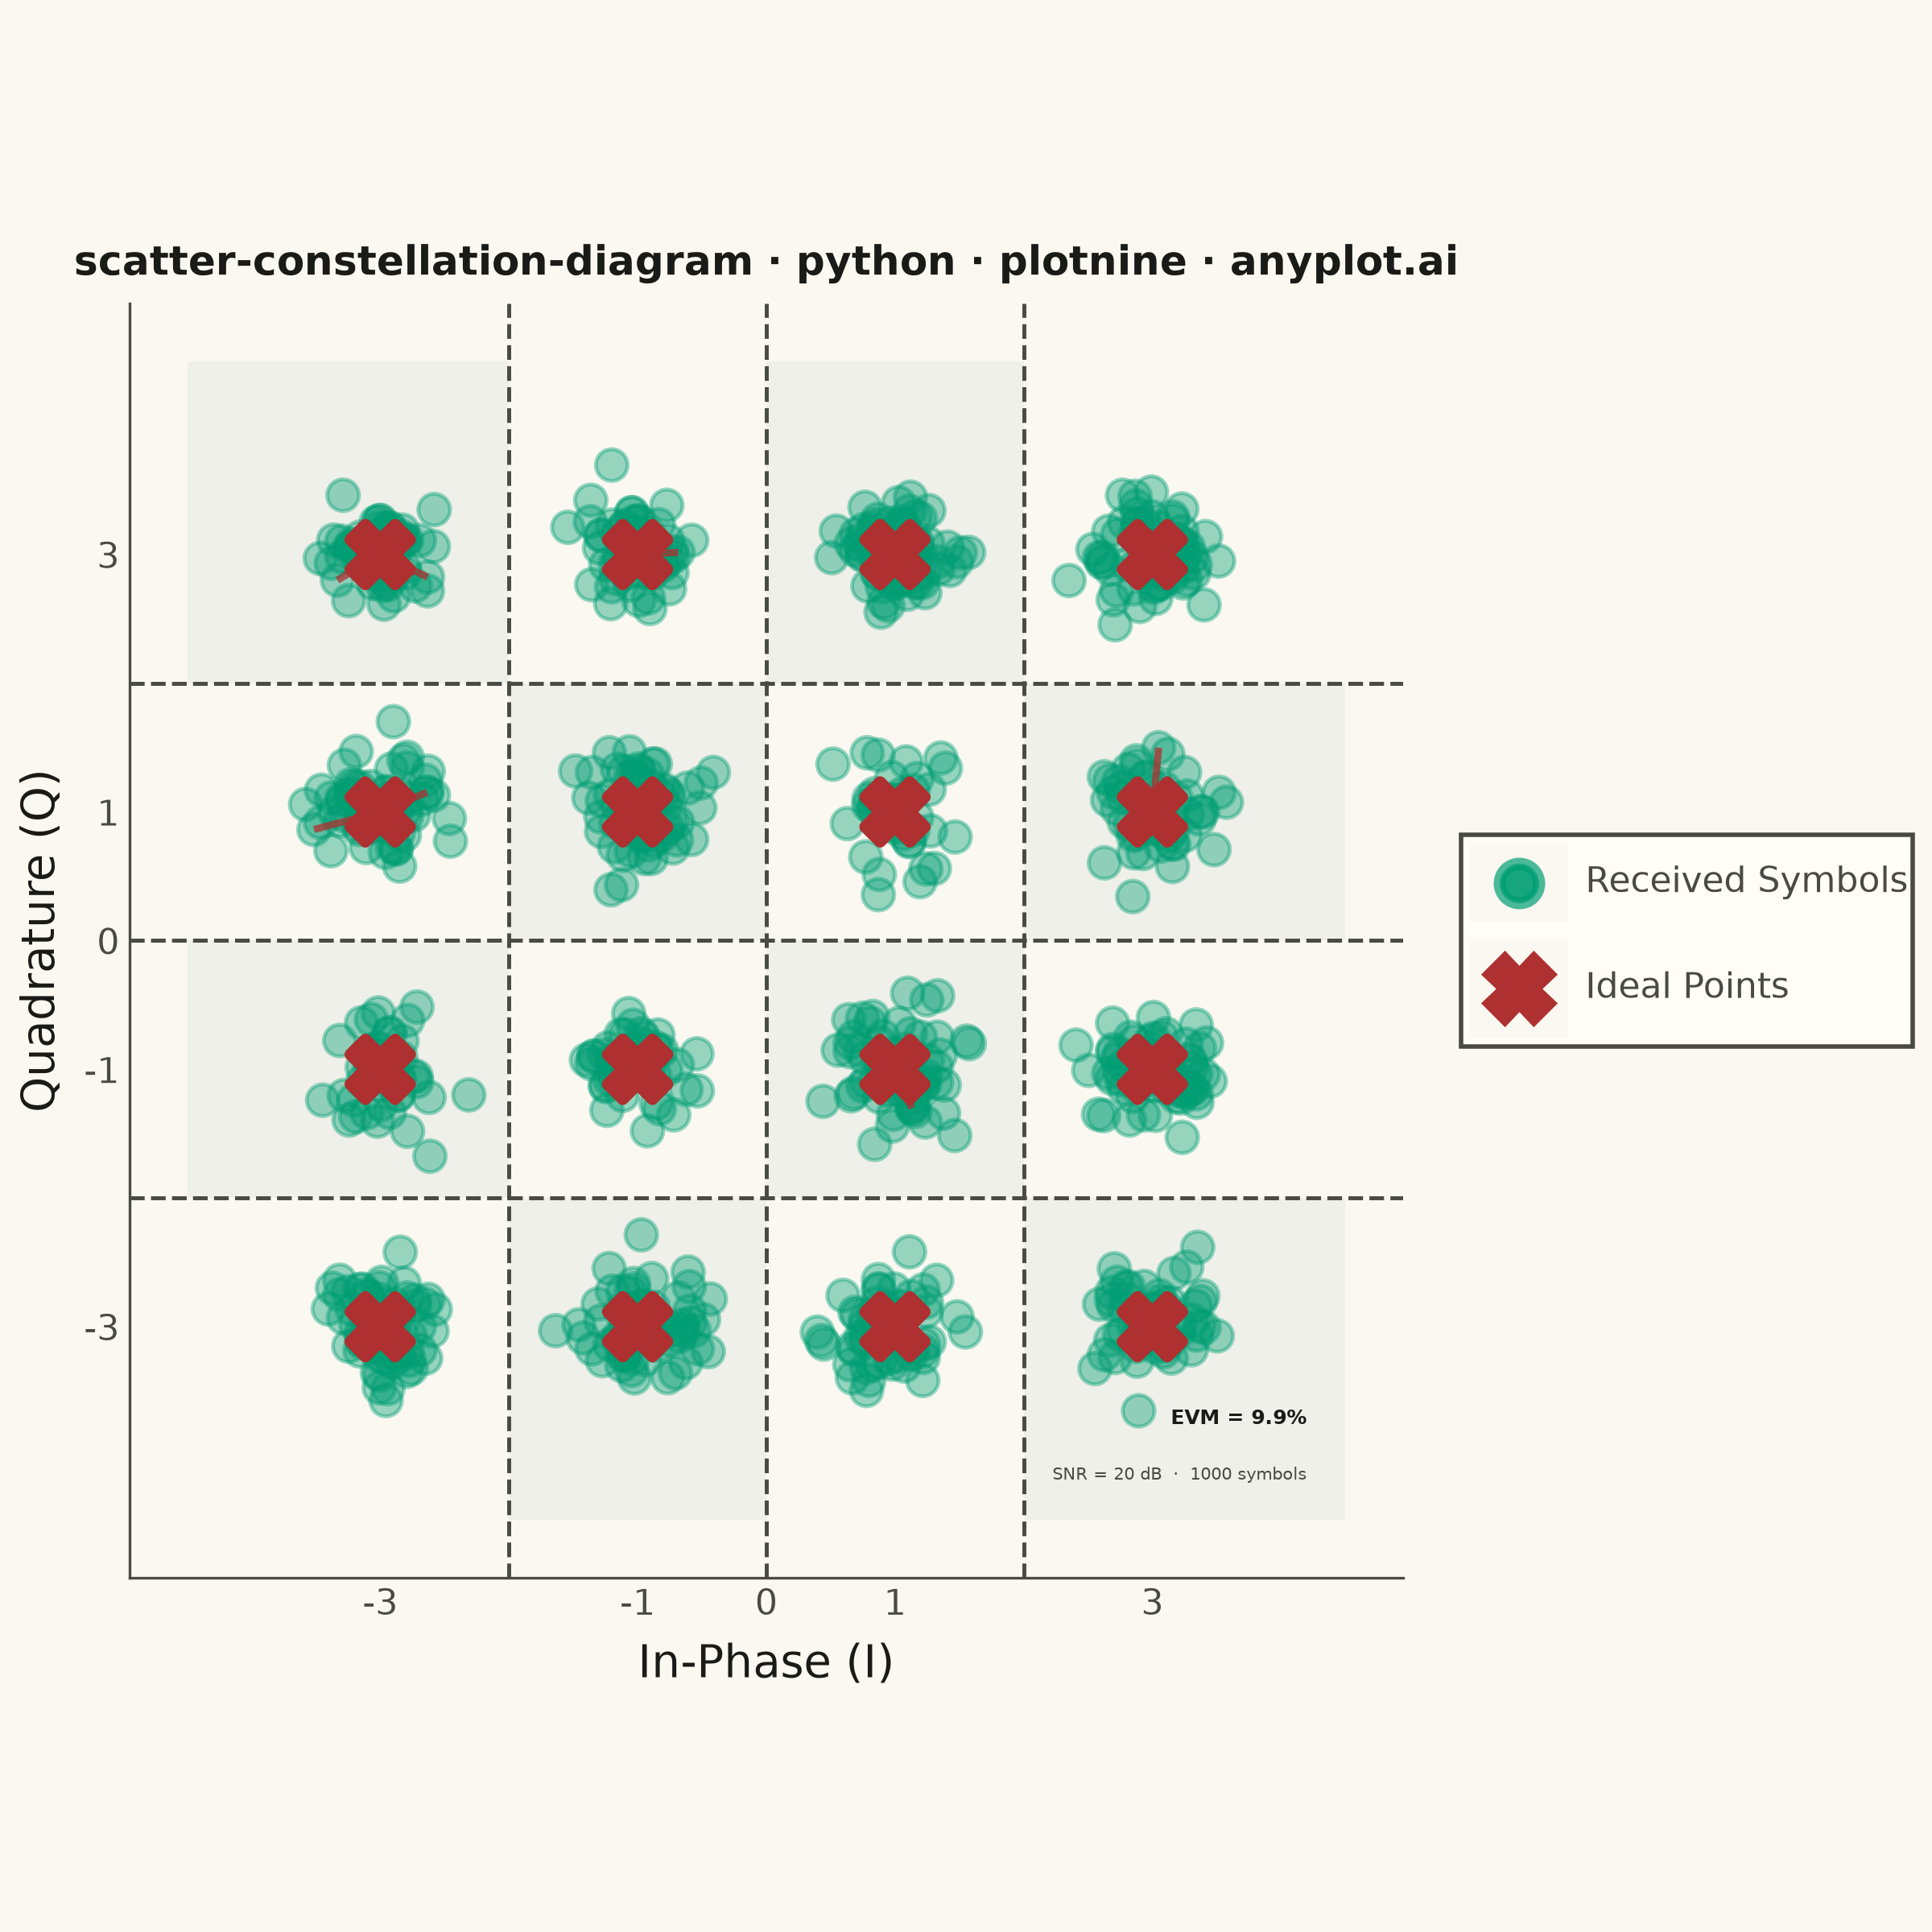
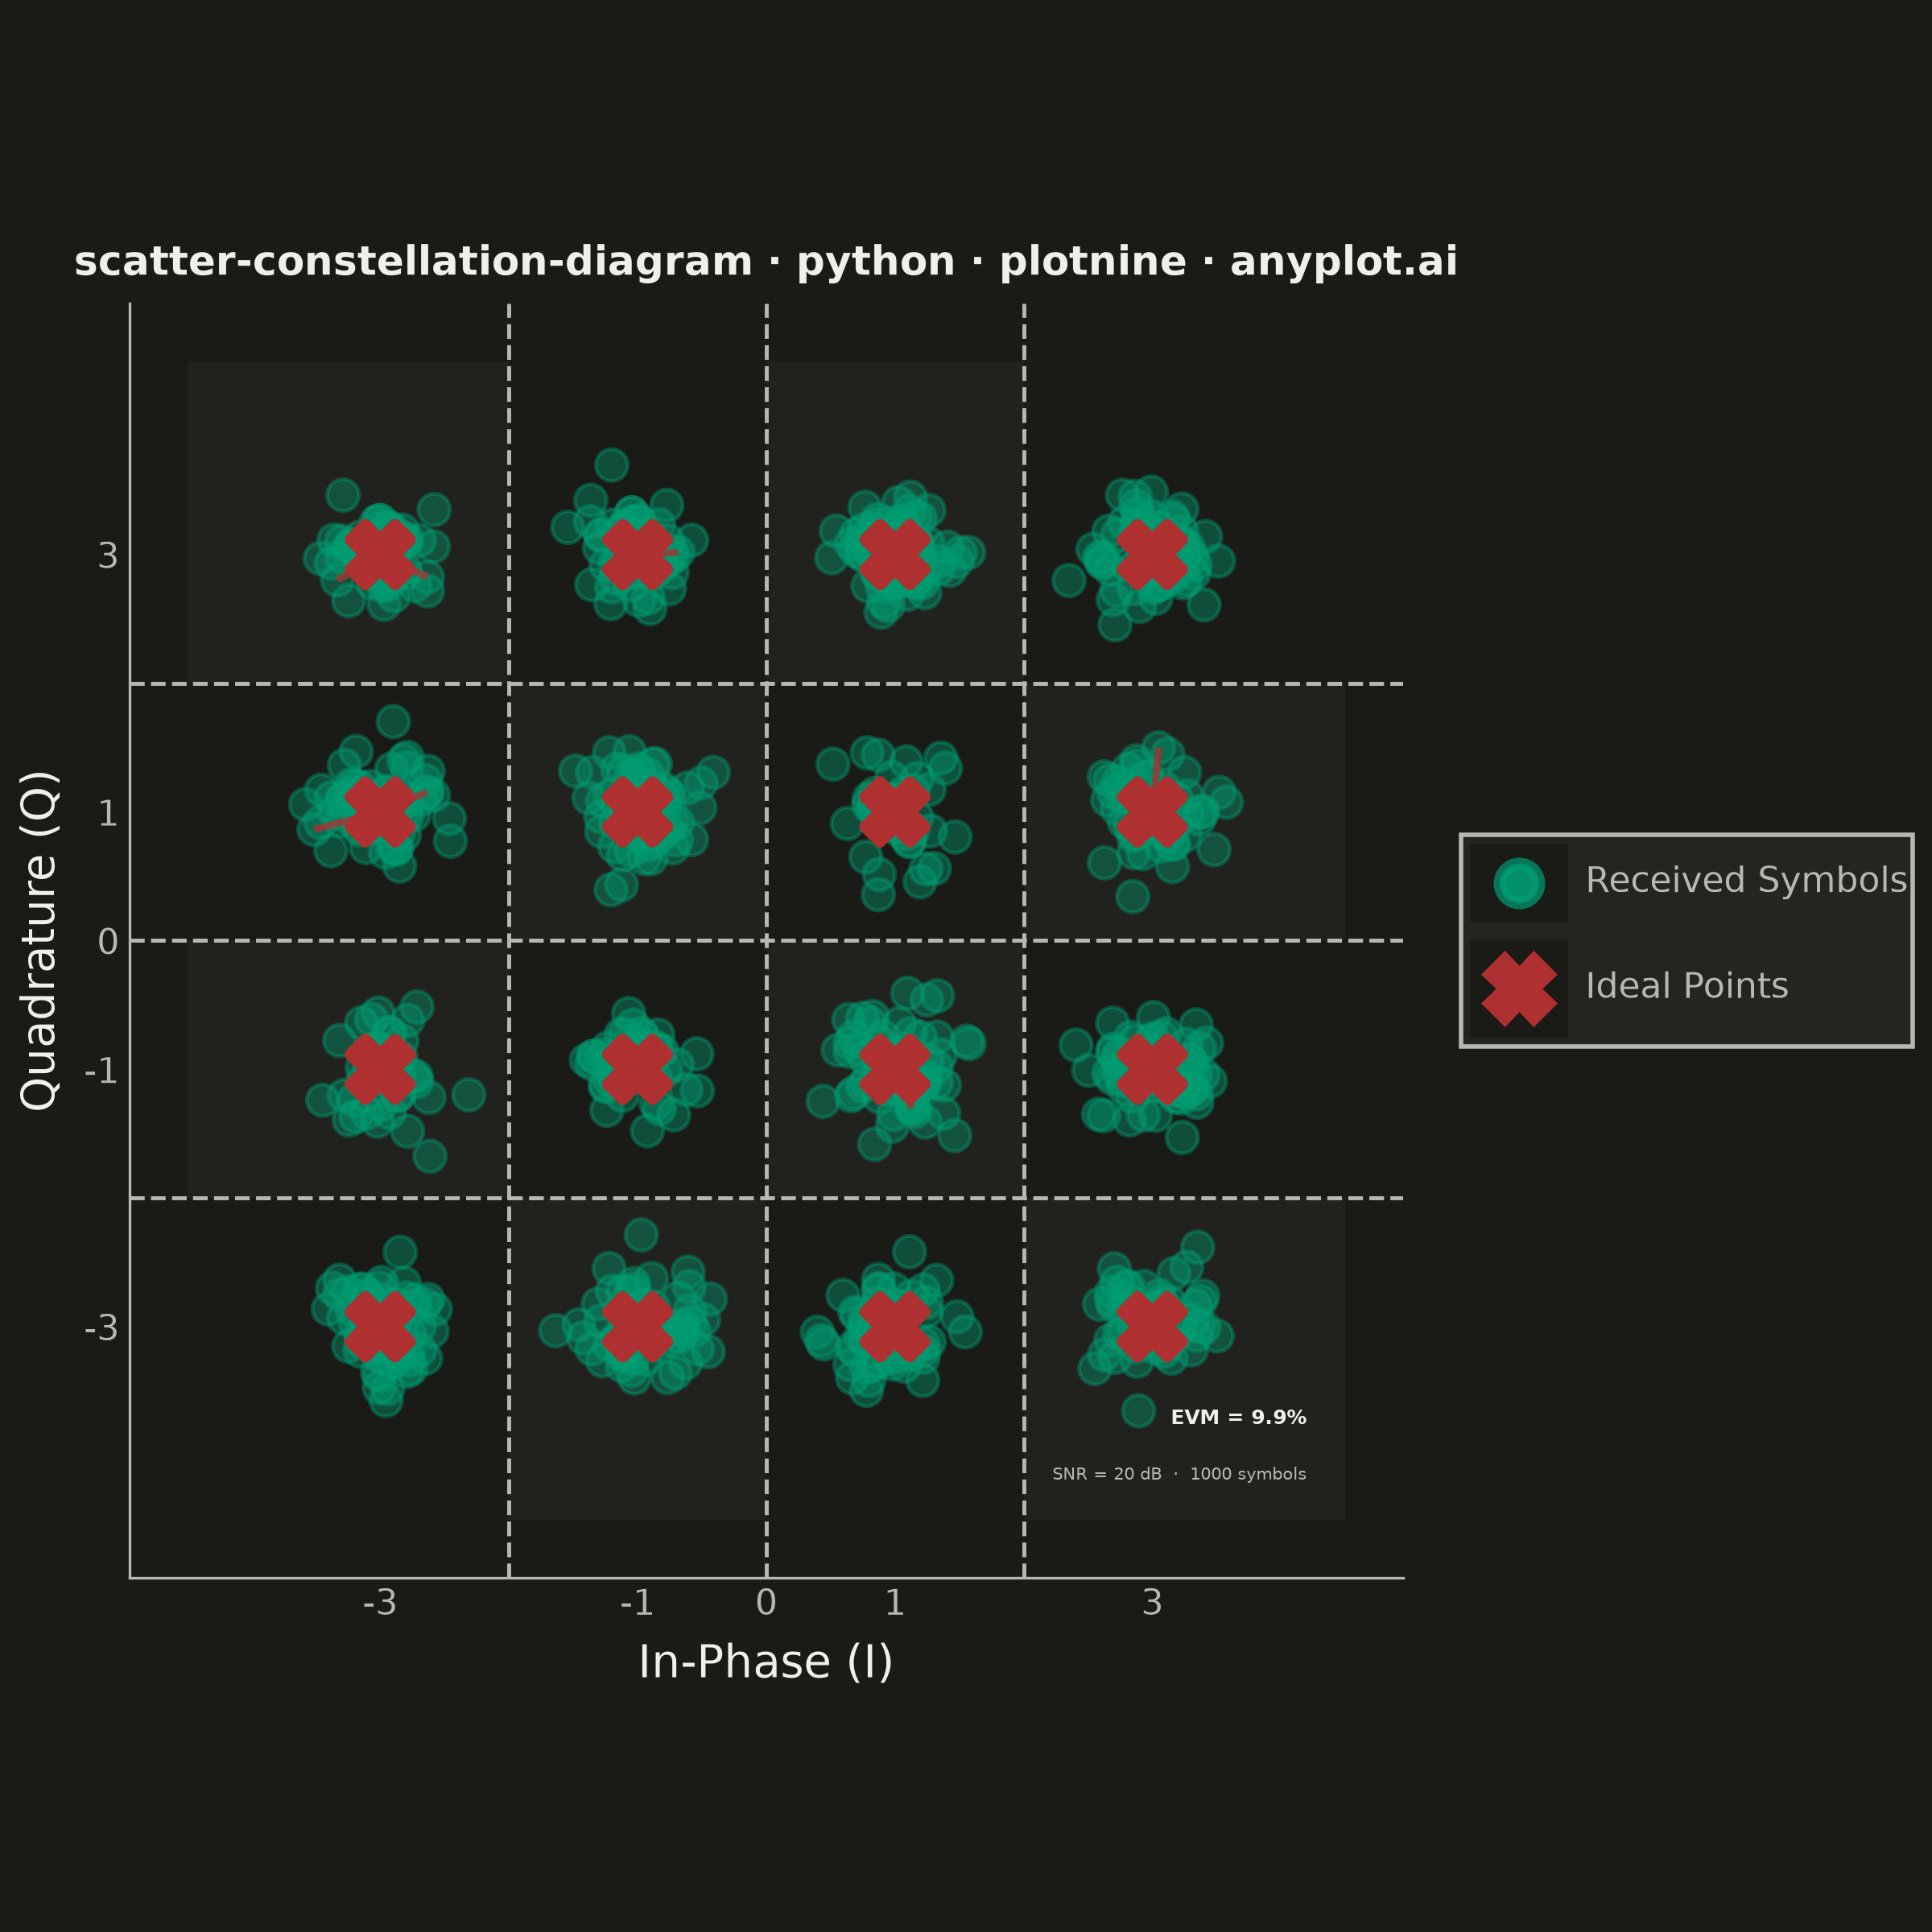
An I/Q (In-phase/Quadrature) scatter plot showing symbol positions of a digitally modulated signal. Ideal constellation points are displayed as reference markers with received symbols scattered around them, revealing modulation quality and signal impairments such as noise, phase offset, and amplitude distortion. This plot is the standard diagnostic tool for evaluating digital modulation schemes like 16-QAM.
""" anyplot.ai
scatter-constellation-diagram: Digital Modulation Constellation Diagram
Library: plotnine 0.15.7 | Python 3.13.13
Quality: 88/100 | Updated: 2026-06-18
"""

import os
import sys


# Remove this script's own directory from sys.path to prevent it from
# shadowing the installed plotnine library when run as `python plotnine.py`.
sys.path = [p for p in sys.path if os.path.abspath(p or ".") != os.path.dirname(os.path.abspath(__file__))]

import numpy as np
import pandas as pd
from plotnine import (
    aes,
    annotate,
    coord_fixed,
    element_blank,
    element_line,
    element_rect,
    element_text,
    geom_hline,
    geom_point,
    geom_rect,
    geom_segment,
    geom_vline,
    ggplot,
    guide_legend,
    guides,
    labs,
    scale_color_manual,
    scale_x_continuous,
    scale_y_continuous,
    theme,
    theme_minimal,
)


# Theme tokens — Imprint palette
THEME = os.getenv("ANYPLOT_THEME", "light")
PAGE_BG = "#FAF8F1" if THEME == "light" else "#1A1A17"
ELEVATED_BG = "#FFFDF6" if THEME == "light" else "#242420"
INK = "#1A1A17" if THEME == "light" else "#F0EFE8"
INK_SOFT = "#4A4A44" if THEME == "light" else "#B8B7B0"
INK_MUTED = "#6B6A63" if THEME == "light" else "#A8A79F"

# Imprint palette — received symbols use position 1 (brand green); ideal points use matte red (semantic: target reference)
RECEIVED_COLOR = "#009E73"  # Imprint position 1 — always first series
IDEAL_COLOR = "#AE3030"  # Imprint matte red — ideal reference markers

# Data
np.random.seed(42)

ideal_coords = [-3, -1, 1, 3]
ideal_i = np.array([i for i in ideal_coords for _ in ideal_coords])
ideal_q = np.array([q for _ in ideal_coords for q in ideal_coords])

n_symbols = 1000
snr_db = 20
snr_linear = 10 ** (snr_db / 10)
avg_power = np.mean(ideal_i**2 + ideal_q**2)
noise_std = np.sqrt(avg_power / (2 * snr_linear))

symbol_indices = np.random.randint(0, 16, size=n_symbols)
received_i = ideal_i[symbol_indices] + np.random.normal(0, noise_std, n_symbols)
received_q = ideal_q[symbol_indices] + np.random.normal(0, noise_std, n_symbols)

error_i = received_i - ideal_i[symbol_indices]
error_q = received_q - ideal_q[symbol_indices]
evm = np.sqrt(np.mean(error_i**2 + error_q**2)) / np.sqrt(avg_power) * 100

df_received = pd.DataFrame({"i": received_i, "q": received_q, "series": "Received Symbols"})
df_ideal = pd.DataFrame({"i": ideal_i, "q": ideal_q, "series": "Ideal Points"})

# Decision region shading — CHECKER_ALT provides more visible contrast than ELEVATED_BG in light mode
CHECKER_ALT = "#EDEEE7" if THEME == "light" else ELEVATED_BG
region_edges = [-4.5, -2, 0, 2, 4.5]
rects = []
for ri, xmin in enumerate(region_edges[:-1]):
    for ci, ymin in enumerate(region_edges[:-1]):
        rects.append(
            {
                "xmin": xmin,
                "xmax": region_edges[ri + 1],
                "ymin": ymin,
                "ymax": region_edges[ci + 1],
                "shade": PAGE_BG if (ri + ci) % 2 == 0 else CHECKER_ALT,
            }
        )
df_rects = pd.DataFrame(rects)

# Decision boundaries at ±2 and 0
boundary_vals = [-2, 0, 2]

# Error vector samples — connect ideal to received for visual storytelling
rng = np.random.default_rng(42)
ev_idx = rng.choice(n_symbols, size=12, replace=False)
df_ev = pd.DataFrame(
    {
        "i_start": ideal_i[symbol_indices[ev_idx]],
        "q_start": ideal_q[symbol_indices[ev_idx]],
        "i_end": received_i[ev_idx],
        "q_end": received_q[ev_idx],
    }
)

# Title — 62 chars; reduce to 9pt to prevent overflow with right legend narrowing the panel
title = "scatter-constellation-diagram · python · plotnine · anyplot.ai"
title_size = 9

COLOR_MAP = {"Received Symbols": RECEIVED_COLOR, "Ideal Points": IDEAL_COLOR}

# Plot
plot = (
    ggplot(df_received, aes(x="i", y="q"))
    # Decision region shading
    + geom_rect(
        data=df_rects,
        mapping=aes(xmin="xmin", xmax="xmax", ymin="ymin", ymax="ymax"),
        fill=df_rects["shade"].tolist(),
        alpha=0.8,
        inherit_aes=False,
        show_legend=False,
    )
    # Decision boundary lines
    + geom_vline(xintercept=boundary_vals, linetype="dashed", color=INK_SOFT, size=0.5, show_legend=False)
    + geom_hline(yintercept=boundary_vals, linetype="dashed", color=INK_SOFT, size=0.5, show_legend=False)
    # Received symbols
    + geom_point(data=df_received, mapping=aes(x="i", y="q", color="series"), alpha=0.4, size=3.5)
    # Error vectors — made more prominent to highlight signal impairment
    + geom_segment(
        data=df_ev,
        mapping=aes(x="i_start", y="q_start", xend="i_end", yend="q_end"),
        color=IDEAL_COLOR,
        alpha=0.75,
        size=0.9,
        inherit_aes=False,
        show_legend=False,
    )
    # Ideal constellation points (X markers)
    + geom_point(data=df_ideal, mapping=aes(x="i", y="q", color="series"), shape="X", stroke=1.5, alpha=1.0, size=6.0)
    + scale_color_manual(values=COLOR_MAP)
    + guides(color=guide_legend(override_aes={"shape": ["o", "X"], "size": [3.5, 6.0], "alpha": [0.7, 1.0]}))
    # Tick positions at constellation coordinate values
    + scale_x_continuous(breaks=[-3, -1, 0, 1, 3], minor_breaks=[])
    + scale_y_continuous(breaks=[-3, -1, 0, 1, 3], minor_breaks=[])
    # EVM and SNR annotations
    + annotate("text", x=4.2, y=-3.7, label=f"EVM = {evm:.1f}%", size=4.5, ha="right", color=INK, fontweight="bold")
    + annotate(
        "text", x=4.2, y=-4.15, label=f"SNR = {snr_db} dB  ·  {n_symbols} symbols", size=3.8, ha="right", color=INK_SOFT
    )
    + coord_fixed(ratio=1, xlim=(-4.5, 4.5), ylim=(-4.5, 4.5))
    + labs(x="In-Phase (I)", y="Quadrature (Q)", title=title)
    + theme_minimal()
    + theme(
        figure_size=(6, 6),
        plot_background=element_rect(fill=PAGE_BG, color=PAGE_BG),
        panel_background=element_rect(fill=PAGE_BG),
        plot_title=element_text(size=title_size, weight="bold", ha="center", color=INK),
        axis_title=element_text(size=10, color=INK),
        axis_text=element_text(size=8, color=INK_SOFT),
        panel_grid_major=element_blank(),
        panel_grid_minor=element_blank(),
        axis_line=element_line(color=INK_SOFT, size=0.6),
        legend_position="right",
        legend_background=element_rect(fill=ELEVATED_BG, color=INK_SOFT),
        legend_text=element_text(size=8, color=INK_SOFT),
        legend_title=element_blank(),
        legend_key=element_rect(fill=PAGE_BG),
    )
)

# Save
plot.save(f"plot-{THEME}.png", dpi=400, width=6, height=6, units="in", verbose=False)
Runnable source as JSON, for any HTTP client: https://api.anyplot.ai/specs/scatter-constellation-diagram/plotnine/code. Any spec id and library id listed in llms-full.txt fit the same URL shape; every URL below is complete and callable.
{
  "spec_id": "scatter-constellation-diagram",
  "language": "python",
  "library": "plotnine",
  "page": "https://anyplot.ai/scatter-constellation-diagram/python/plotnine",
  "hub": "https://anyplot.ai/scatter-constellation-diagram",
  "code_json": "https://api.anyplot.ai/specs/scatter-constellation-diagram/plotnine/code",
  "spec_json": "https://api.anyplot.ai/specs/scatter-constellation-diagram",
  "render_light_png": "https://storage.googleapis.com/anyplot-images/plots/scatter-constellation-diagram/python/plotnine/plot-light.png",
  "render_dark_png": "https://storage.googleapis.com/anyplot-images/plots/scatter-constellation-diagram/python/plotnine/plot-dark.png",
  "quality_score": 88.0,
  "license": "MIT",
  "guide": "https://anyplot.ai/llms.txt"
}
Part of Digital Modulation Constellation Diagram on anyplot.ai.