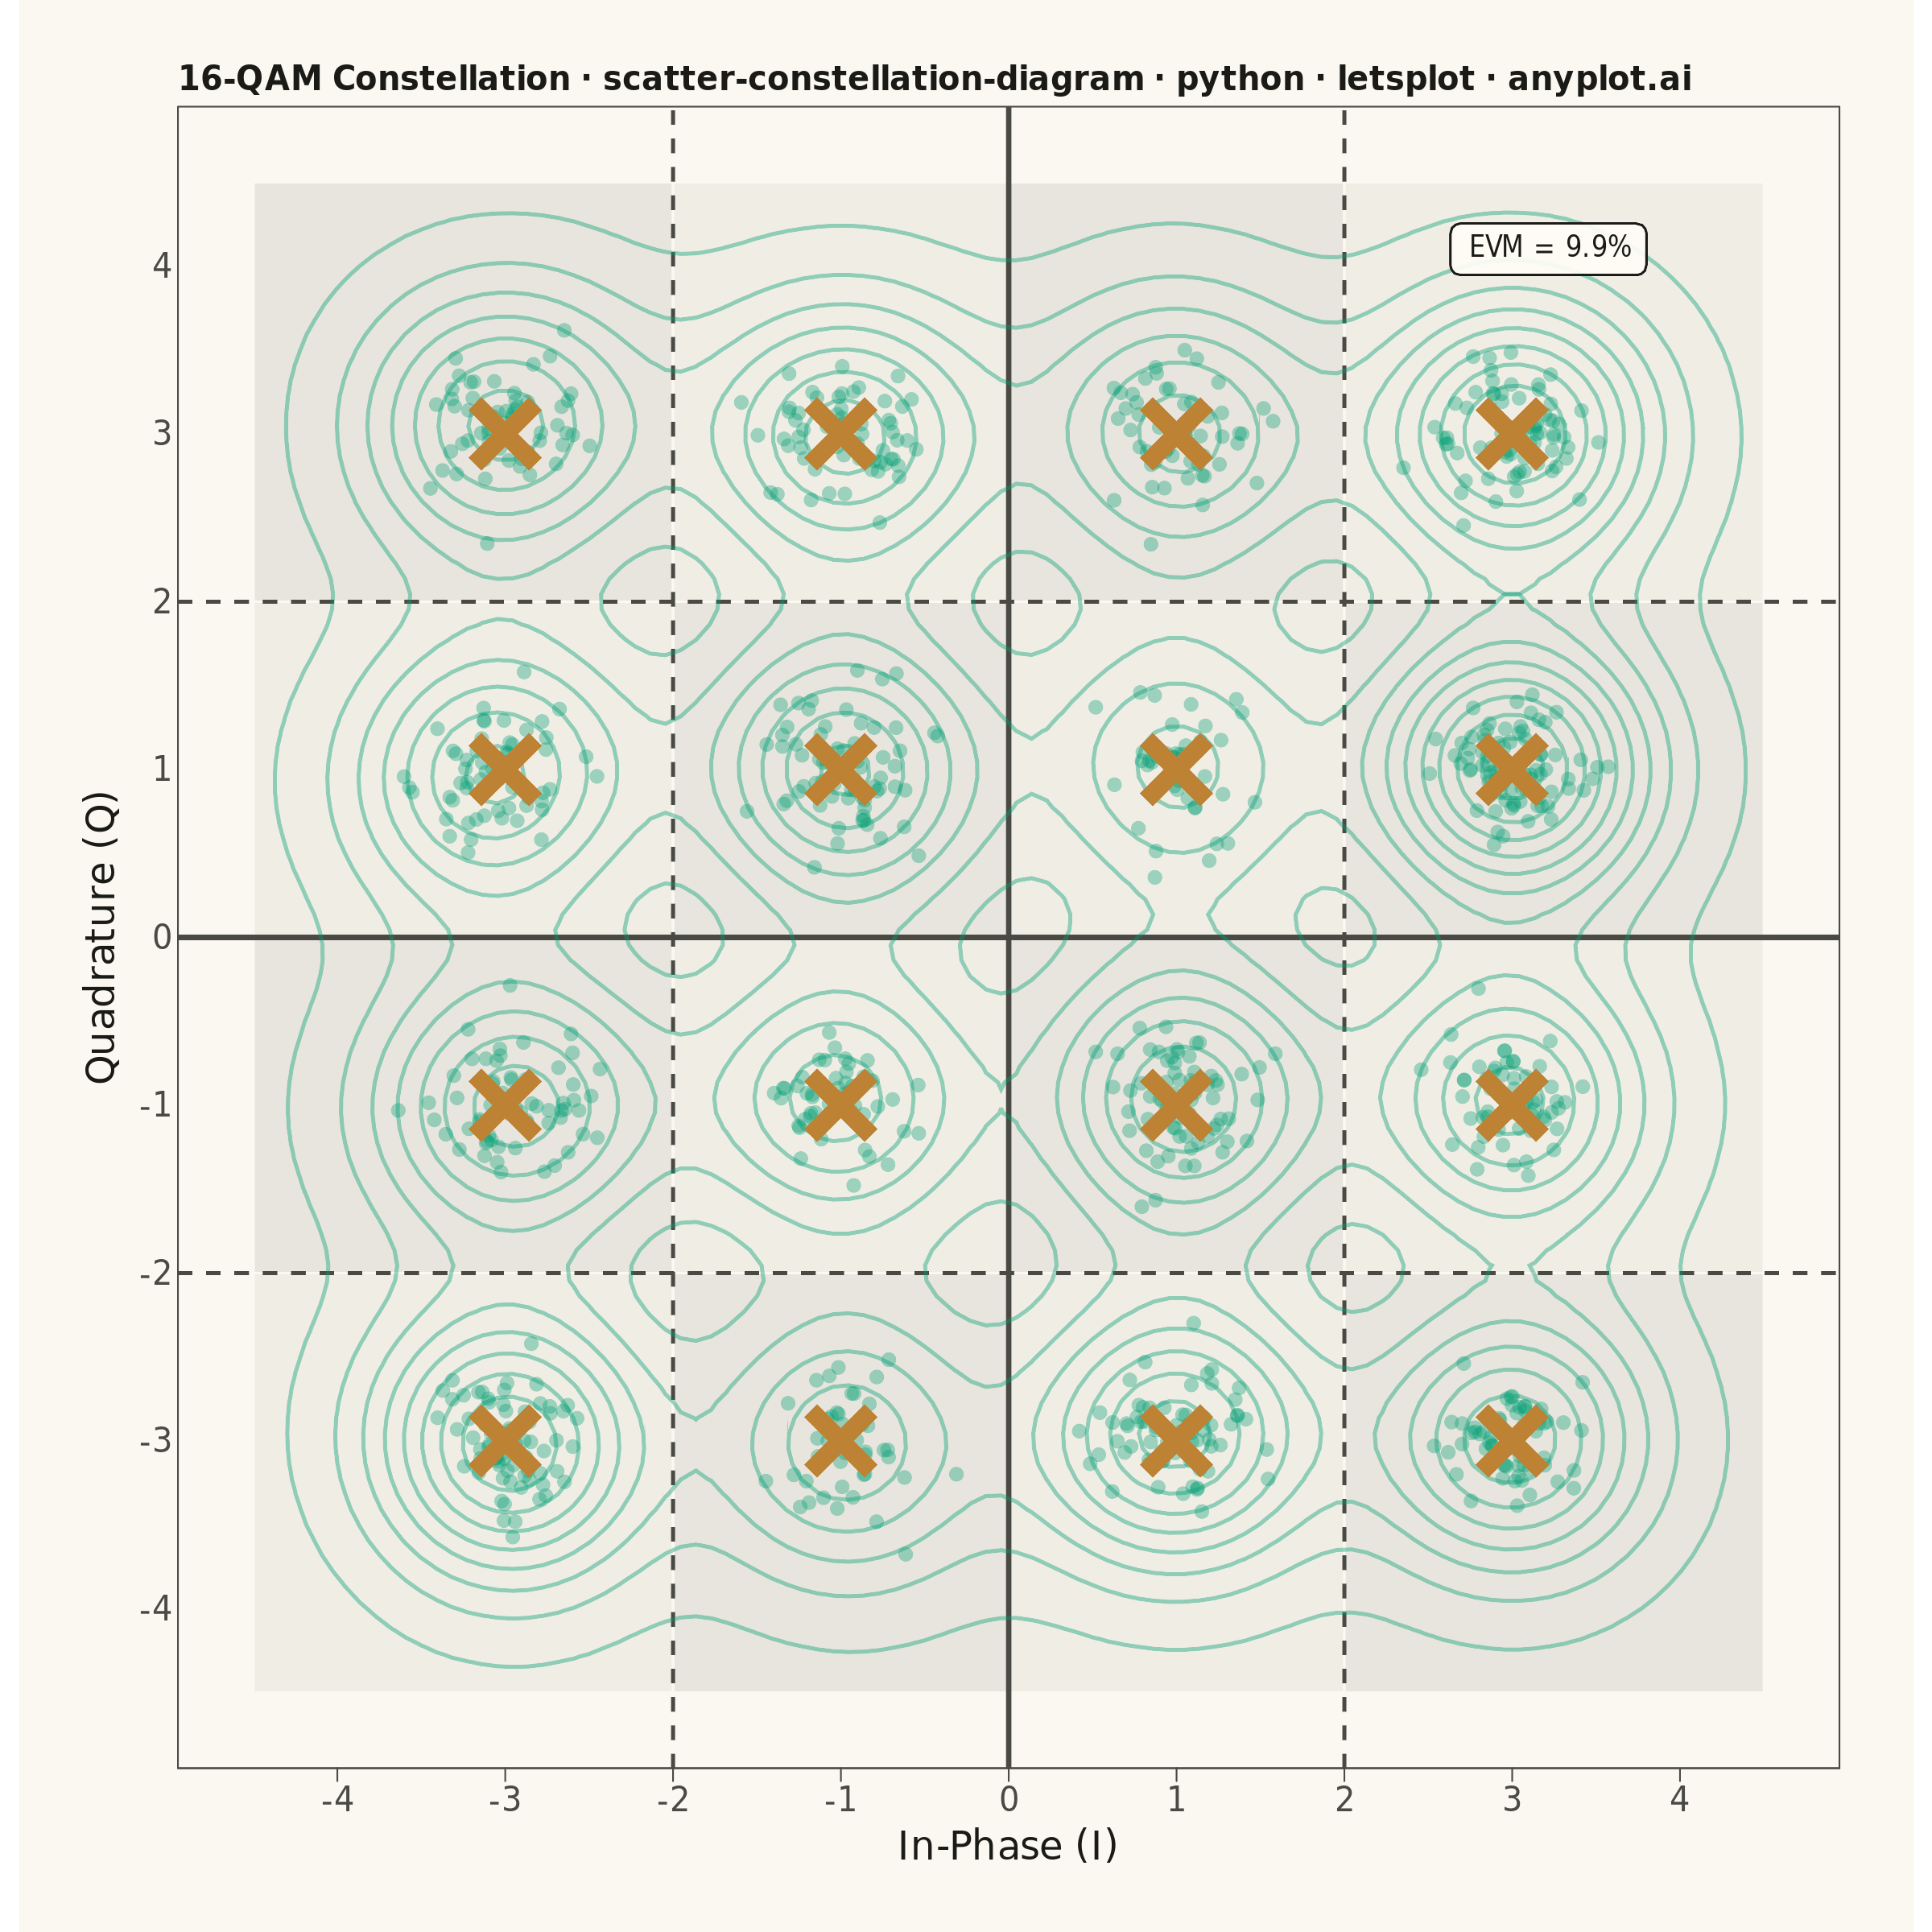
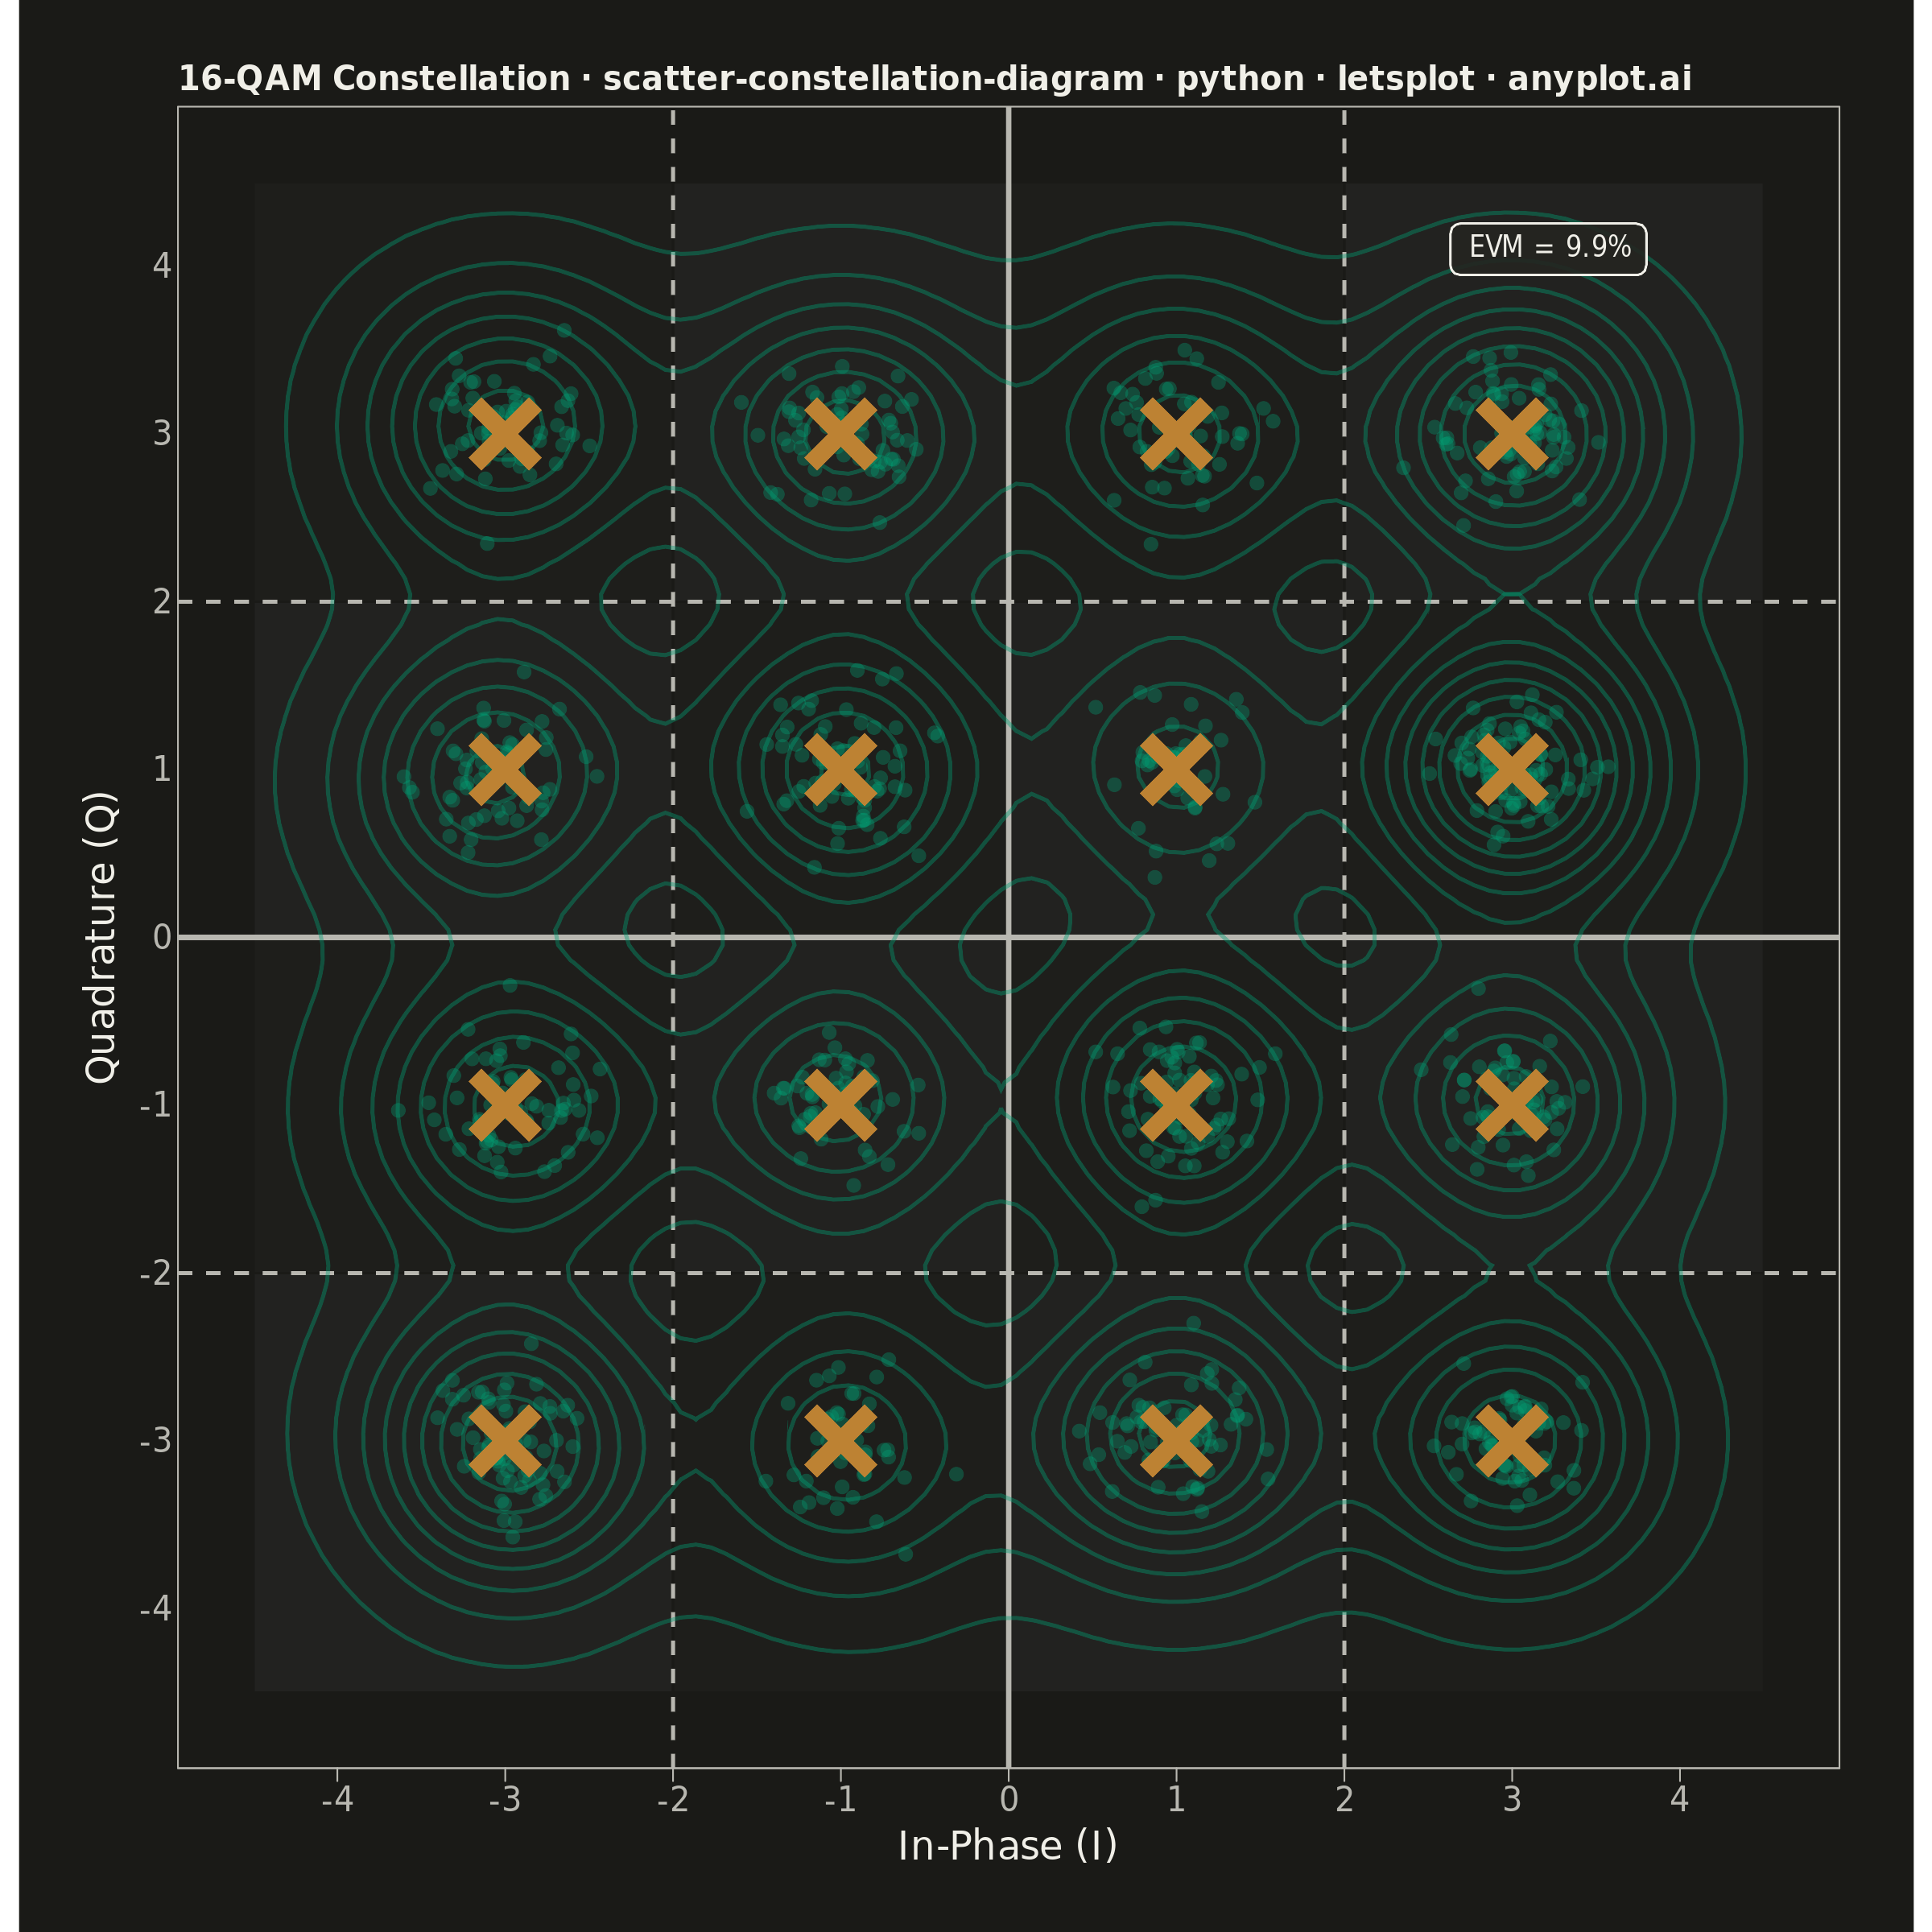
An I/Q (In-phase/Quadrature) scatter plot showing symbol positions of a digitally modulated signal. Ideal constellation points are displayed as reference markers with received symbols scattered around them, revealing modulation quality and signal impairments such as noise, phase offset, and amplitude distortion. This plot is the standard diagnostic tool for evaluating digital modulation schemes like 16-QAM.
""" anyplot.ai
scatter-constellation-diagram: Digital Modulation Constellation Diagram
Library: letsplot 4.10.1 | Python 3.13.14
Quality: 91/100 | Updated: 2026-06-18
"""

import os

import numpy as np
import pandas as pd
from lets_plot import *
from lets_plot.export import ggsave as export_ggsave


LetsPlot.setup_html()

# Theme tokens (Imprint palette)
THEME = os.getenv("ANYPLOT_THEME", "light")
PAGE_BG = "#FAF8F1" if THEME == "light" else "#1A1A17"
ELEVATED_BG = "#FFFDF6" if THEME == "light" else "#242420"
INK = "#1A1A17" if THEME == "light" else "#F0EFE8"
INK_SOFT = "#4A4A44" if THEME == "light" else "#B8B7B0"

RECEIVED_COLOR = "#009E73"  # Imprint position 1 — received symbols (primary data)
IDEAL_COLOR = "#BD8233"  # Imprint position 4 ochre — ideal markers (colorblind-safe)

# Data
np.random.seed(42)

# 16-QAM ideal constellation points on a 4x4 grid at +/-1, +/-3
grid_vals = np.array([-3, -1, 1, 3])
ideal_i, ideal_q = np.meshgrid(grid_vals, grid_vals)
ideal_i = ideal_i.flatten()
ideal_q = ideal_q.flatten()

# Generate received symbols with additive Gaussian noise (~20 dB SNR)
n_symbols = 1000
symbol_indices = np.random.randint(0, 16, n_symbols)
snr_db = 20
signal_power = np.mean(ideal_i**2 + ideal_q**2)
noise_std = np.sqrt(signal_power / (2 * 10 ** (snr_db / 10)))

received_i = ideal_i[symbol_indices] + np.random.normal(0, noise_std, n_symbols)
received_q = ideal_q[symbol_indices] + np.random.normal(0, noise_std, n_symbols)

# Compute EVM
error_vectors = np.sqrt((received_i - ideal_i[symbol_indices]) ** 2 + (received_q - ideal_q[symbol_indices]) ** 2)
rms_reference = np.sqrt(np.mean(ideal_i**2 + ideal_q**2))
evm_percent = np.sqrt(np.mean(error_vectors**2)) / rms_reference * 100

# DataFrames
received_df = pd.DataFrame({"I": received_i, "Q": received_q})
ideal_df = pd.DataFrame({"I": ideal_i, "Q": ideal_q})

# Decision boundary rectangles — theme-adaptive shading
if THEME == "light":
    colors_alt = ["#F0EDE5", "#E8E5DE"]
else:
    colors_alt = ["#222220", "#1E1E1B"]

rects = []
boundary_edges = [-4.5, -2, 0, 2, 4.5]
for ri, (y0, y1) in enumerate(zip(boundary_edges[:-1], boundary_edges[1:], strict=True)):
    for ci, (x0, x1) in enumerate(zip(boundary_edges[:-1], boundary_edges[1:], strict=True)):
        rects.append({"xmin": x0, "xmax": x1, "ymin": y0, "ymax": y1, "fill": colors_alt[(ri + ci) % 2]})
rects_df = pd.DataFrame(rects)

# Decision boundary line positions
boundary_vals = np.array([-2, 0, 2])
boundary_v = pd.DataFrame({"x": boundary_vals})
boundary_h = pd.DataFrame({"y": boundary_vals})

# EVM annotation
evm_df = pd.DataFrame({"x": [3.8], "y": [4.1], "label": [f"EVM = {evm_percent:.1f}%"]})

# Custom tick positions at constellation grid values
tick_vals = [-4, -3, -2, -1, 0, 1, 2, 3, 4]

# Title with scaled font size — calibrated for ggsize(600,600)
title = "16-QAM Constellation · scatter-constellation-diagram · python · letsplot · anyplot.ai"
title_size = max(9, round(13 * 67 / len(title)))

# Plot
plot = (
    ggplot()
    # Shaded decision regions
    + geom_rect(
        data=rects_df,
        mapping=aes(xmin="xmin", xmax="xmax", ymin="ymin", ymax="ymax", fill="fill"),
        alpha=1.0,
        color=PAGE_BG,
        size=0.3,
    )
    + scale_fill_identity()
    # Decision boundary lines
    + geom_vline(
        data=boundary_v,
        mapping=aes(xintercept="x"),
        linetype="dashed",
        color=INK_SOFT,
        size=0.5,
    )
    + geom_hline(
        data=boundary_h,
        mapping=aes(yintercept="y"),
        linetype="dashed",
        color=INK_SOFT,
        size=0.5,
    )
    # Axis lines through origin
    + geom_hline(yintercept=0, color=INK_SOFT, size=0.7)
    + geom_vline(xintercept=0, color=INK_SOFT, size=0.7)
    # 2D density contours — lets-plot stat showing cluster density of received symbols
    + geom_density2d(
        data=received_df,
        mapping=aes(x="I", y="Q"),
        color=RECEIVED_COLOR,
        alpha=0.4,
        size=0.5,
    )
    # Received symbols
    + geom_point(
        data=received_df,
        mapping=aes(x="I", y="Q"),
        color=RECEIVED_COLOR,
        size=2.0,
        alpha=0.35,
    )
    # Ideal constellation markers (cross shape, Imprint ochre — colorblind-safe)
    + geom_point(
        data=ideal_df,
        mapping=aes(x="I", y="Q"),
        color=IDEAL_COLOR,
        size=7,
        shape=4,
        stroke=2.5,
    )
    # EVM annotation with lets-plot geom_label styling
    + geom_label(
        data=evm_df,
        mapping=aes(x="x", y="y", label="label"),
        size=4,
        color=INK,
        fill=ELEVATED_BG,
        alpha=0.9,
        hjust=1,
        label_padding=0.5,
        label_r=0.2,
        label_size=0.6,
    )
    + labs(
        x="In-Phase (I)", y="Quadrature (Q)", title=title
    )
    + coord_fixed()
    + scale_x_continuous(limits=[-4.5, 4.5], breaks=tick_vals)
    + scale_y_continuous(limits=[-4.5, 4.5], breaks=tick_vals)
    + ggsize(600, 600)
    + theme(
        plot_title=element_text(size=title_size, color=INK, face="bold"),
        axis_title=element_text(size=12, color=INK),
        axis_text=element_text(size=10, color=INK_SOFT),
        panel_background=element_rect(fill=PAGE_BG, color=INK_SOFT, size=0.5),
        plot_background=element_rect(fill=PAGE_BG),
        panel_grid_major=element_blank(),
        panel_grid_minor=element_blank(),
        axis_ticks=element_line(color=INK_SOFT, size=0.5),
        axis_line=element_line(color=INK_SOFT, size=0.5),
        plot_margin=[20, 20, 20, 20],
    )
)

# Save
export_ggsave(plot, filename=f"plot-{THEME}.png", path=".", scale=4)
export_ggsave(plot, filename=f"plot-{THEME}.html", path=".")
Runnable source as JSON, for any HTTP client: https://api.anyplot.ai/specs/scatter-constellation-diagram/letsplot/code. Any spec id and library id listed in llms-full.txt fit the same URL shape; every URL below is complete and callable.
{
  "spec_id": "scatter-constellation-diagram",
  "language": "python",
  "library": "letsplot",
  "page": "https://anyplot.ai/scatter-constellation-diagram/python/letsplot",
  "hub": "https://anyplot.ai/scatter-constellation-diagram",
  "code_json": "https://api.anyplot.ai/specs/scatter-constellation-diagram/letsplot/code",
  "spec_json": "https://api.anyplot.ai/specs/scatter-constellation-diagram",
  "render_light_png": "https://storage.googleapis.com/anyplot-images/plots/scatter-constellation-diagram/python/letsplot/plot-light.png",
  "render_dark_png": "https://storage.googleapis.com/anyplot-images/plots/scatter-constellation-diagram/python/letsplot/plot-dark.png",
  "interactive_light_html": "https://storage.googleapis.com/anyplot-images/plots/scatter-constellation-diagram/python/letsplot/plot-light.html",
  "interactive_dark_html": "https://storage.googleapis.com/anyplot-images/plots/scatter-constellation-diagram/python/letsplot/plot-dark.html",
  "quality_score": 91.0,
  "license": "MIT",
  "guide": "https://anyplot.ai/llms.txt"
}
Part of Digital Modulation Constellation Diagram on anyplot.ai.