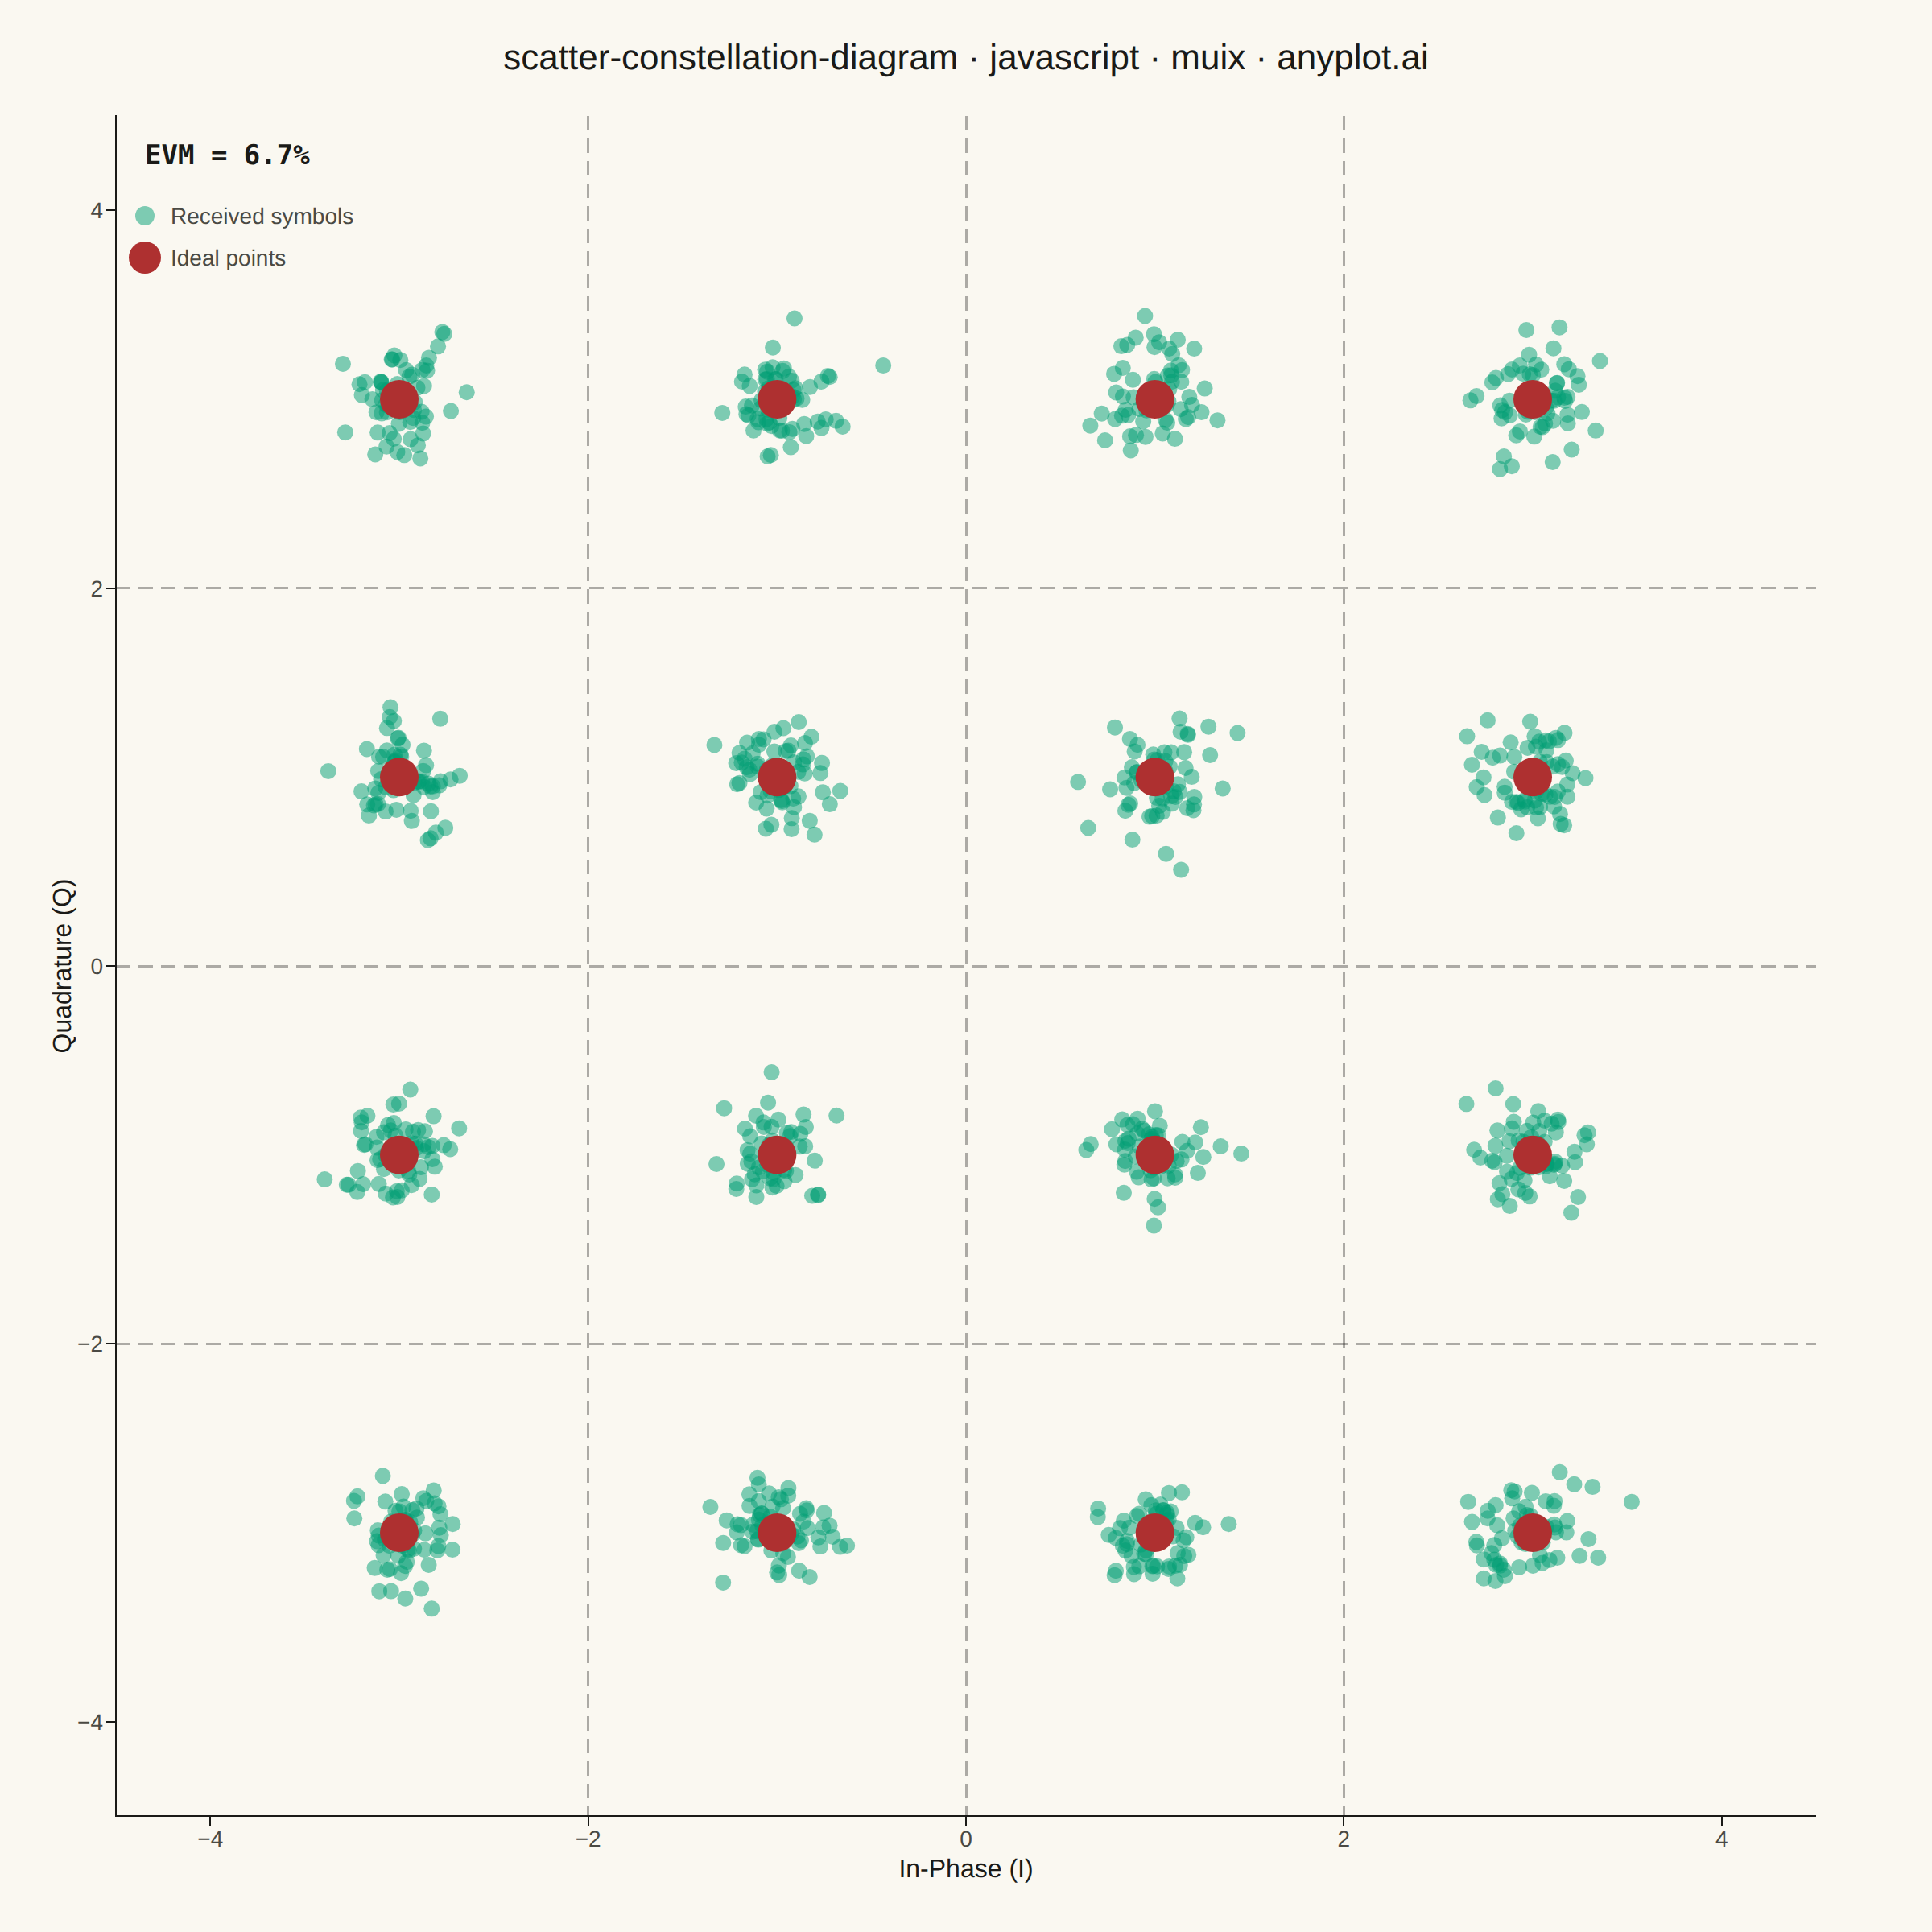
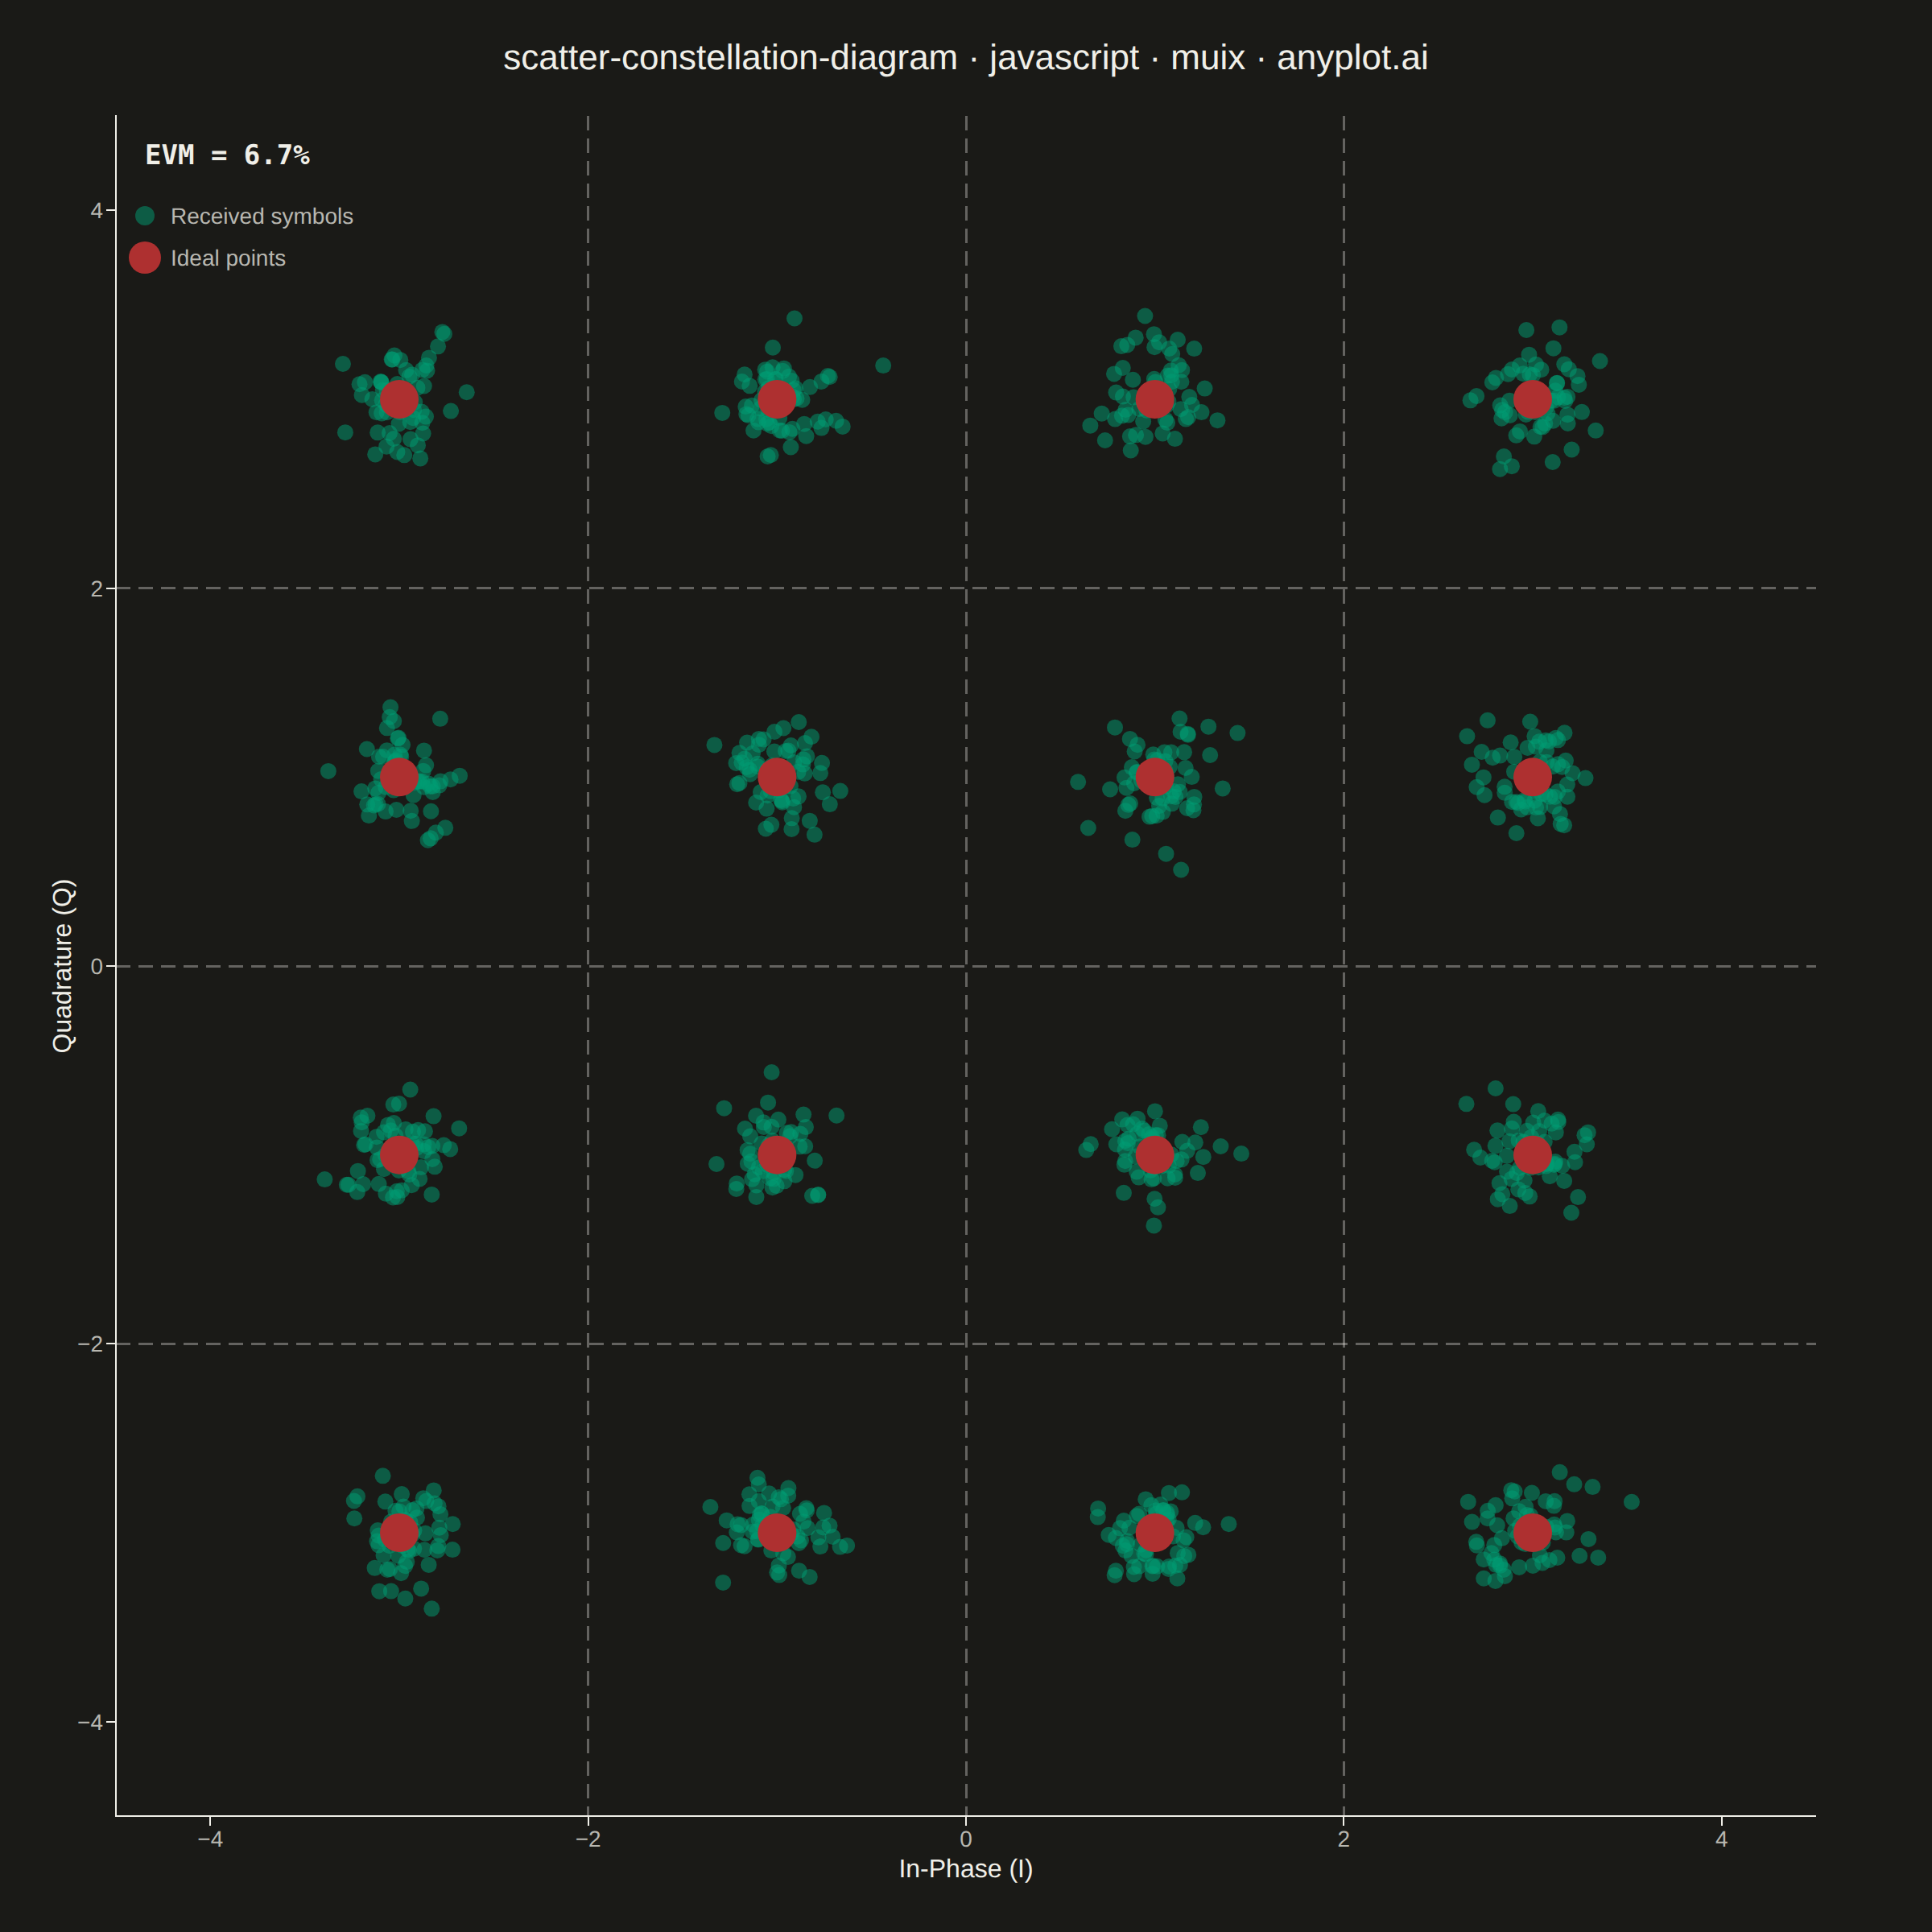
An I/Q (In-phase/Quadrature) scatter plot showing symbol positions of a digitally modulated signal. Ideal constellation points are displayed as reference markers with received symbols scattered around them, revealing modulation quality and signal impairments such as noise, phase offset, and amplitude distortion. This plot is the standard diagnostic tool for evaluating digital modulation schemes like 16-QAM.
// anyplot.ai
// scatter-constellation-diagram: Digital Modulation Constellation Diagram
// Library: muix 7.29.1 | JavaScript 22.22.3
// Quality: 86/100 | Created: 2026-06-18
//# anyplot-orientation: square
// anyplot.ai
// scatter-constellation-diagram: Digital Modulation Constellation Diagram
// Library: MUI X Charts | React | Node 22
// License: @mui/x-charts — MIT (community). Pro/Premium are out of scope.
// Quality: pending | Created: 2026-06-18

import { ScatterChart } from "@mui/x-charts/ScatterChart";
import { ChartsReferenceLine } from "@mui/x-charts/ChartsReferenceLine";
import { useDrawingArea } from "@mui/x-charts/hooks";

const t = window.ANYPLOT_TOKENS;
const THEME = window.ANYPLOT_THEME;

// Theme-adaptive chrome tokens
const ink = THEME === "light" ? "#1A1A17" : "#F0EFE8";
const inkSoft = THEME === "light" ? "#4A4A44" : "#B8B7B0";
const boundaryStroke =
  THEME === "light" ? "rgba(26,26,23,0.35)" : "rgba(240,239,232,0.35)";

// --- Seeded LCG RNG for deterministic data ---
let _seed = 42;
function lcg() {
  _seed = (Math.imul(1664525, _seed) + 1013904223) >>> 0;
  return _seed / 0x100000000;
}

function randNorm(mu, sigma) {
  const u1 = Math.max(1e-10, lcg());
  const u2 = lcg();
  return mu + sigma * Math.sqrt(-2 * Math.log(u1)) * Math.cos(2 * Math.PI * u2);
}

// --- 16-QAM ideal constellation points (4×4 grid at ±1, ±3) ---
const idealPoints = [];
for (let q = -3; q <= 3; q += 2) {
  for (let i = -3; i <= 3; i += 2) {
    idealPoints.push({ x: i, y: q });
  }
}

// Received symbols with AWGN (σ=0.15 per axis → EVM ≈ 6.7%)
const SIGMA = 0.15;
const N_PER_POINT = 62; // 16 × 62 = 992 received symbols total

const receivedData = idealPoints.flatMap((pt, idx) =>
  Array.from({ length: N_PER_POINT }, (_, n) => ({
    id: `rx-${idx}-${n}`,
    x: randNorm(pt.x, SIGMA),
    y: randNorm(pt.y, SIGMA),
  }))
);

const idealData = idealPoints.map((pt, i) => ({
  id: `id-${i}`,
  x: pt.x,
  y: pt.y,
}));

// EVM = σ·√2 / √E_s  where E_s(16-QAM) = 10
const evmPct = ((SIGMA * Math.SQRT2) / Math.sqrt(10) * 100).toFixed(1);

// Decision boundaries for 16-QAM: midpoints between symbol positions ±1, ±3
const BOUNDARIES = [-2, 0, 2];

const TITLE = "scatter-constellation-diagram · javascript · muix · anyplot.ai";

// --- Custom SVG overlays (rendered inside ChartContainer's SVG context) ---
function PlotTitle() {
  const { left, top, width } = useDrawingArea();
  return (
    <text
      x={left + width / 2}
      y={Math.round(top * 0.52)}
      textAnchor="middle"
      dominantBaseline="middle"
      fill={ink}
      fontSize={22}
      fontWeight={500}
      fontFamily="sans-serif"
    >
      {TITLE}
    </text>
  );
}

function EvmAnnotation() {
  const { left, top, width } = useDrawingArea();
  return (
    <g>
      <text
        x={left + 18}
        y={top + 30}
        fill={ink}
        fontSize={17}
        fontWeight={600}
        fontFamily="monospace, sans-serif"
      >
        {`EVM = ${evmPct}%`}
      </text>
      {/* Series key: received symbols */}
      <circle cx={left + 18} cy={top + 62} r={6} fill="rgba(0,158,115,0.5)" />
      <text x={left + 34} y={top + 67} fill={inkSoft} fontSize={14} fontFamily="sans-serif">
        Received symbols
      </text>
      {/* Series key: ideal points */}
      <circle cx={left + 18} cy={top + 88} r={10} fill={t.palette[4]} />
      <text x={left + 34} y={top + 93} fill={inkSoft} fontSize={14} fontFamily="sans-serif">
        Ideal points
      </text>
    </g>
  );
}

// --- Chart ---
export default function Chart() {
  return (
    <ScatterChart
      width={window.ANYPLOT_SIZE.width}
      height={window.ANYPLOT_SIZE.height}
      skipAnimation
      colors={["rgba(0,158,115,0.5)", t.palette[4]]}
      margin={{ top: 72, bottom: 72, left: 72, right: 72 }}
      series={[
        {
          id: "received",
          label: "Received symbols",
          data: receivedData,
          markerSize: 5,
          valueFormatter: (v) => `I=${v.x.toFixed(2)}, Q=${v.y.toFixed(2)}`,
        },
        {
          id: "ideal",
          label: "Ideal points",
          data: idealData,
          markerSize: 12,
          valueFormatter: (v) => `I=${v.x}, Q=${v.y}`,
        },
      ]}
      xAxis={[{
        min: -4.5,
        max: 4.5,
        label: "In-Phase (I)",
        tickNumber: 5,
        tickLabelStyle: { fontSize: 14, fill: inkSoft },
        labelStyle: { fontSize: 16, fill: ink },
      }]}
      yAxis={[{
        min: -4.5,
        max: 4.5,
        label: "Quadrature (Q)",
        tickNumber: 5,
        tickLabelStyle: { fontSize: 14, fill: inkSoft },
        labelStyle: { fontSize: 16, fill: ink },
      }]}
      slotProps={{
        legend: { hidden: true },
      }}
      sx={{
        "& .MuiChartsAxis-line": { stroke: inkSoft },
        "& .MuiChartsAxis-tick": { stroke: inkSoft },
        "& .MuiChartsAxis-top .MuiChartsAxis-line": { display: "none" },
        "& .MuiChartsAxis-right .MuiChartsAxis-line": { display: "none" },
      }}
    >
      {BOUNDARIES.map((val) => (
        <ChartsReferenceLine
          key={`xb${val}`}
          x={val}
          lineStyle={{
            stroke: boundaryStroke,
            strokeDasharray: "9 5",
            strokeWidth: 1.5,
          }}
        />
      ))}
      {BOUNDARIES.map((val) => (
        <ChartsReferenceLine
          key={`yb${val}`}
          y={val}
          lineStyle={{
            stroke: boundaryStroke,
            strokeDasharray: "9 5",
            strokeWidth: 1.5,
          }}
        />
      ))}
      <PlotTitle />
      <EvmAnnotation />
    </ScatterChart>
  );
}
Runnable source as JSON, for any HTTP client: https://api.anyplot.ai/specs/scatter-constellation-diagram/muix/code. Any spec id and library id listed in llms-full.txt fit the same URL shape; every URL below is complete and callable.
{
  "spec_id": "scatter-constellation-diagram",
  "language": "javascript",
  "library": "muix",
  "page": "https://anyplot.ai/scatter-constellation-diagram/javascript/muix",
  "hub": "https://anyplot.ai/scatter-constellation-diagram",
  "code_json": "https://api.anyplot.ai/specs/scatter-constellation-diagram/muix/code",
  "spec_json": "https://api.anyplot.ai/specs/scatter-constellation-diagram",
  "render_light_png": "https://storage.googleapis.com/anyplot-images/plots/scatter-constellation-diagram/javascript/muix/plot-light.png",
  "render_dark_png": "https://storage.googleapis.com/anyplot-images/plots/scatter-constellation-diagram/javascript/muix/plot-dark.png",
  "interactive_light_html": "https://storage.googleapis.com/anyplot-images/plots/scatter-constellation-diagram/javascript/muix/plot-light.html",
  "interactive_dark_html": "https://storage.googleapis.com/anyplot-images/plots/scatter-constellation-diagram/javascript/muix/plot-dark.html",
  "quality_score": 86.0,
  "license": "MIT",
  "guide": "https://anyplot.ai/llms.txt"
}
Part of Digital Modulation Constellation Diagram on anyplot.ai.