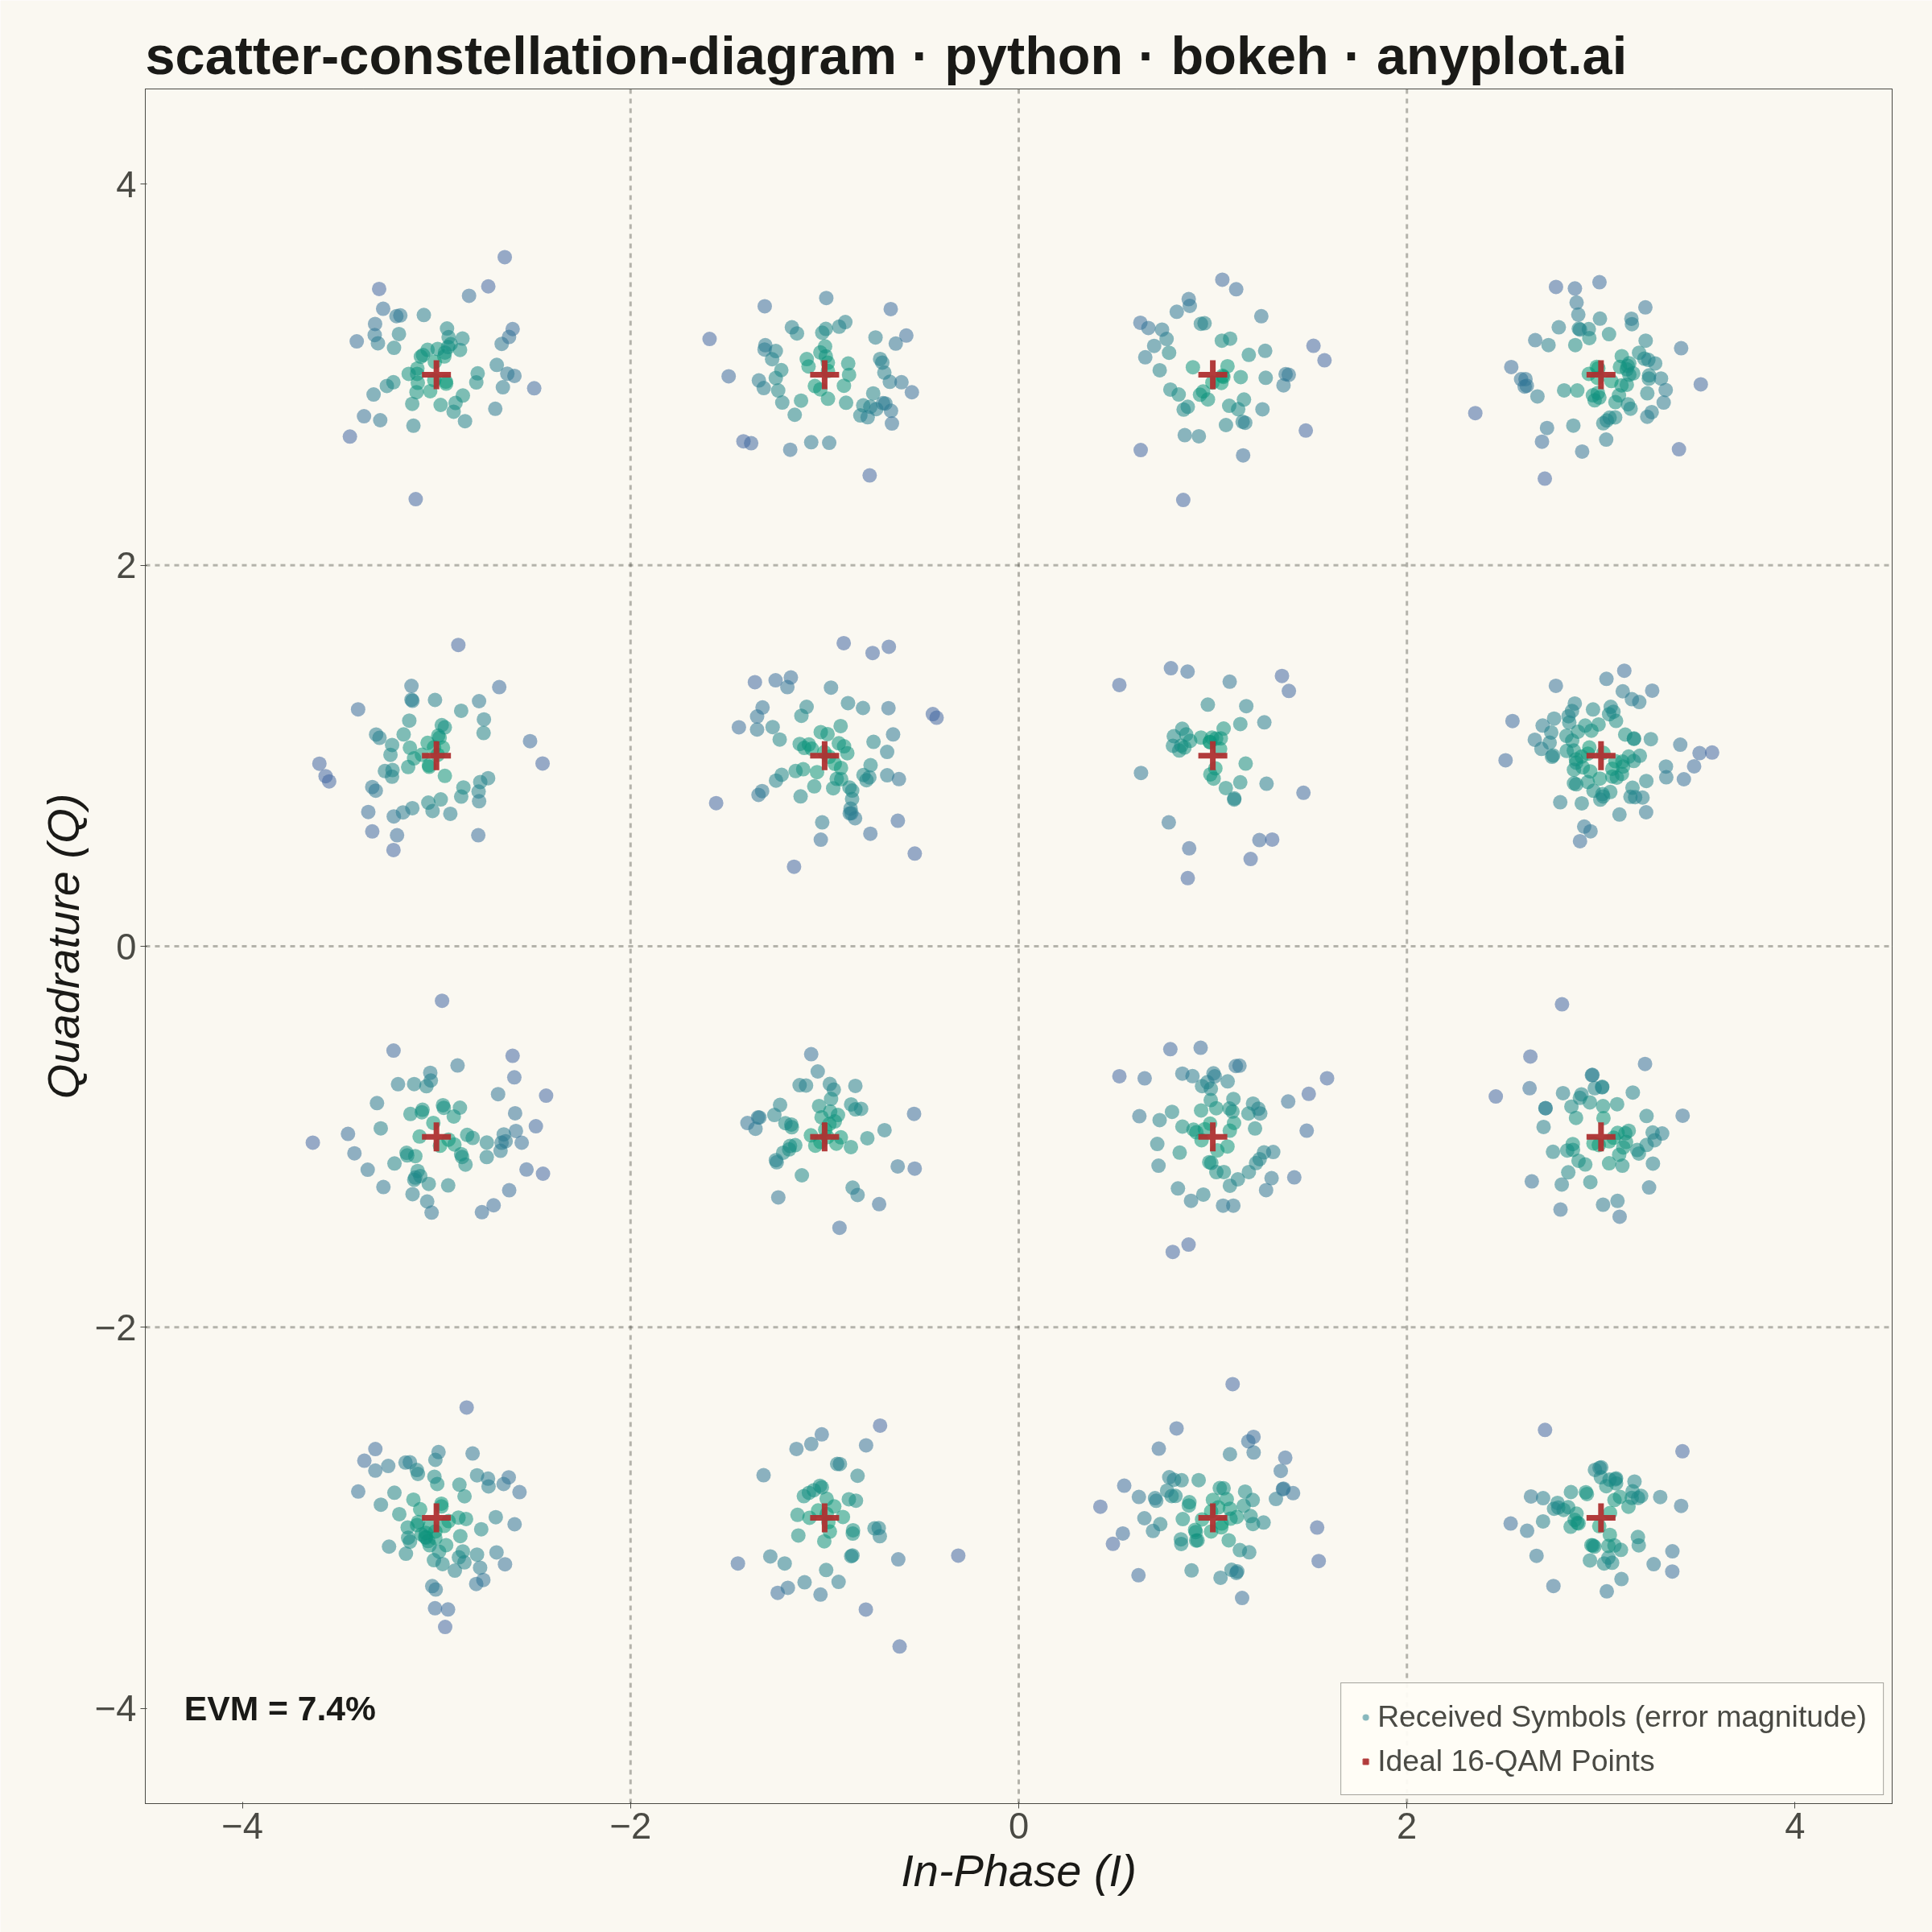
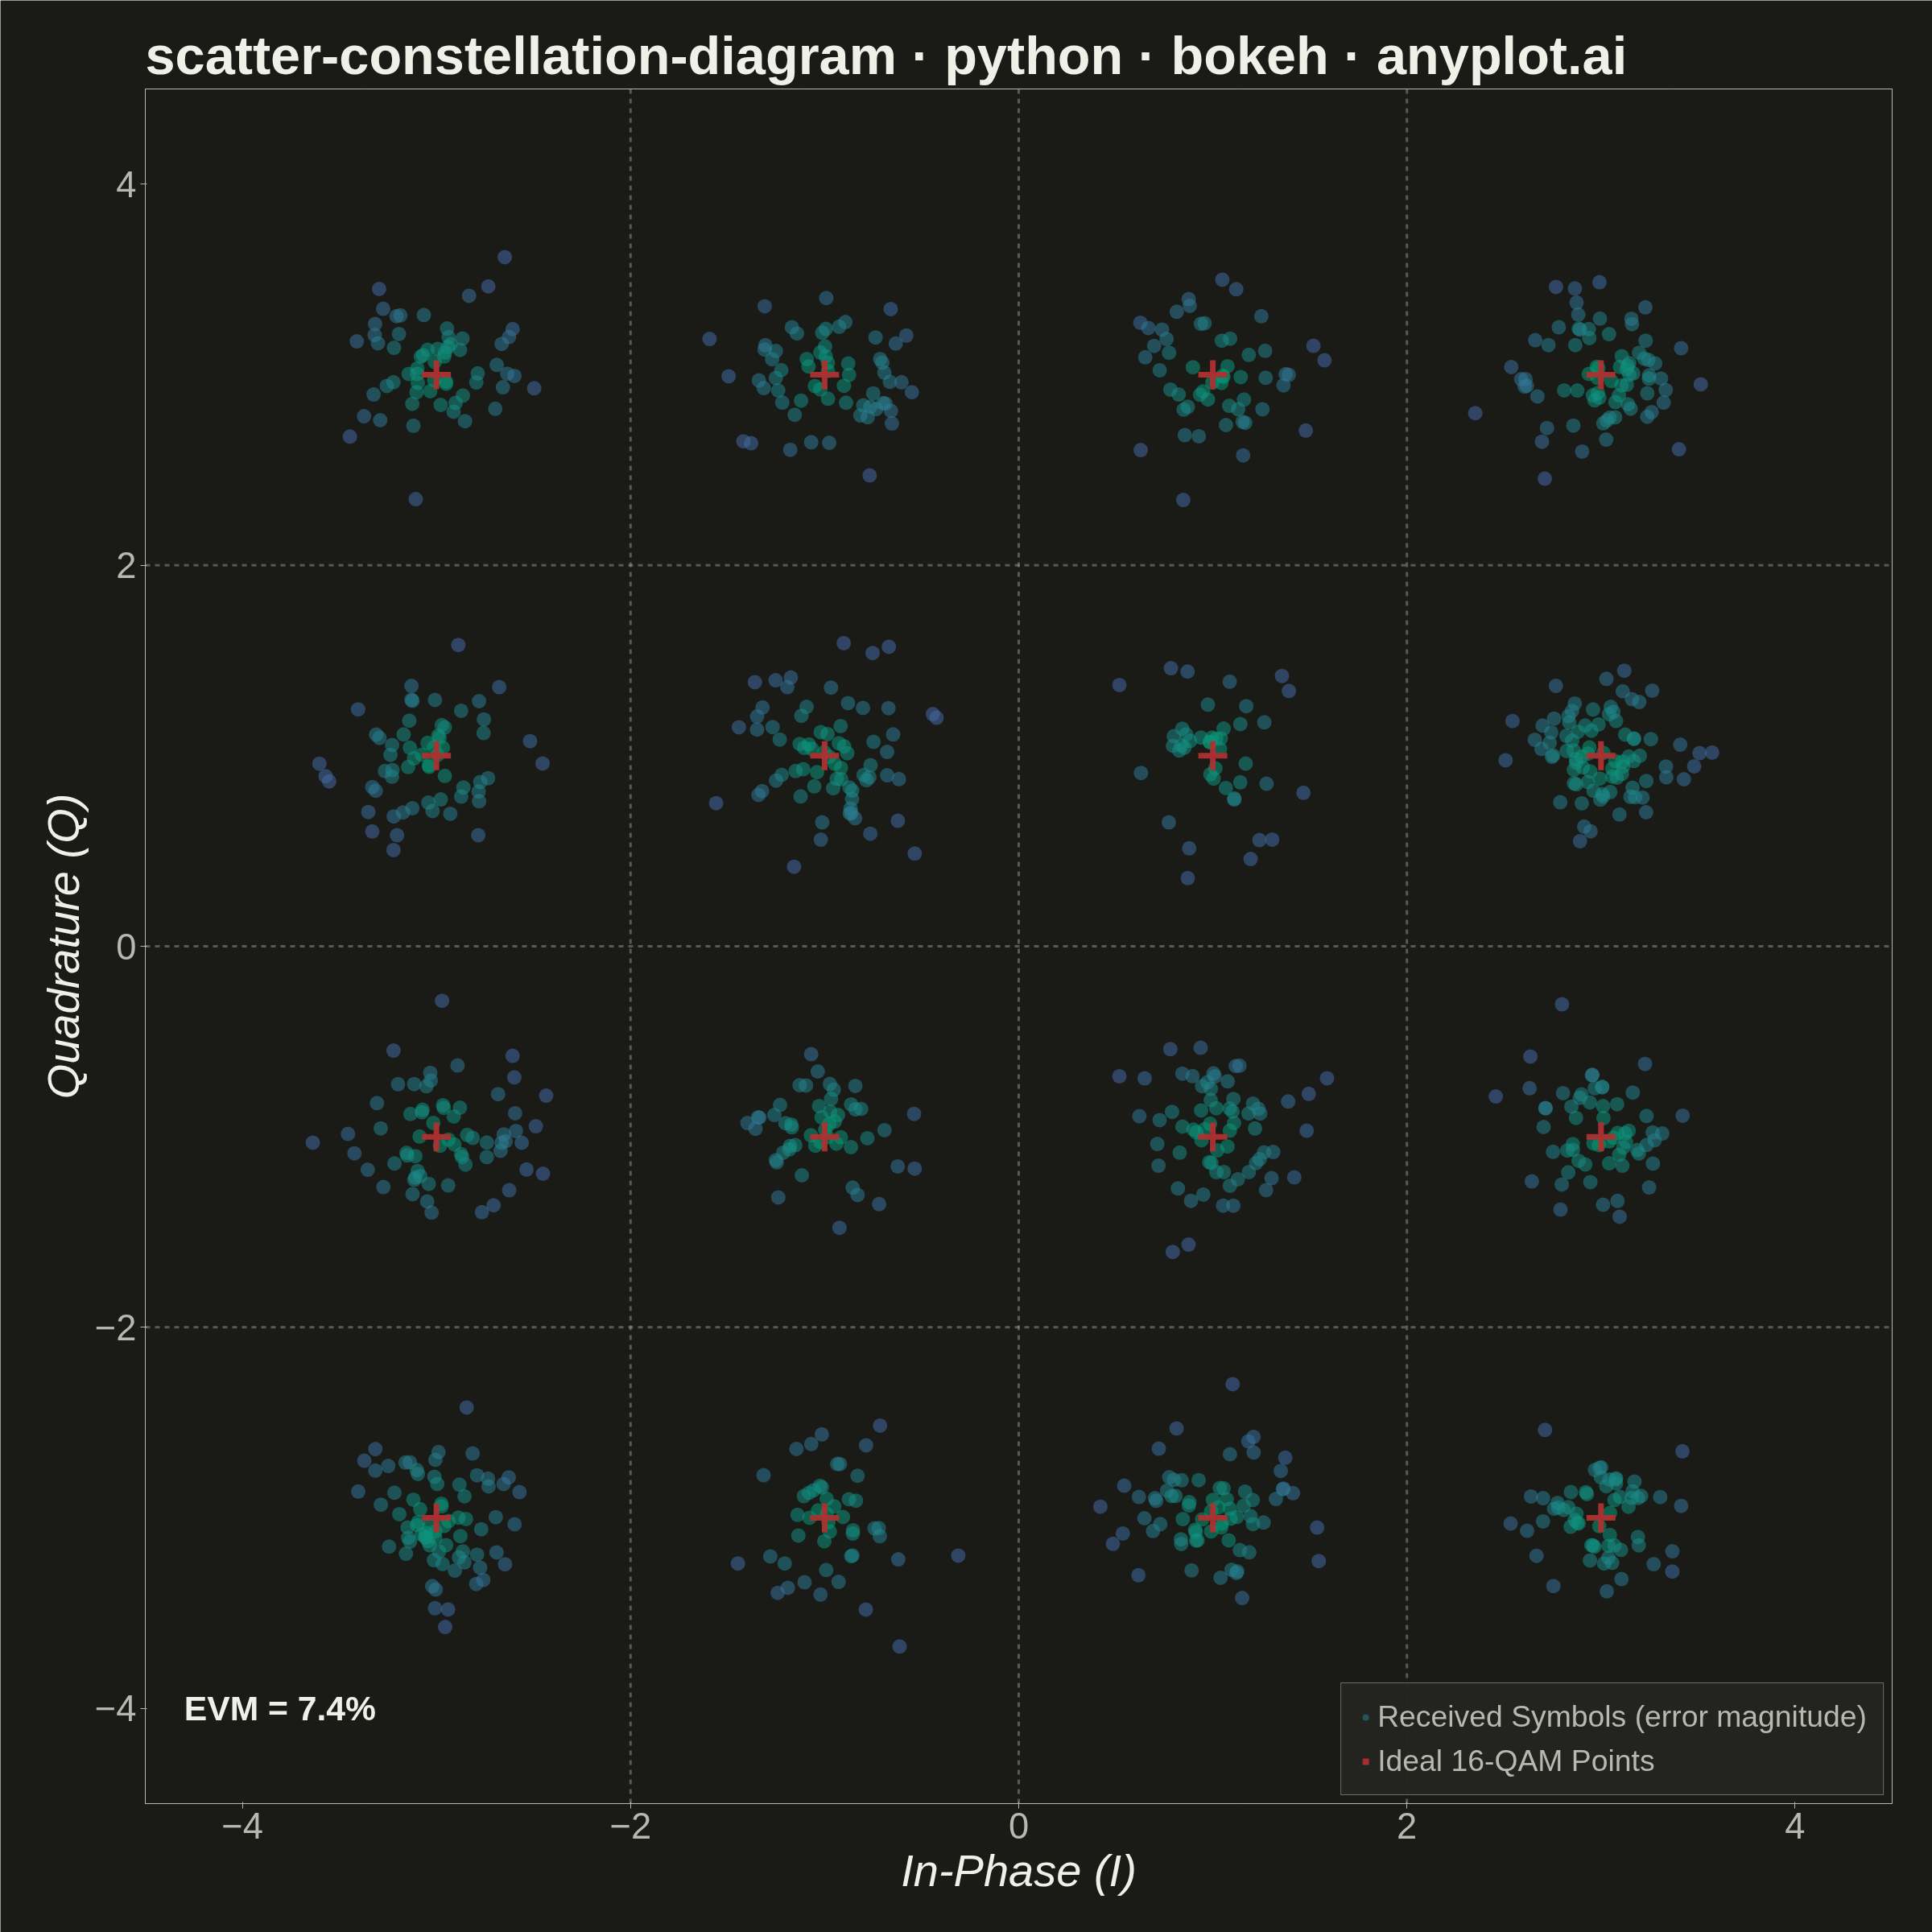
An I/Q (In-phase/Quadrature) scatter plot showing symbol positions of a digitally modulated signal. Ideal constellation points are displayed as reference markers with received symbols scattered around them, revealing modulation quality and signal impairments such as noise, phase offset, and amplitude distortion. This plot is the standard diagnostic tool for evaluating digital modulation schemes like 16-QAM.
""" anyplot.ai
scatter-constellation-diagram: Digital Modulation Constellation Diagram
Library: bokeh 3.9.1 | Python 3.13.13
Quality: 88/100 | Updated: 2026-06-18
"""

import os
import time
from pathlib import Path

import numpy as np
from bokeh.io import output_file, save
from bokeh.models import ColumnDataSource, HoverTool, Label, Legend, LegendItem, LinearColorMapper, Span
from bokeh.plotting import figure
from bokeh.transform import transform
from selenium import webdriver
from selenium.webdriver.chrome.options import Options


# Theme tokens — Imprint palette
THEME = os.getenv("ANYPLOT_THEME", "light")
PAGE_BG = "#FAF8F1" if THEME == "light" else "#1A1A17"
ELEVATED_BG = "#FFFDF6" if THEME == "light" else "#242420"
INK = "#1A1A17" if THEME == "light" else "#F0EFE8"
INK_SOFT = "#4A4A44" if THEME == "light" else "#B8B7B0"

# Imprint sequential colormap (green→blue) for single-polarity continuous data
_c0 = np.array([0x00, 0x9E, 0x73])  # #009E73
_c1 = np.array([0x44, 0x67, 0xA3])  # #4467A3
IMPRINT_SEQ256 = [
    "#{:02X}{:02X}{:02X}".format(*np.round(_c0 + (_c1 - _c0) * t / 255.0).astype(int)) for t in range(256)
]

# Data — 16-QAM constellation with SNR-based noise model
np.random.seed(42)

ideal_levels = np.array([-3, -1, 1, 3])
ideal_i, ideal_q = np.meshgrid(ideal_levels, ideal_levels)
ideal_i = ideal_i.flatten()
ideal_q = ideal_q.flatten()

n_symbols = 1000
snr_db = 20
snr_linear = 10 ** (snr_db / 10)
avg_power = np.mean(ideal_levels**2)
noise_std = np.sqrt(avg_power / snr_linear)

symbol_indices = np.random.randint(0, 16, n_symbols)
received_i = ideal_i[symbol_indices] + np.random.normal(0, noise_std, n_symbols)
received_q = ideal_q[symbol_indices] + np.random.normal(0, noise_std, n_symbols)

error_vectors = np.sqrt((received_i - ideal_i[symbol_indices]) ** 2 + (received_q - ideal_q[symbol_indices]) ** 2)
rms_error = np.sqrt(np.mean(error_vectors**2))
max_amplitude = np.sqrt(3**2 + 3**2)
evm_percent = (rms_error / max_amplitude) * 100

color_mapper = LinearColorMapper(palette=IMPRINT_SEQ256, low=0, high=float(np.percentile(error_vectors, 95)))

# Plot — square canvas (2400×2400) with equal aspect ratio for constellation geometry
title = "scatter-constellation-diagram · python · bokeh · anyplot.ai"
p = figure(
    width=2400,
    height=2400,
    title=title,
    x_axis_label="In-Phase (I)",
    y_axis_label="Quadrature (Q)",
    x_range=(-4.5, 4.5),
    y_range=(-4.5, 4.5),
    match_aspect=True,
    toolbar_location=None,
    min_border_bottom=160,
    min_border_left=180,
    min_border_top=110,
    min_border_right=50,
)

# Font sizes — canonical bokeh values for 2400×2400 canvas
p.title.text_font_size = "50pt"
p.title.text_color = INK
p.xaxis.axis_label_text_font_size = "42pt"
p.yaxis.axis_label_text_font_size = "42pt"
p.xaxis.axis_label_text_color = INK
p.yaxis.axis_label_text_color = INK
p.xaxis.major_label_text_font_size = "34pt"
p.yaxis.major_label_text_font_size = "34pt"
p.xaxis.major_label_text_color = INK_SOFT
p.yaxis.major_label_text_color = INK_SOFT

# Chrome — theme-adaptive tokens
p.background_fill_color = PAGE_BG
p.border_fill_color = PAGE_BG
p.outline_line_color = INK_SOFT
p.xaxis.axis_line_color = INK_SOFT
p.yaxis.axis_line_color = INK_SOFT
p.xaxis.major_tick_line_color = INK_SOFT
p.yaxis.major_tick_line_color = INK_SOFT
p.xaxis.minor_tick_line_color = None
p.yaxis.minor_tick_line_color = None
p.xgrid.grid_line_alpha = 0
p.ygrid.grid_line_alpha = 0

# Decision boundary lines separating 16-QAM symbol regions
for level in [-2, 0, 2]:
    p.add_layout(
        Span(location=level, dimension="height", line_color=INK_SOFT, line_dash="dashed", line_width=3, line_alpha=0.4)
    )
    p.add_layout(
        Span(location=level, dimension="width", line_color=INK_SOFT, line_dash="dashed", line_width=3, line_alpha=0.4)
    )

# Received symbols — color-coded by error magnitude using Imprint sequential cmap
received_source = ColumnDataSource(
    data={
        "i": received_i,
        "q": received_q,
        "error": error_vectors,
        "ideal_i": ideal_i[symbol_indices],
        "ideal_q": ideal_q[symbol_indices],
    }
)
rx_renderer = p.scatter(
    x="i", y="q", source=received_source, size=18, alpha=0.55, color=transform("error", color_mapper), line_color=None
)

# Ideal constellation points — Imprint matte red as semantic reference marker
ideal_source = ColumnDataSource(data={"i": ideal_i, "q": ideal_q})
ideal_renderer = p.scatter(
    x="i", y="q", source=ideal_source, size=36, color="#AE3030", marker="cross", line_width=7, alpha=0.95
)

# Legend
legend = Legend(
    items=[
        LegendItem(label="Received Symbols (error magnitude)", renderers=[rx_renderer]),
        LegendItem(label="Ideal 16-QAM Points", renderers=[ideal_renderer]),
    ],
    location="bottom_right",
    label_text_font_size="28pt",
    label_text_color=INK_SOFT,
    background_fill_color=ELEVATED_BG,
    border_line_color=INK_SOFT,
    padding=20,
    spacing=12,
)
p.add_layout(legend)

# EVM annotation
evm_label = Label(
    x=-4.3, y=-4.1, text=f"EVM = {evm_percent:.1f}%", text_font_size="32pt", text_color=INK, text_font_style="bold"
)
p.add_layout(evm_label)

# HoverTool for interactive HTML version
hover = HoverTool(
    renderers=[rx_renderer],
    tooltips=[("I / Q", "@i{0.00} / @q{0.00}"), ("Ideal", "@ideal_i{0} / @ideal_q{0}"), ("Error", "@error{0.000}")],
)
p.add_tools(hover)

# Save HTML artifact
output_file(f"plot-{THEME}.html")
save(p)

# Screenshot via headless Chrome — Selenium 4 / Selenium Manager
# Chrome headless subtracts ~143px from the window height for internal overhead,
# so set window to 2543 to get a 2400×2400 viewport (and thus a 2400×2400 PNG).
W, H = 2400, 2400
WIN_H = H + 143
opts = Options()
for arg in (
    "--headless=new",
    "--no-sandbox",
    "--disable-dev-shm-usage",
    "--disable-gpu",
    f"--window-size={W},{WIN_H}",
    "--hide-scrollbars",
    "--force-device-scale-factor=1",
):
    opts.add_argument(arg)
driver = webdriver.Chrome(options=opts)
driver.set_window_size(W, WIN_H)
driver.get(f"file://{Path(f'plot-{THEME}.html').resolve()}")
time.sleep(3)
driver.save_screenshot(f"plot-{THEME}.png")
driver.quit()
Runnable source as JSON, for any HTTP client: https://api.anyplot.ai/specs/scatter-constellation-diagram/bokeh/code. Any spec id and library id listed in llms-full.txt fit the same URL shape; every URL below is complete and callable.
{
  "spec_id": "scatter-constellation-diagram",
  "language": "python",
  "library": "bokeh",
  "page": "https://anyplot.ai/scatter-constellation-diagram/python/bokeh",
  "hub": "https://anyplot.ai/scatter-constellation-diagram",
  "code_json": "https://api.anyplot.ai/specs/scatter-constellation-diagram/bokeh/code",
  "spec_json": "https://api.anyplot.ai/specs/scatter-constellation-diagram",
  "render_light_png": "https://storage.googleapis.com/anyplot-images/plots/scatter-constellation-diagram/python/bokeh/plot-light.png",
  "render_dark_png": "https://storage.googleapis.com/anyplot-images/plots/scatter-constellation-diagram/python/bokeh/plot-dark.png",
  "interactive_light_html": "https://storage.googleapis.com/anyplot-images/plots/scatter-constellation-diagram/python/bokeh/plot-light.html",
  "interactive_dark_html": "https://storage.googleapis.com/anyplot-images/plots/scatter-constellation-diagram/python/bokeh/plot-dark.html",
  "quality_score": 88.0,
  "license": "MIT",
  "guide": "https://anyplot.ai/llms.txt"
}
Part of Digital Modulation Constellation Diagram on anyplot.ai.