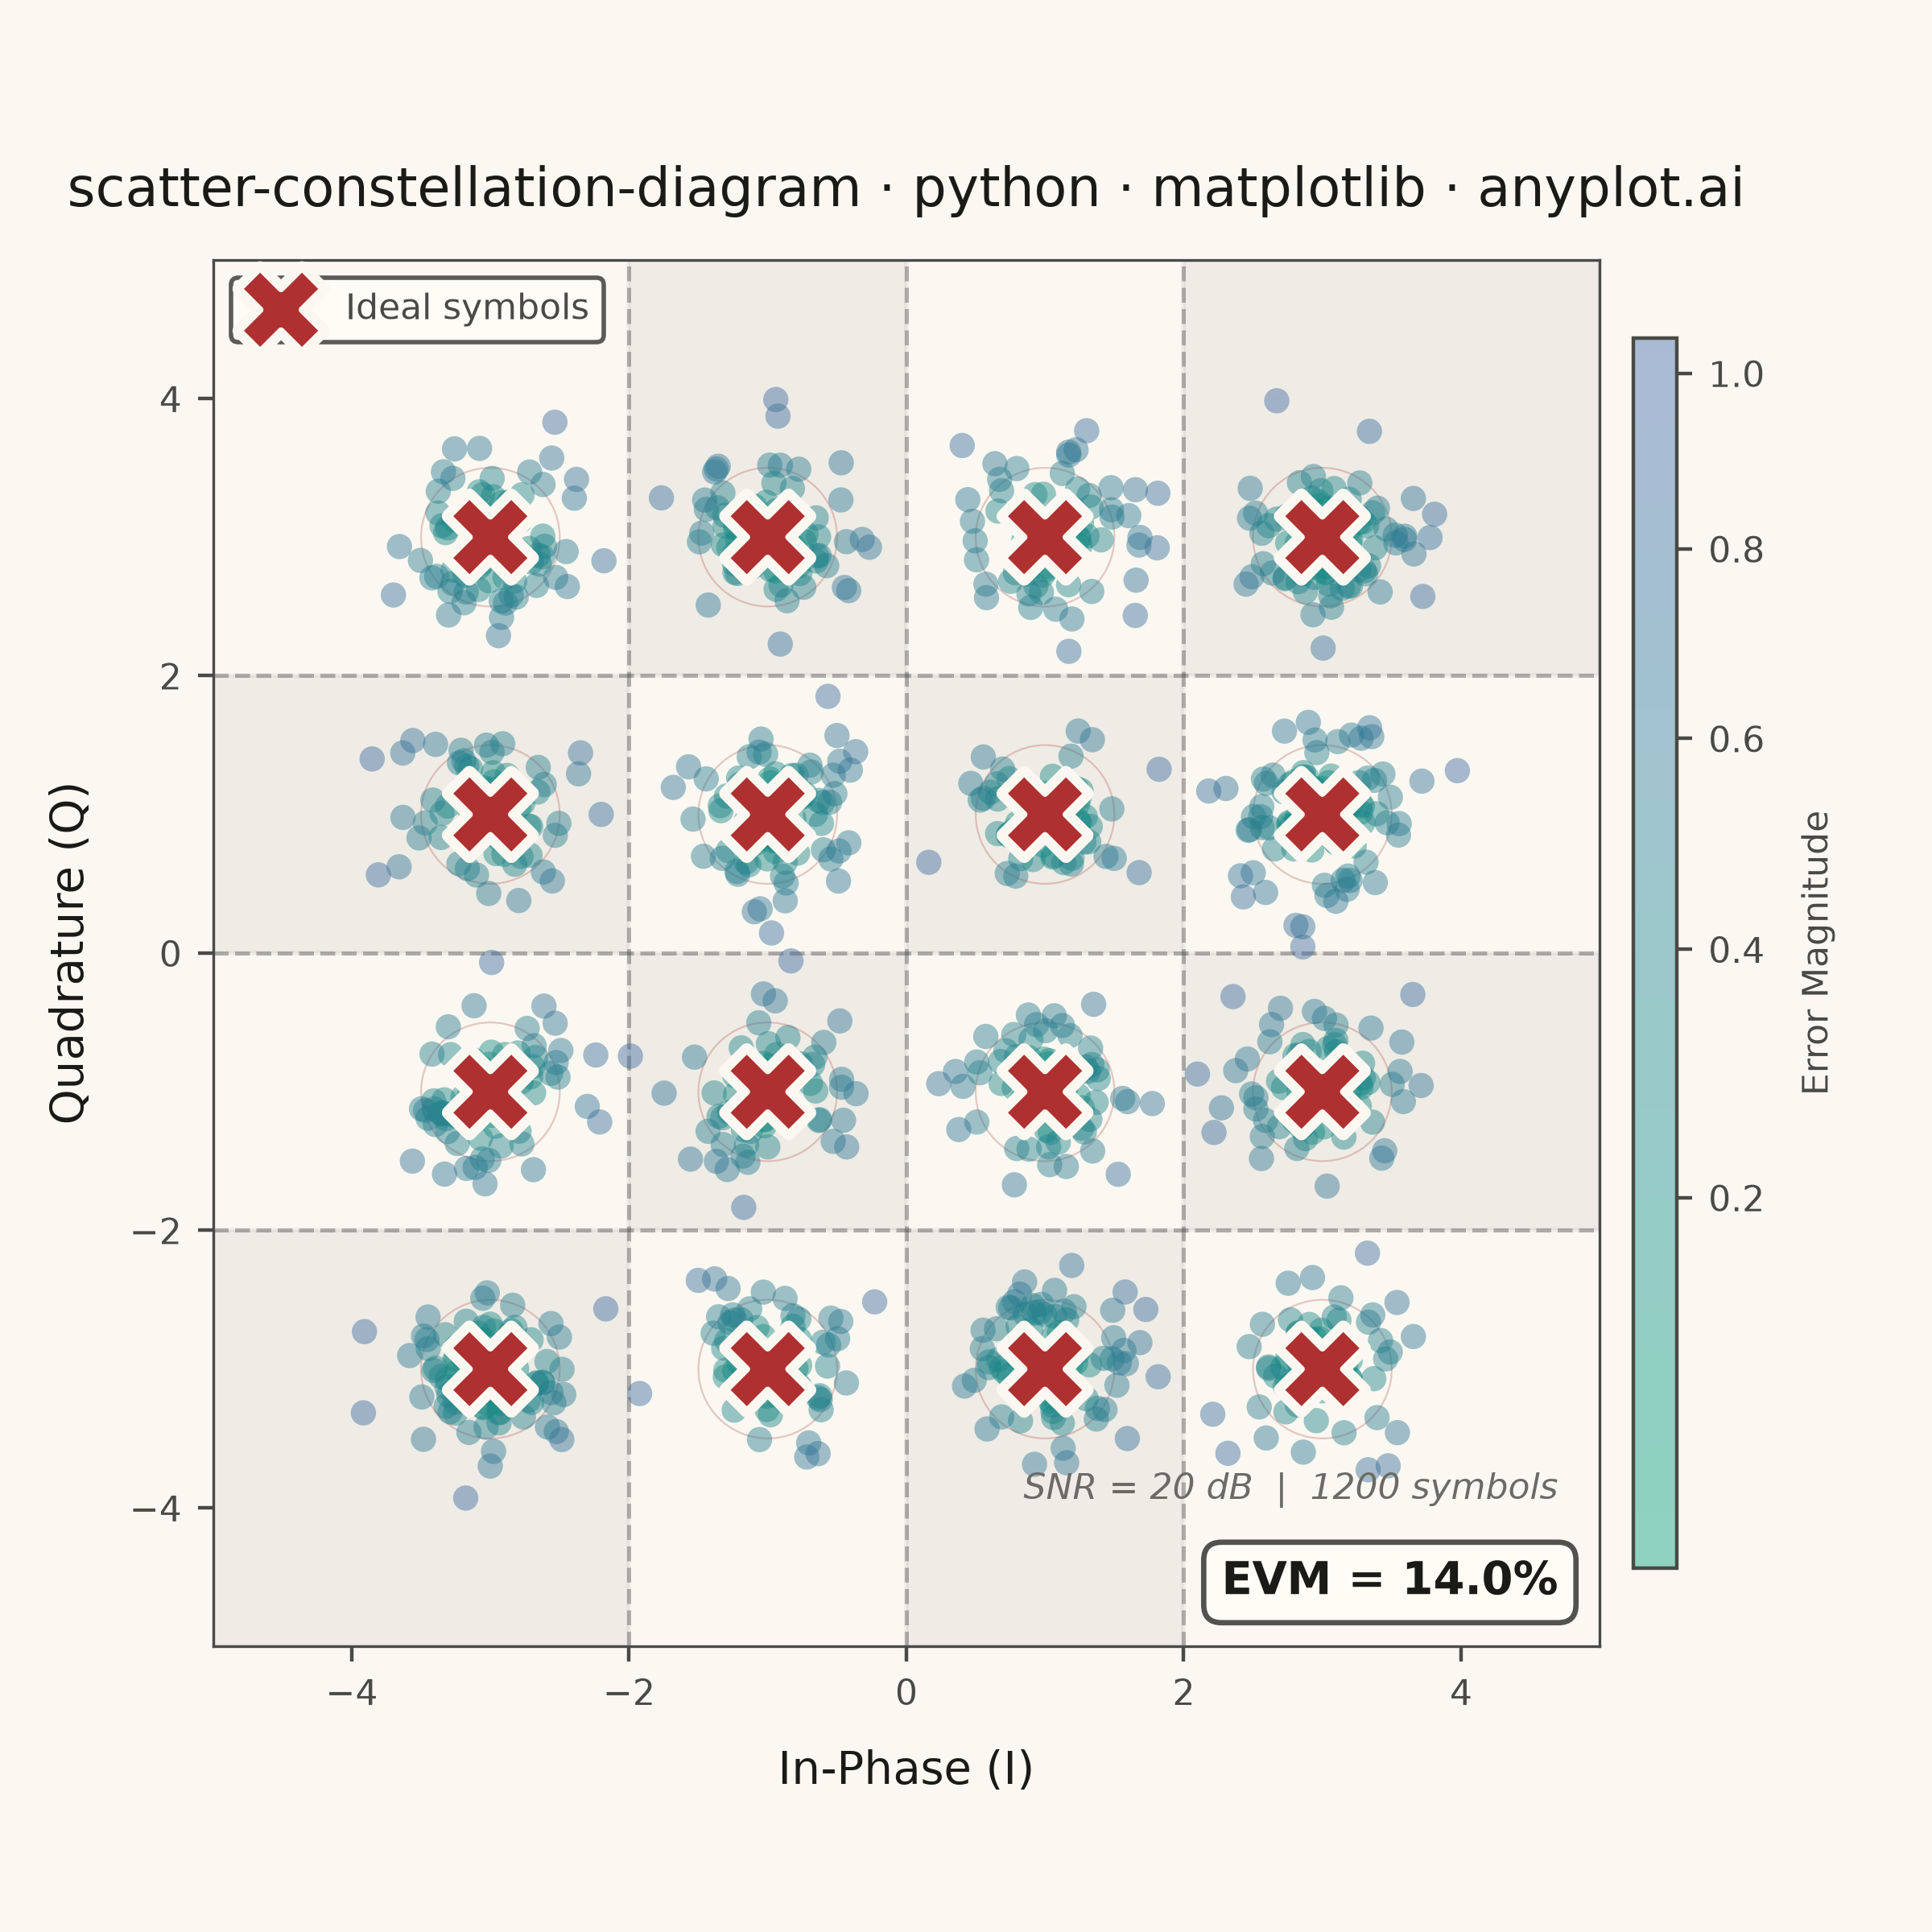
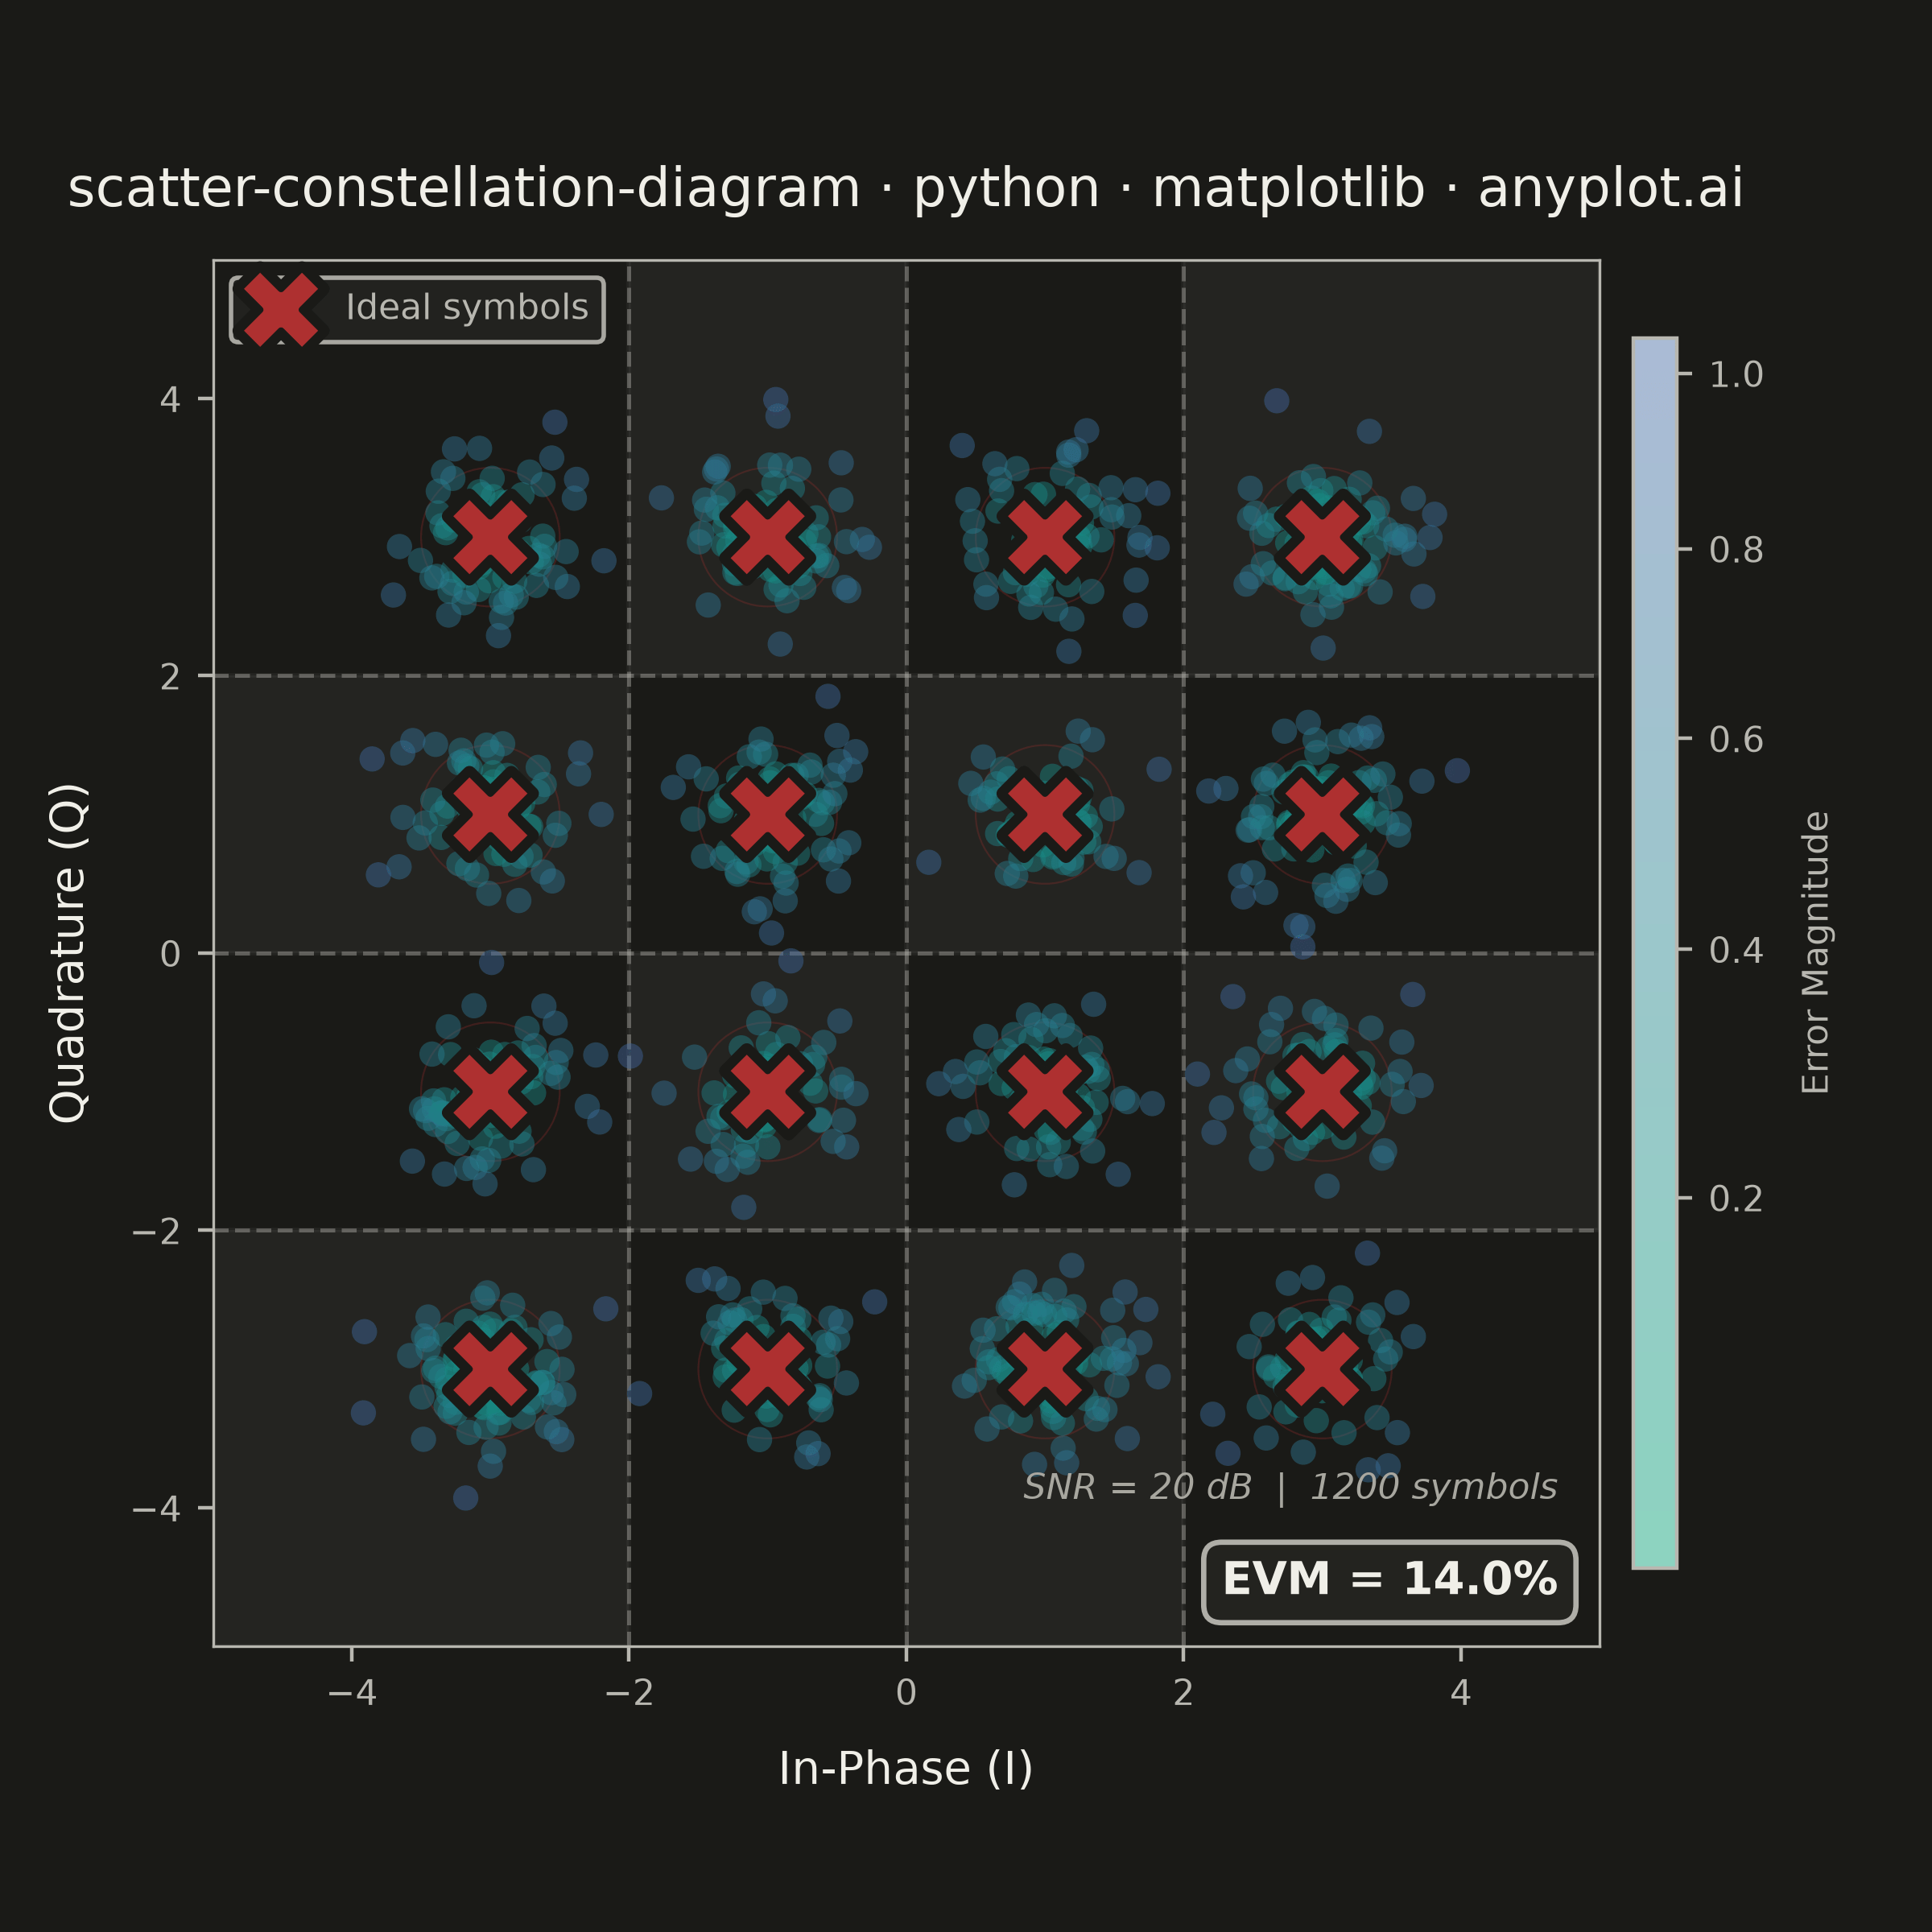
An I/Q (In-phase/Quadrature) scatter plot showing symbol positions of a digitally modulated signal. Ideal constellation points are displayed as reference markers with received symbols scattered around them, revealing modulation quality and signal impairments such as noise, phase offset, and amplitude distortion. This plot is the standard diagnostic tool for evaluating digital modulation schemes like 16-QAM.
""" anyplot.ai
scatter-constellation-diagram: Digital Modulation Constellation Diagram
Library: matplotlib 3.11.0 | Python 3.13.13
Quality: 92/100 | Updated: 2026-06-18
"""

import os

import matplotlib.colors as mcolors
import matplotlib.patheffects as pe
import matplotlib.pyplot as plt
import numpy as np
from matplotlib.colors import LinearSegmentedColormap


# Theme tokens — Imprint palette, see prompts/default-style-guide.md
THEME = os.getenv("ANYPLOT_THEME", "light")
PAGE_BG = "#FAF8F1" if THEME == "light" else "#1A1A17"
ELEVATED_BG = "#FFFDF6" if THEME == "light" else "#242420"
INK = "#1A1A17" if THEME == "light" else "#F0EFE8"
INK_SOFT = "#4A4A44" if THEME == "light" else "#B8B7B0"
INK_MUTED = "#6B6A63" if THEME == "light" else "#A8A79F"

# Imprint sequential colormap for error magnitude (single-polarity continuous data)
imprint_seq = LinearSegmentedColormap.from_list("imprint_seq", ["#009E73", "#4467A3"])

# Data — 16-QAM constellation
np.random.seed(42)

ideal_levels = np.array([-3, -1, 1, 3])
ideal_i, ideal_q = np.meshgrid(ideal_levels, ideal_levels)
ideal_i = ideal_i.ravel()
ideal_q = ideal_q.ravel()

n_symbols = 1200
symbol_indices = np.random.randint(0, 16, n_symbols)

snr_db = 20
snr_linear = 10 ** (snr_db / 10)
signal_power = np.mean(ideal_i**2 + ideal_q**2)
noise_std = np.sqrt(signal_power / snr_linear)

received_i = ideal_i[symbol_indices] + np.random.normal(0, noise_std, n_symbols)
received_q = ideal_q[symbol_indices] + np.random.normal(0, noise_std, n_symbols)

error_vectors = np.sqrt((received_i - ideal_i[symbol_indices]) ** 2 + (received_q - ideal_q[symbol_indices]) ** 2)
rms_evm = np.sqrt(np.mean(error_vectors**2)) / np.sqrt(signal_power) * 100

# Plot — square canvas for symmetric I/Q geometry (2400×2400 px)
fig, ax = plt.subplots(figsize=(6, 6), dpi=400, facecolor=PAGE_BG)
ax.set_facecolor(PAGE_BG)

# Decision boundary regions — subtle alternating shading, theme-adaptive
for row in range(4):
    for col in range(4):
        x0 = [-5, -2, 0, 2][col]
        x1 = [-2, 0, 2, 5][col]
        y0 = [-5, -2, 0, 2][row]
        y1 = [-2, 0, 2, 5][row]
        if (row + col) % 2 == 0:
            ax.fill_between([x0, x1], y0, y1, color=INK, alpha=0.05, zorder=0)

# Decision boundaries — theme-adaptive dashed lines
for boundary in [-2, 0, 2]:
    ax.axhline(boundary, color=INK_SOFT, linestyle="--", linewidth=0.9, alpha=0.4, zorder=1)
    ax.axvline(boundary, color=INK_SOFT, linestyle="--", linewidth=0.9, alpha=0.4, zorder=1)

# Received symbols — Imprint sequential colormap for error magnitude
norm = mcolors.PowerNorm(gamma=0.7, vmin=error_vectors.min(), vmax=error_vectors.max())
scatter = ax.scatter(
    received_i, received_q, c=error_vectors, cmap=imprint_seq, norm=norm, s=32, alpha=0.45, edgecolors="none", zorder=2
)

# Colorbar — theme-adaptive labels and frame
cbar = fig.colorbar(scatter, ax=ax, shrink=0.68, pad=0.02, aspect=28)
cbar.set_label("Error Magnitude", fontsize=8, labelpad=8, color=INK_SOFT)
cbar.ax.tick_params(labelsize=8, colors=INK_SOFT, labelcolor=INK_SOFT)
cbar.outline.set_edgecolor(INK_SOFT)
cbar.outline.set_linewidth(0.8)

# Ideal constellation points — Imprint matte red (#AE3030, semantic anchor for reference/target)
ax.scatter(
    ideal_i,
    ideal_q,
    s=350,
    marker="X",
    color="#AE3030",
    edgecolors=PAGE_BG,
    linewidth=1.5,
    zorder=4,
    label="Ideal symbols",
    path_effects=[pe.withStroke(linewidth=3, foreground=PAGE_BG)],
)

# Concentric rings around ideal points to delineate decision regions
for ii, iq in zip(ideal_i, ideal_q, strict=True):
    circle = plt.Circle((ii, iq), 0.5, fill=False, color="#AE3030", linewidth=0.4, alpha=0.25, zorder=1)
    ax.add_patch(circle)

# Style
title = "scatter-constellation-diagram · python · matplotlib · anyplot.ai"
title_fontsize = max(8, round(12 * 67 / len(title))) if len(title) > 67 else 12

ax.set_xlabel("In-Phase (I)", fontsize=10, color=INK, labelpad=8)
ax.set_ylabel("Quadrature (Q)", fontsize=10, color=INK, labelpad=8)
ax.set_title(title, fontsize=title_fontsize, fontweight="medium", color=INK, pad=12)
ax.tick_params(axis="both", labelsize=8, colors=INK_SOFT, labelcolor=INK_SOFT)

ax.set_xlim(-5, 5)
ax.set_ylim(-5, 5)
ax.set_aspect("equal")

for spine in ax.spines.values():
    spine.set_edgecolor(INK_SOFT)
    spine.set_linewidth(0.6)

leg = ax.legend(fontsize=8, loc="upper left", framealpha=0.9)
if leg:
    leg.get_frame().set_facecolor(ELEVATED_BG)
    leg.get_frame().set_edgecolor(INK_SOFT)
    plt.setp(leg.get_texts(), color=INK_SOFT)

# EVM annotation — theme-adaptive
ax.text(
    0.97,
    0.03,
    f"EVM = {rms_evm:.1f}%",
    transform=ax.transAxes,
    fontsize=10,
    fontweight="bold",
    ha="right",
    va="bottom",
    color=INK,
    bbox={
        "boxstyle": "round,pad=0.4",
        "facecolor": ELEVATED_BG,
        "edgecolor": INK_SOFT,
        "linewidth": 1.2,
        "alpha": 0.95,
    },
)

# SNR / symbols info — theme-adaptive secondary text
ax.text(
    0.97,
    0.10,
    f"SNR = {snr_db} dB  |  {n_symbols} symbols",
    transform=ax.transAxes,
    fontsize=8,
    ha="right",
    va="bottom",
    color=INK_MUTED,
    fontstyle="italic",
)

plt.tight_layout()

# Save — do NOT add bbox_inches='tight' (would trim canvas from 2400×2400 target)
plt.savefig(f"plot-{THEME}.png", dpi=400, facecolor=PAGE_BG)
Runnable source as JSON, for any HTTP client: https://api.anyplot.ai/specs/scatter-constellation-diagram/matplotlib/code. Any spec id and library id listed in llms-full.txt fit the same URL shape; every URL below is complete and callable.
{
  "spec_id": "scatter-constellation-diagram",
  "language": "python",
  "library": "matplotlib",
  "page": "https://anyplot.ai/scatter-constellation-diagram/python/matplotlib",
  "hub": "https://anyplot.ai/scatter-constellation-diagram",
  "code_json": "https://api.anyplot.ai/specs/scatter-constellation-diagram/matplotlib/code",
  "spec_json": "https://api.anyplot.ai/specs/scatter-constellation-diagram",
  "render_light_png": "https://storage.googleapis.com/anyplot-images/plots/scatter-constellation-diagram/python/matplotlib/plot-light.png",
  "render_dark_png": "https://storage.googleapis.com/anyplot-images/plots/scatter-constellation-diagram/python/matplotlib/plot-dark.png",
  "quality_score": 92.0,
  "license": "MIT",
  "guide": "https://anyplot.ai/llms.txt"
}
Part of Digital Modulation Constellation Diagram on anyplot.ai.