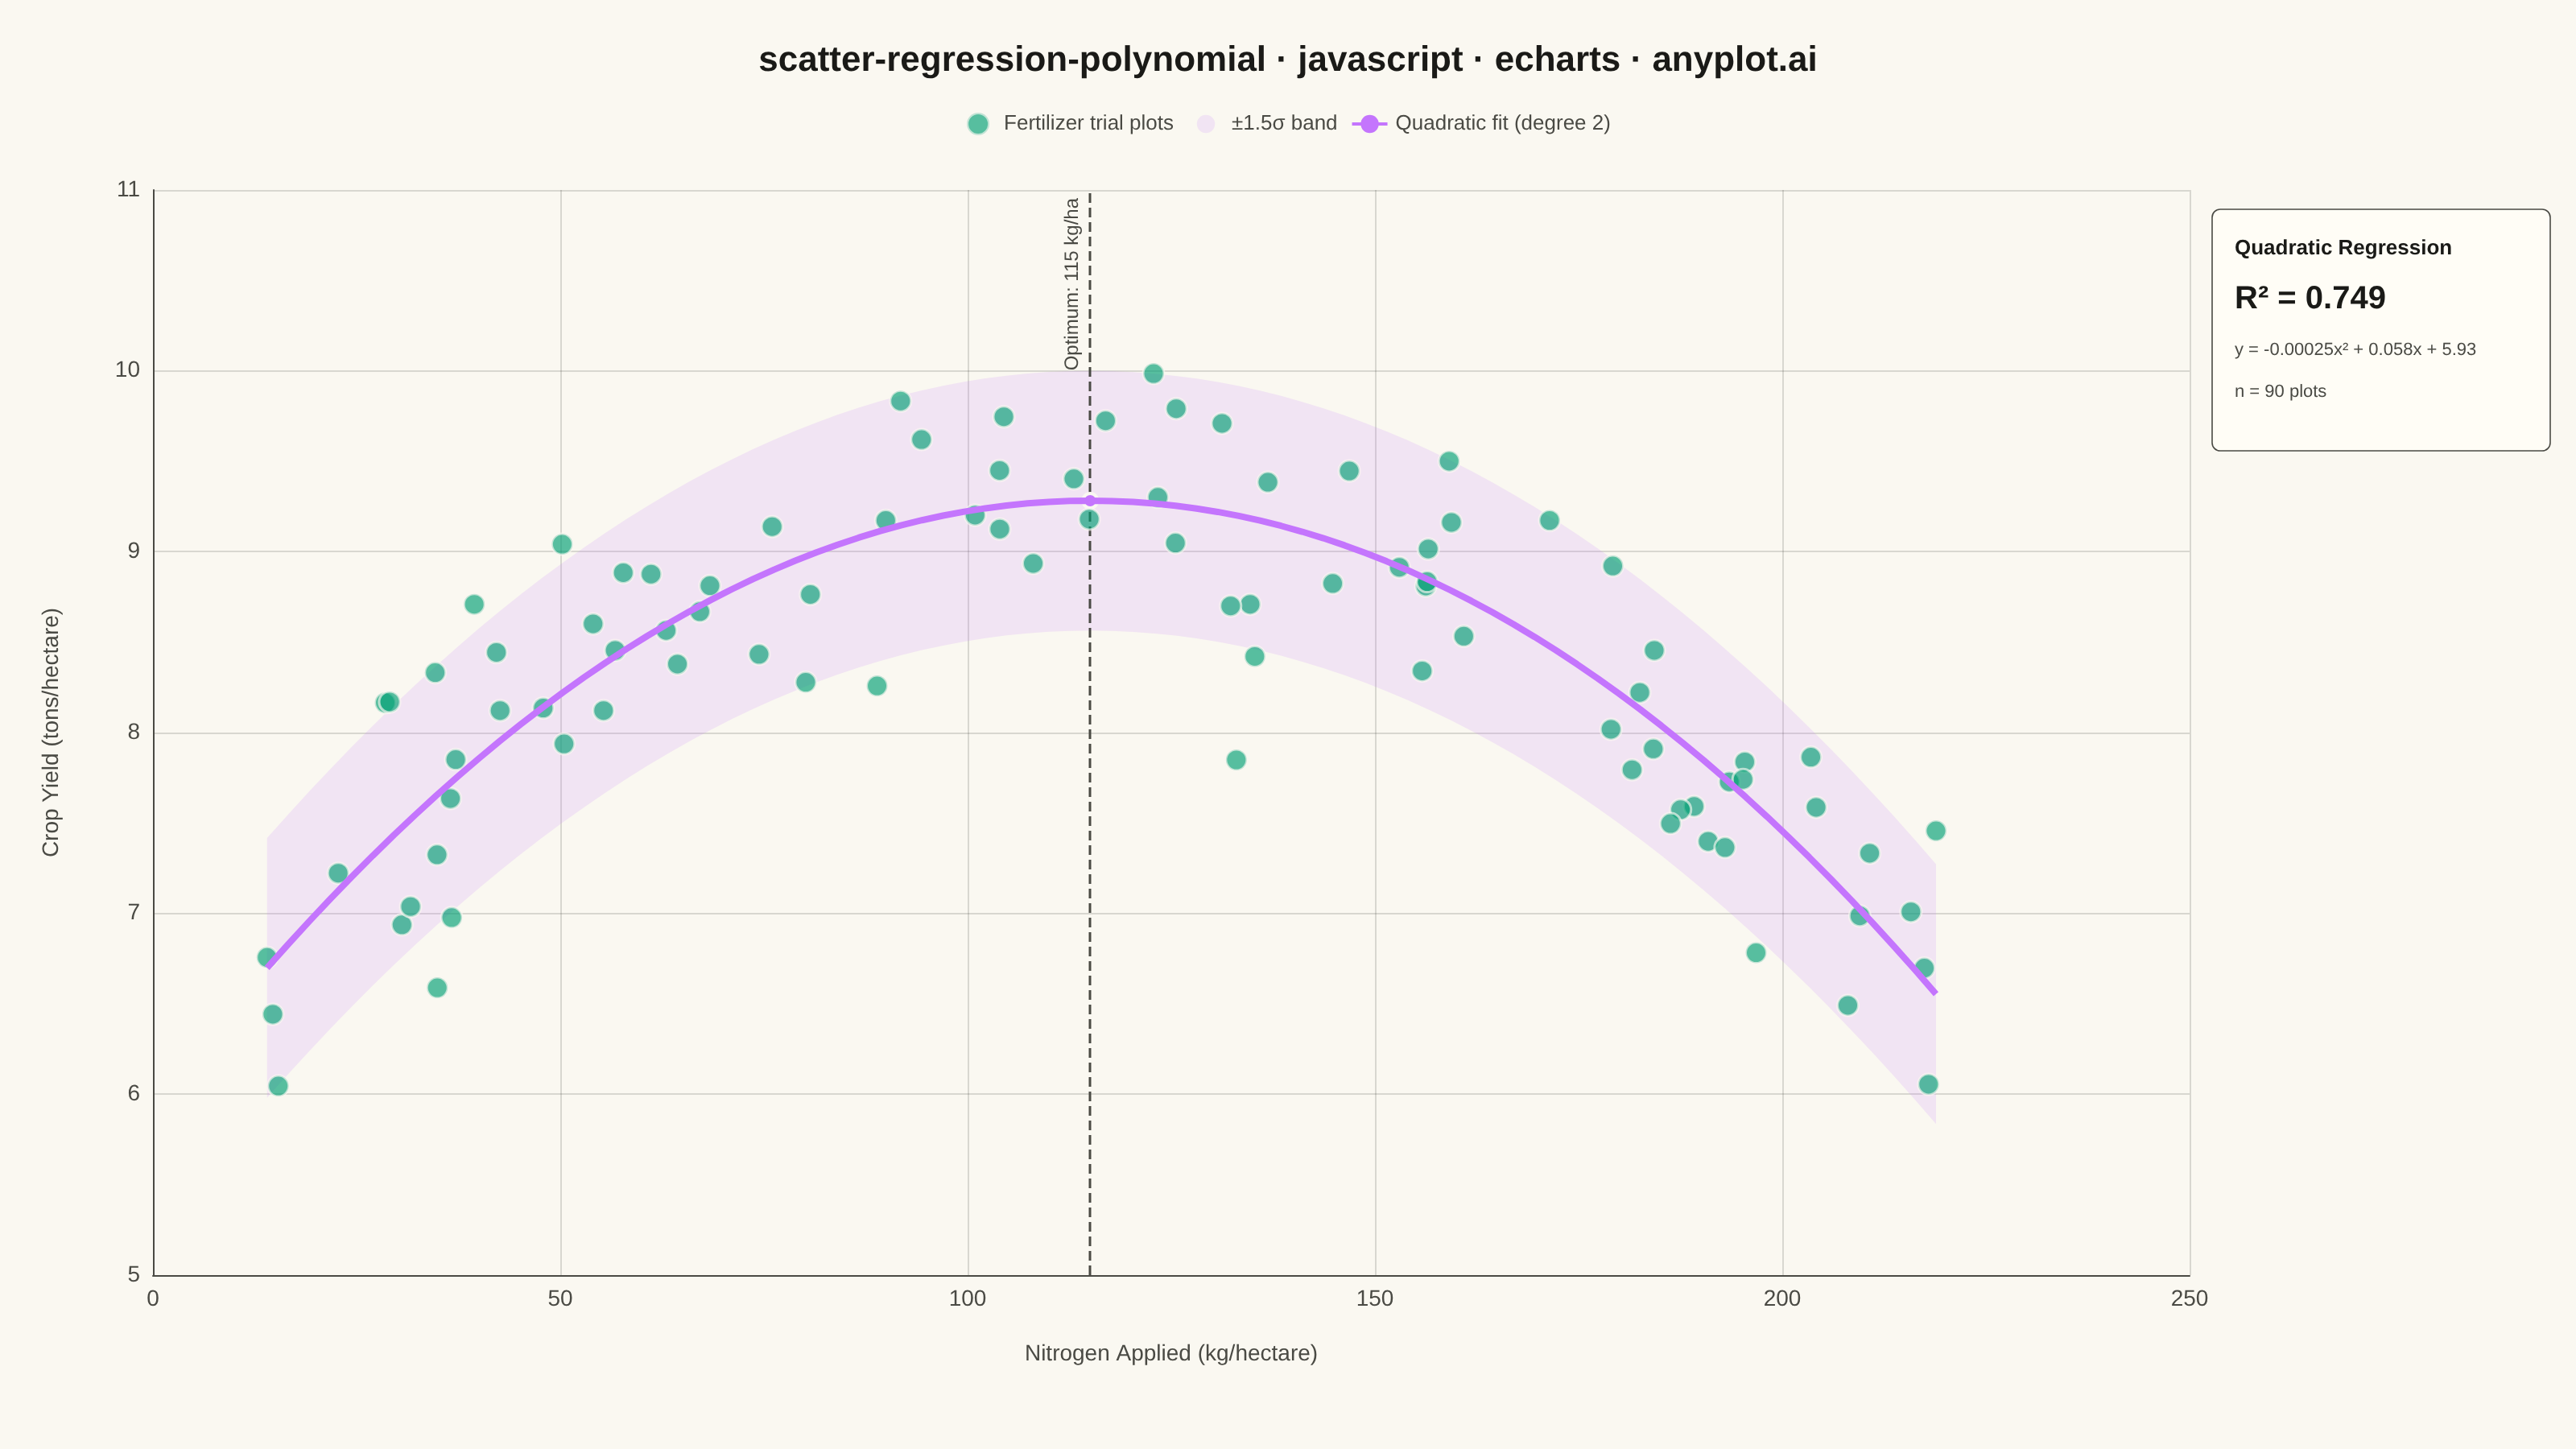
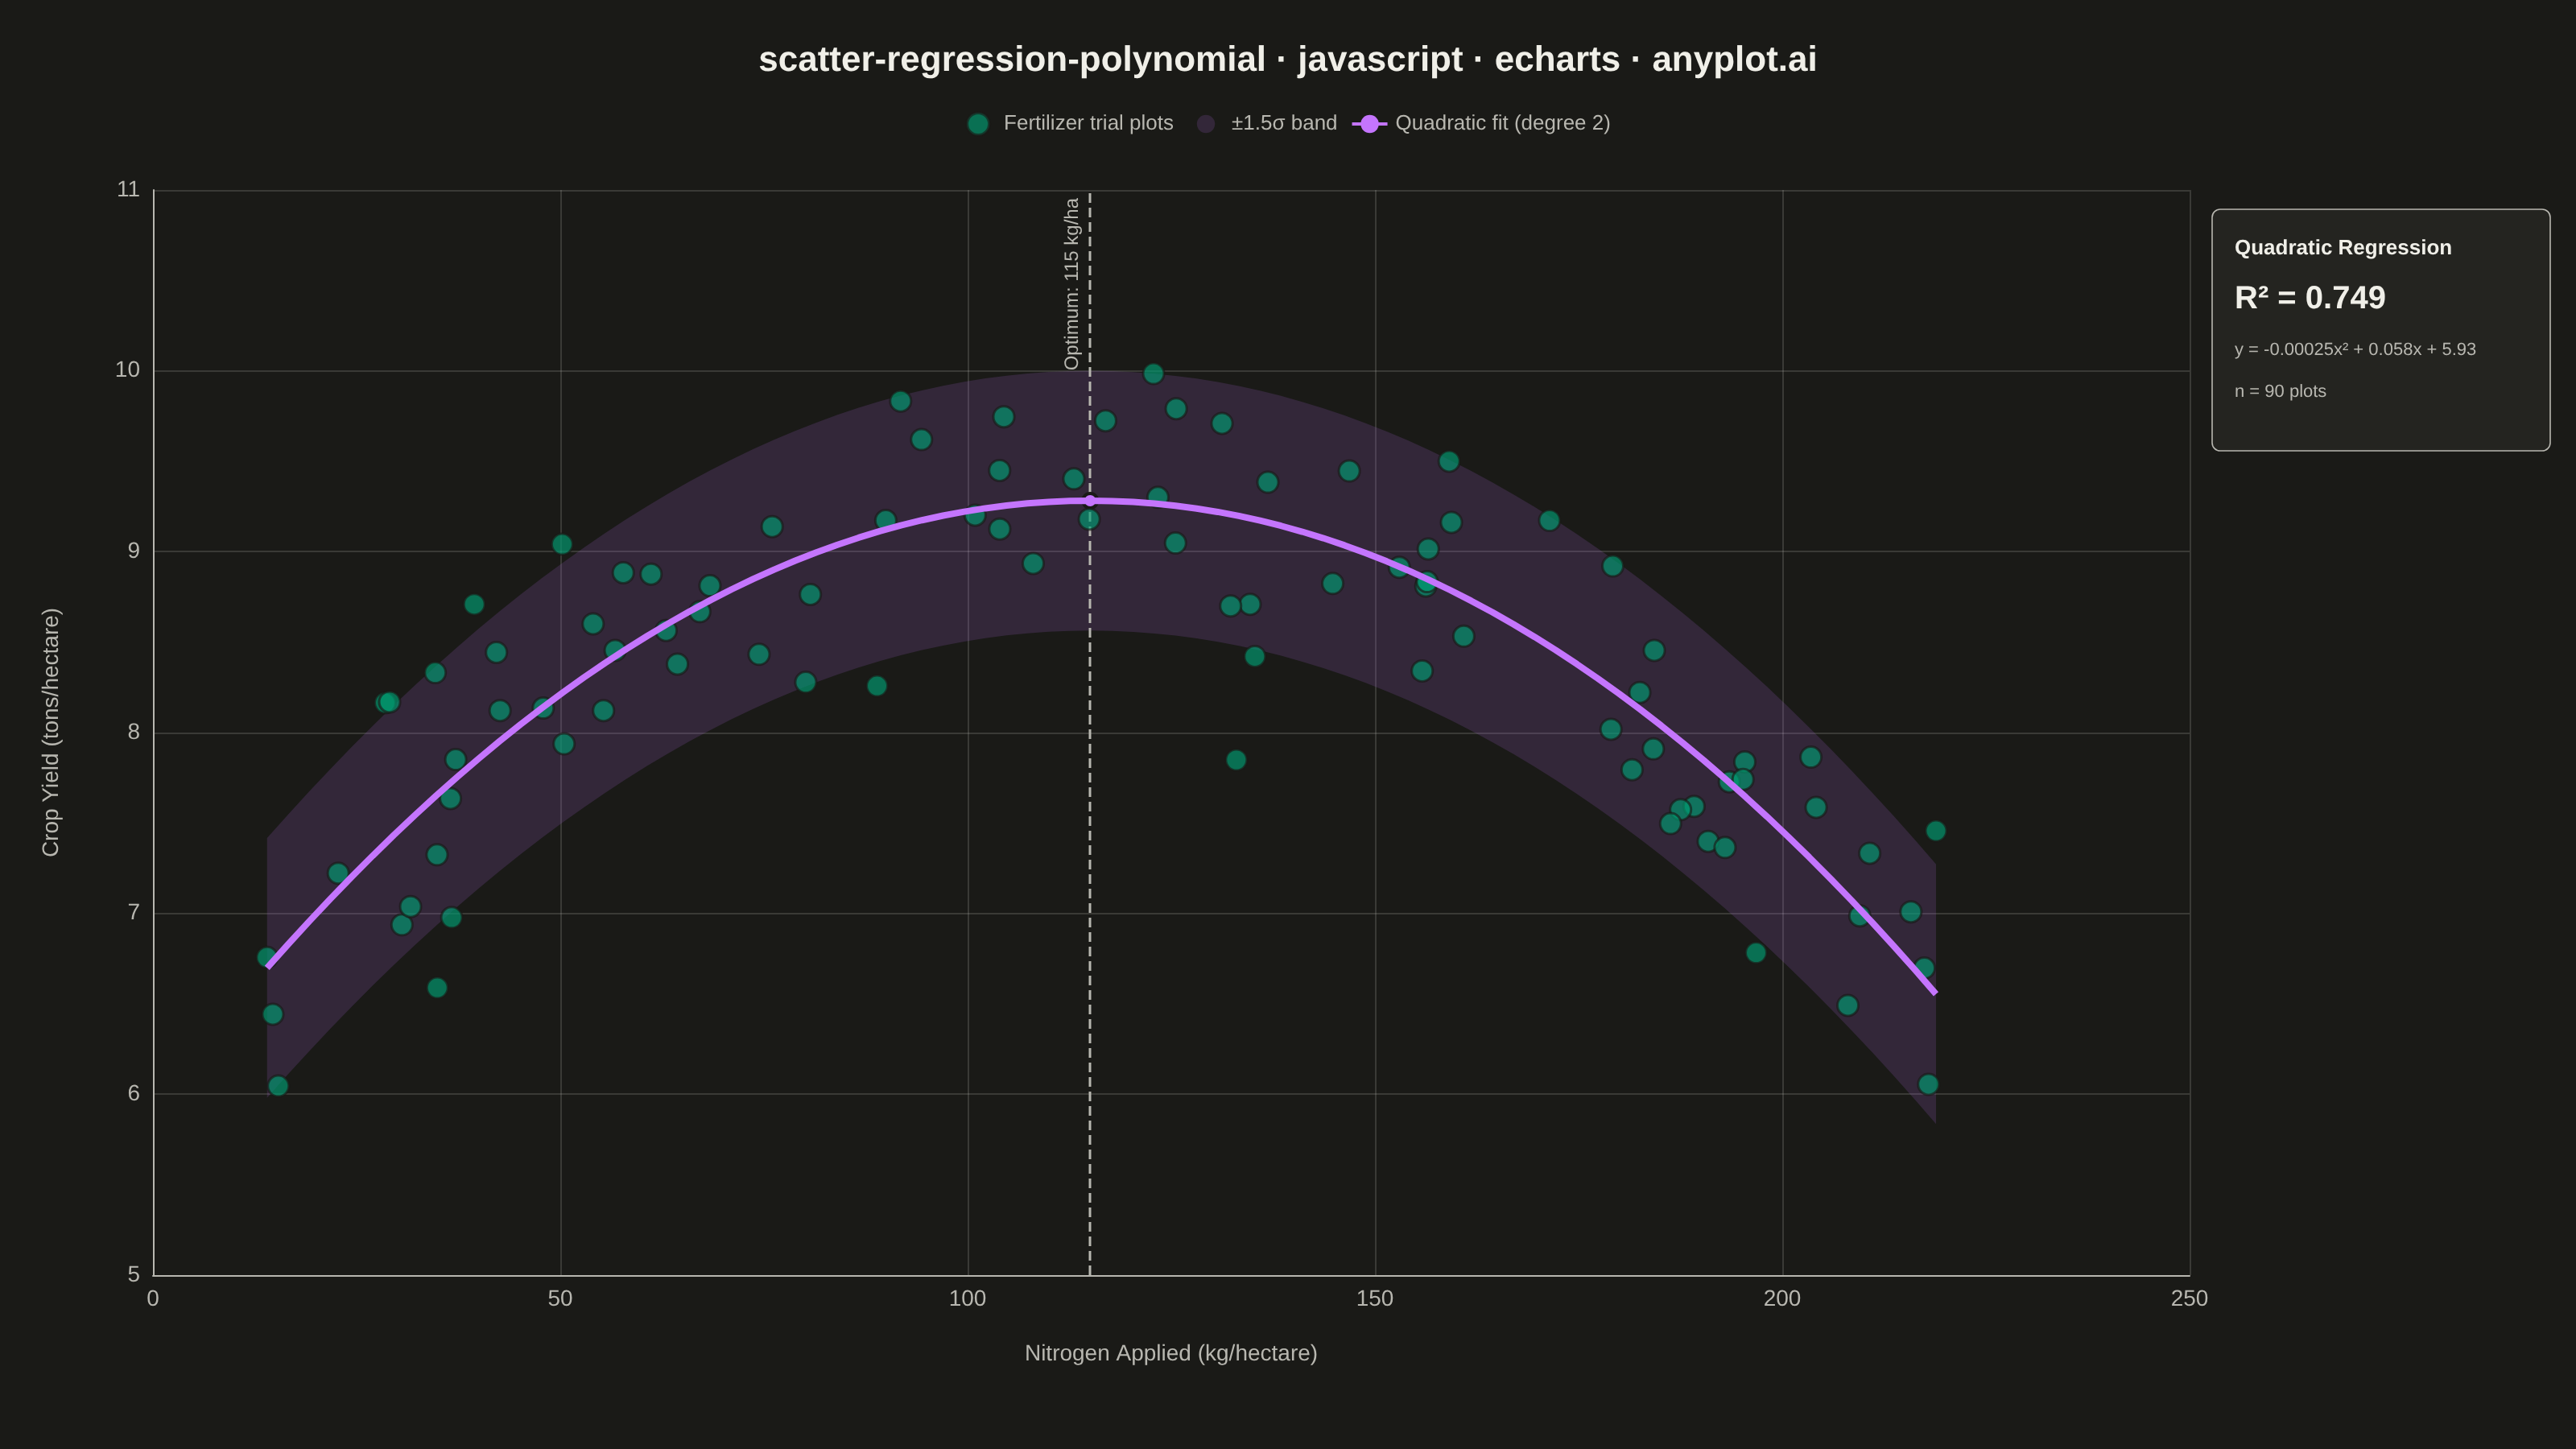
A scatter plot displaying the relationship between two numeric variables with a fitted polynomial regression curve (degree 2-4). This visualization extends beyond linear regression to capture non-linear relationships in data, making it ideal for modeling curved trends, parabolic patterns, and complex data relationships where a straight line would not adequately represent the underlying pattern.
Preview render from the Apache ECharts implementation.