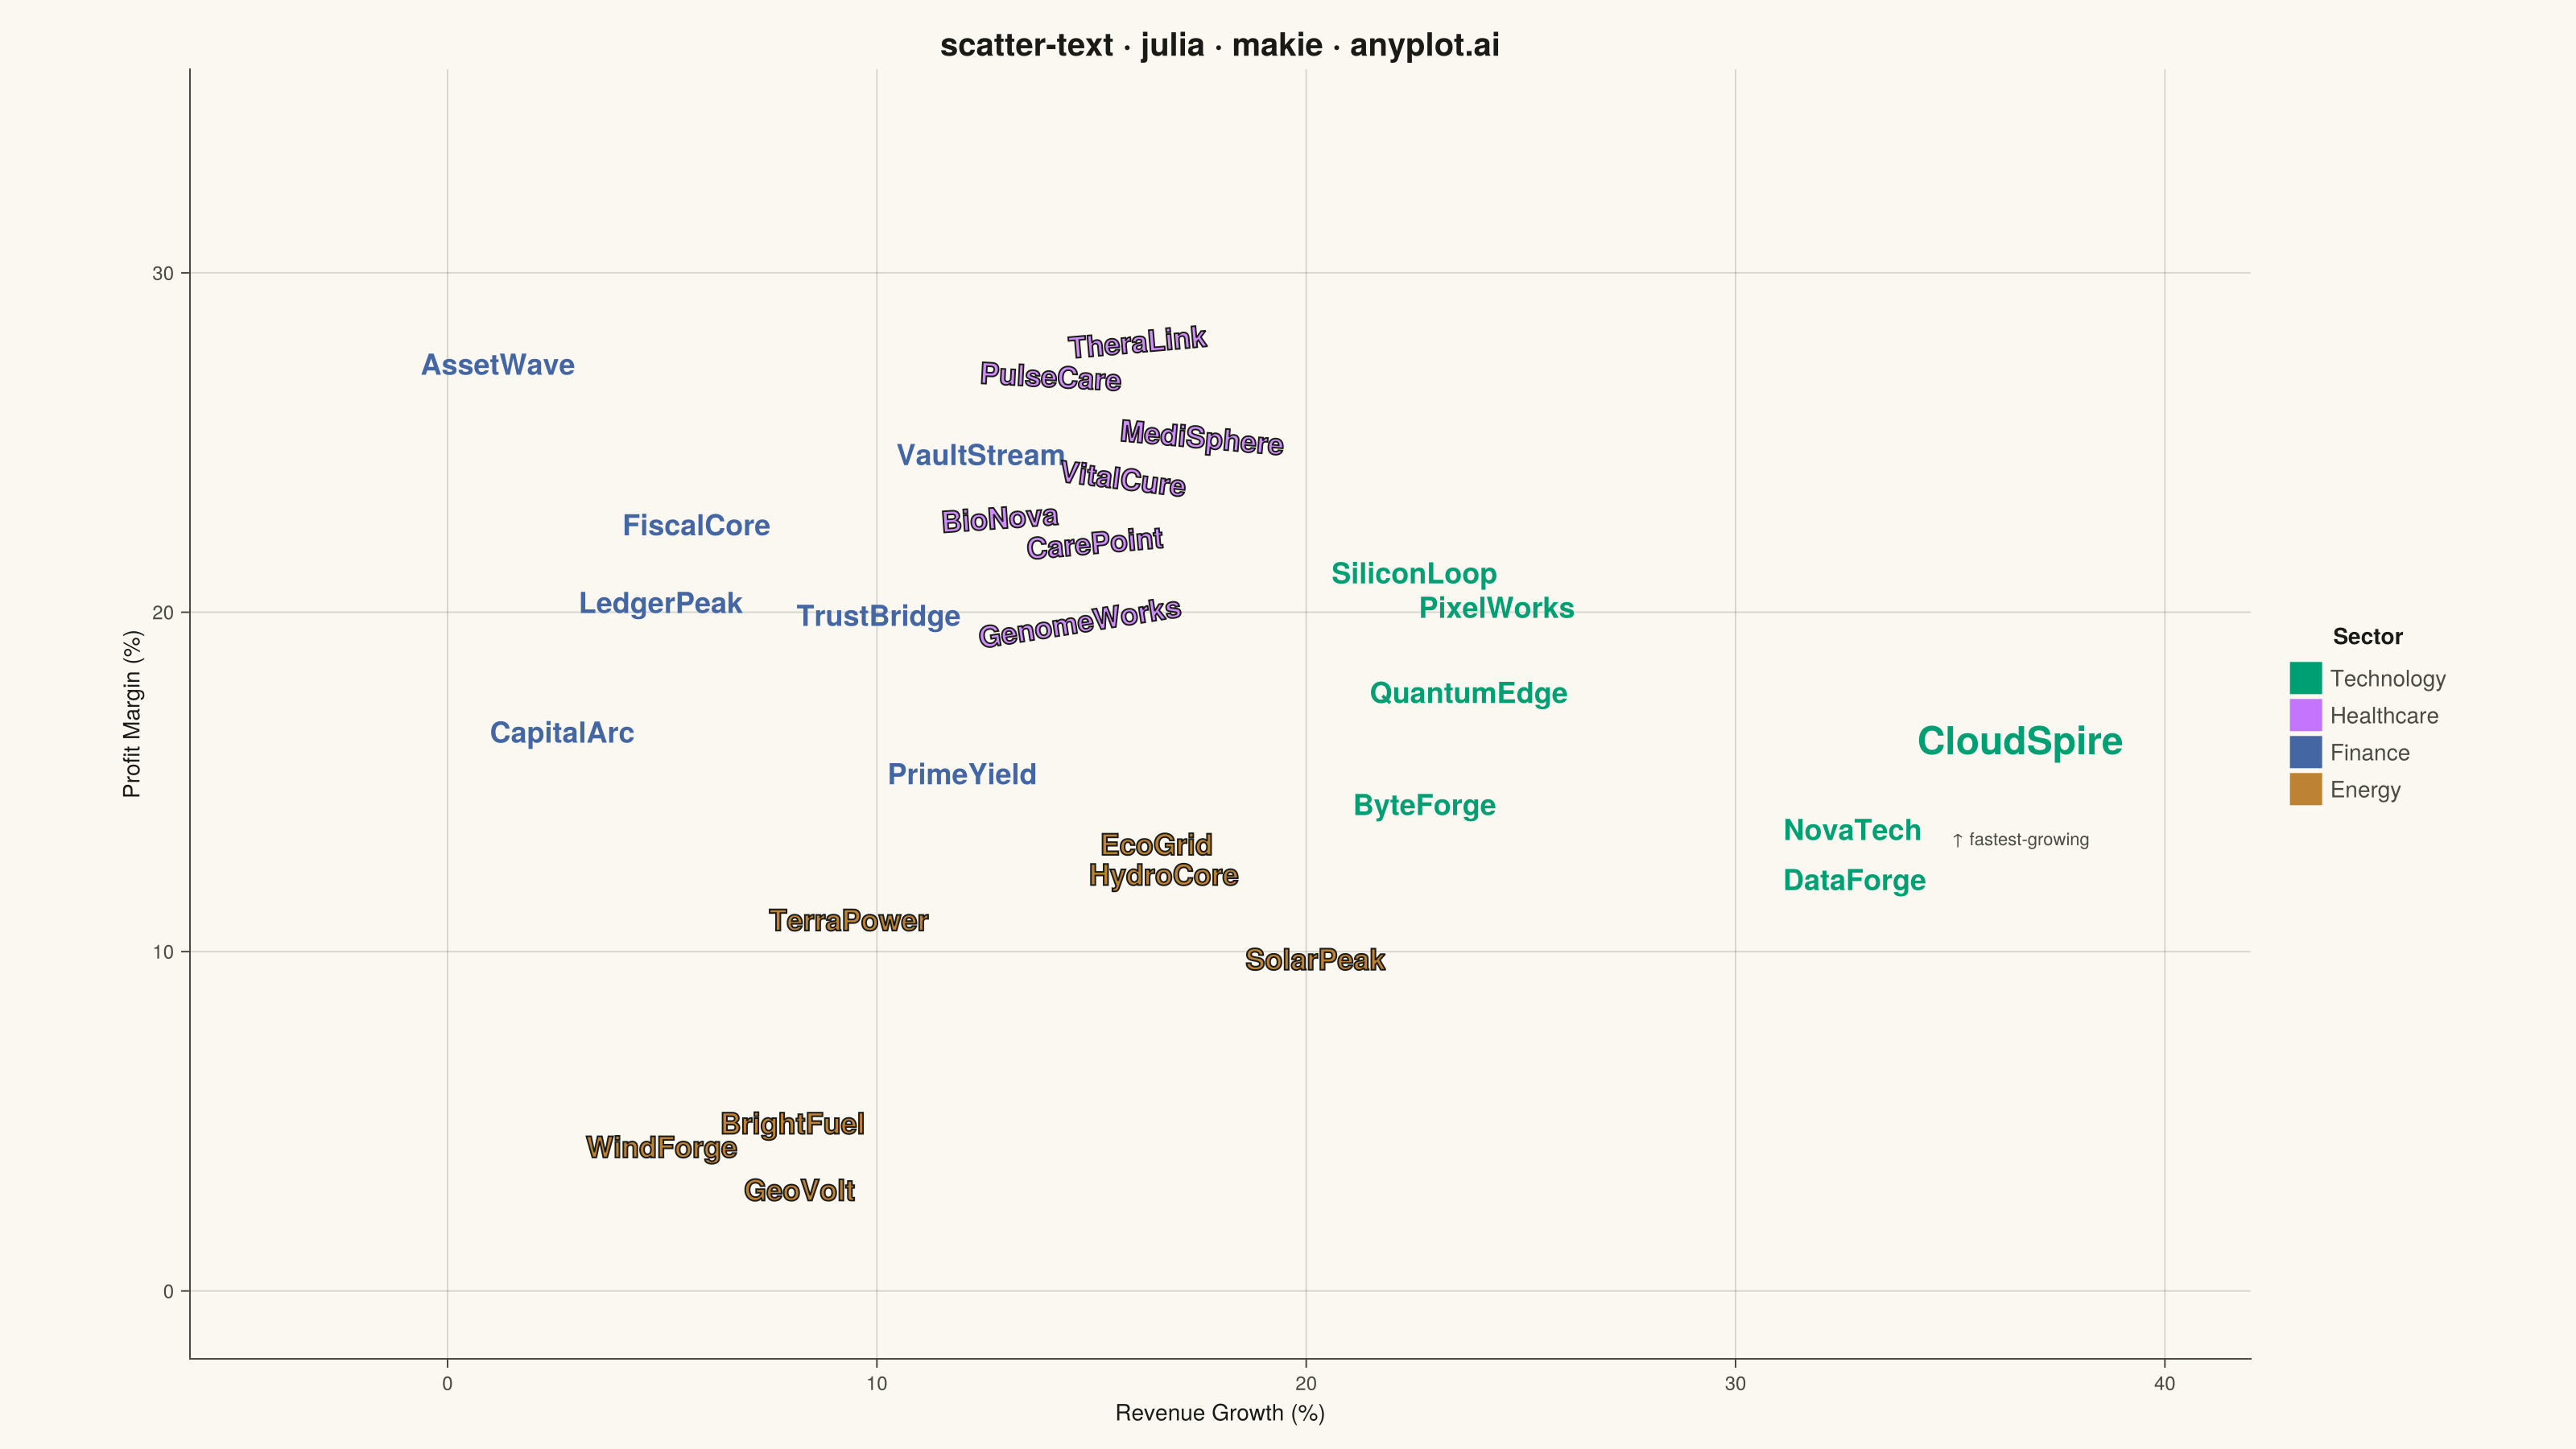
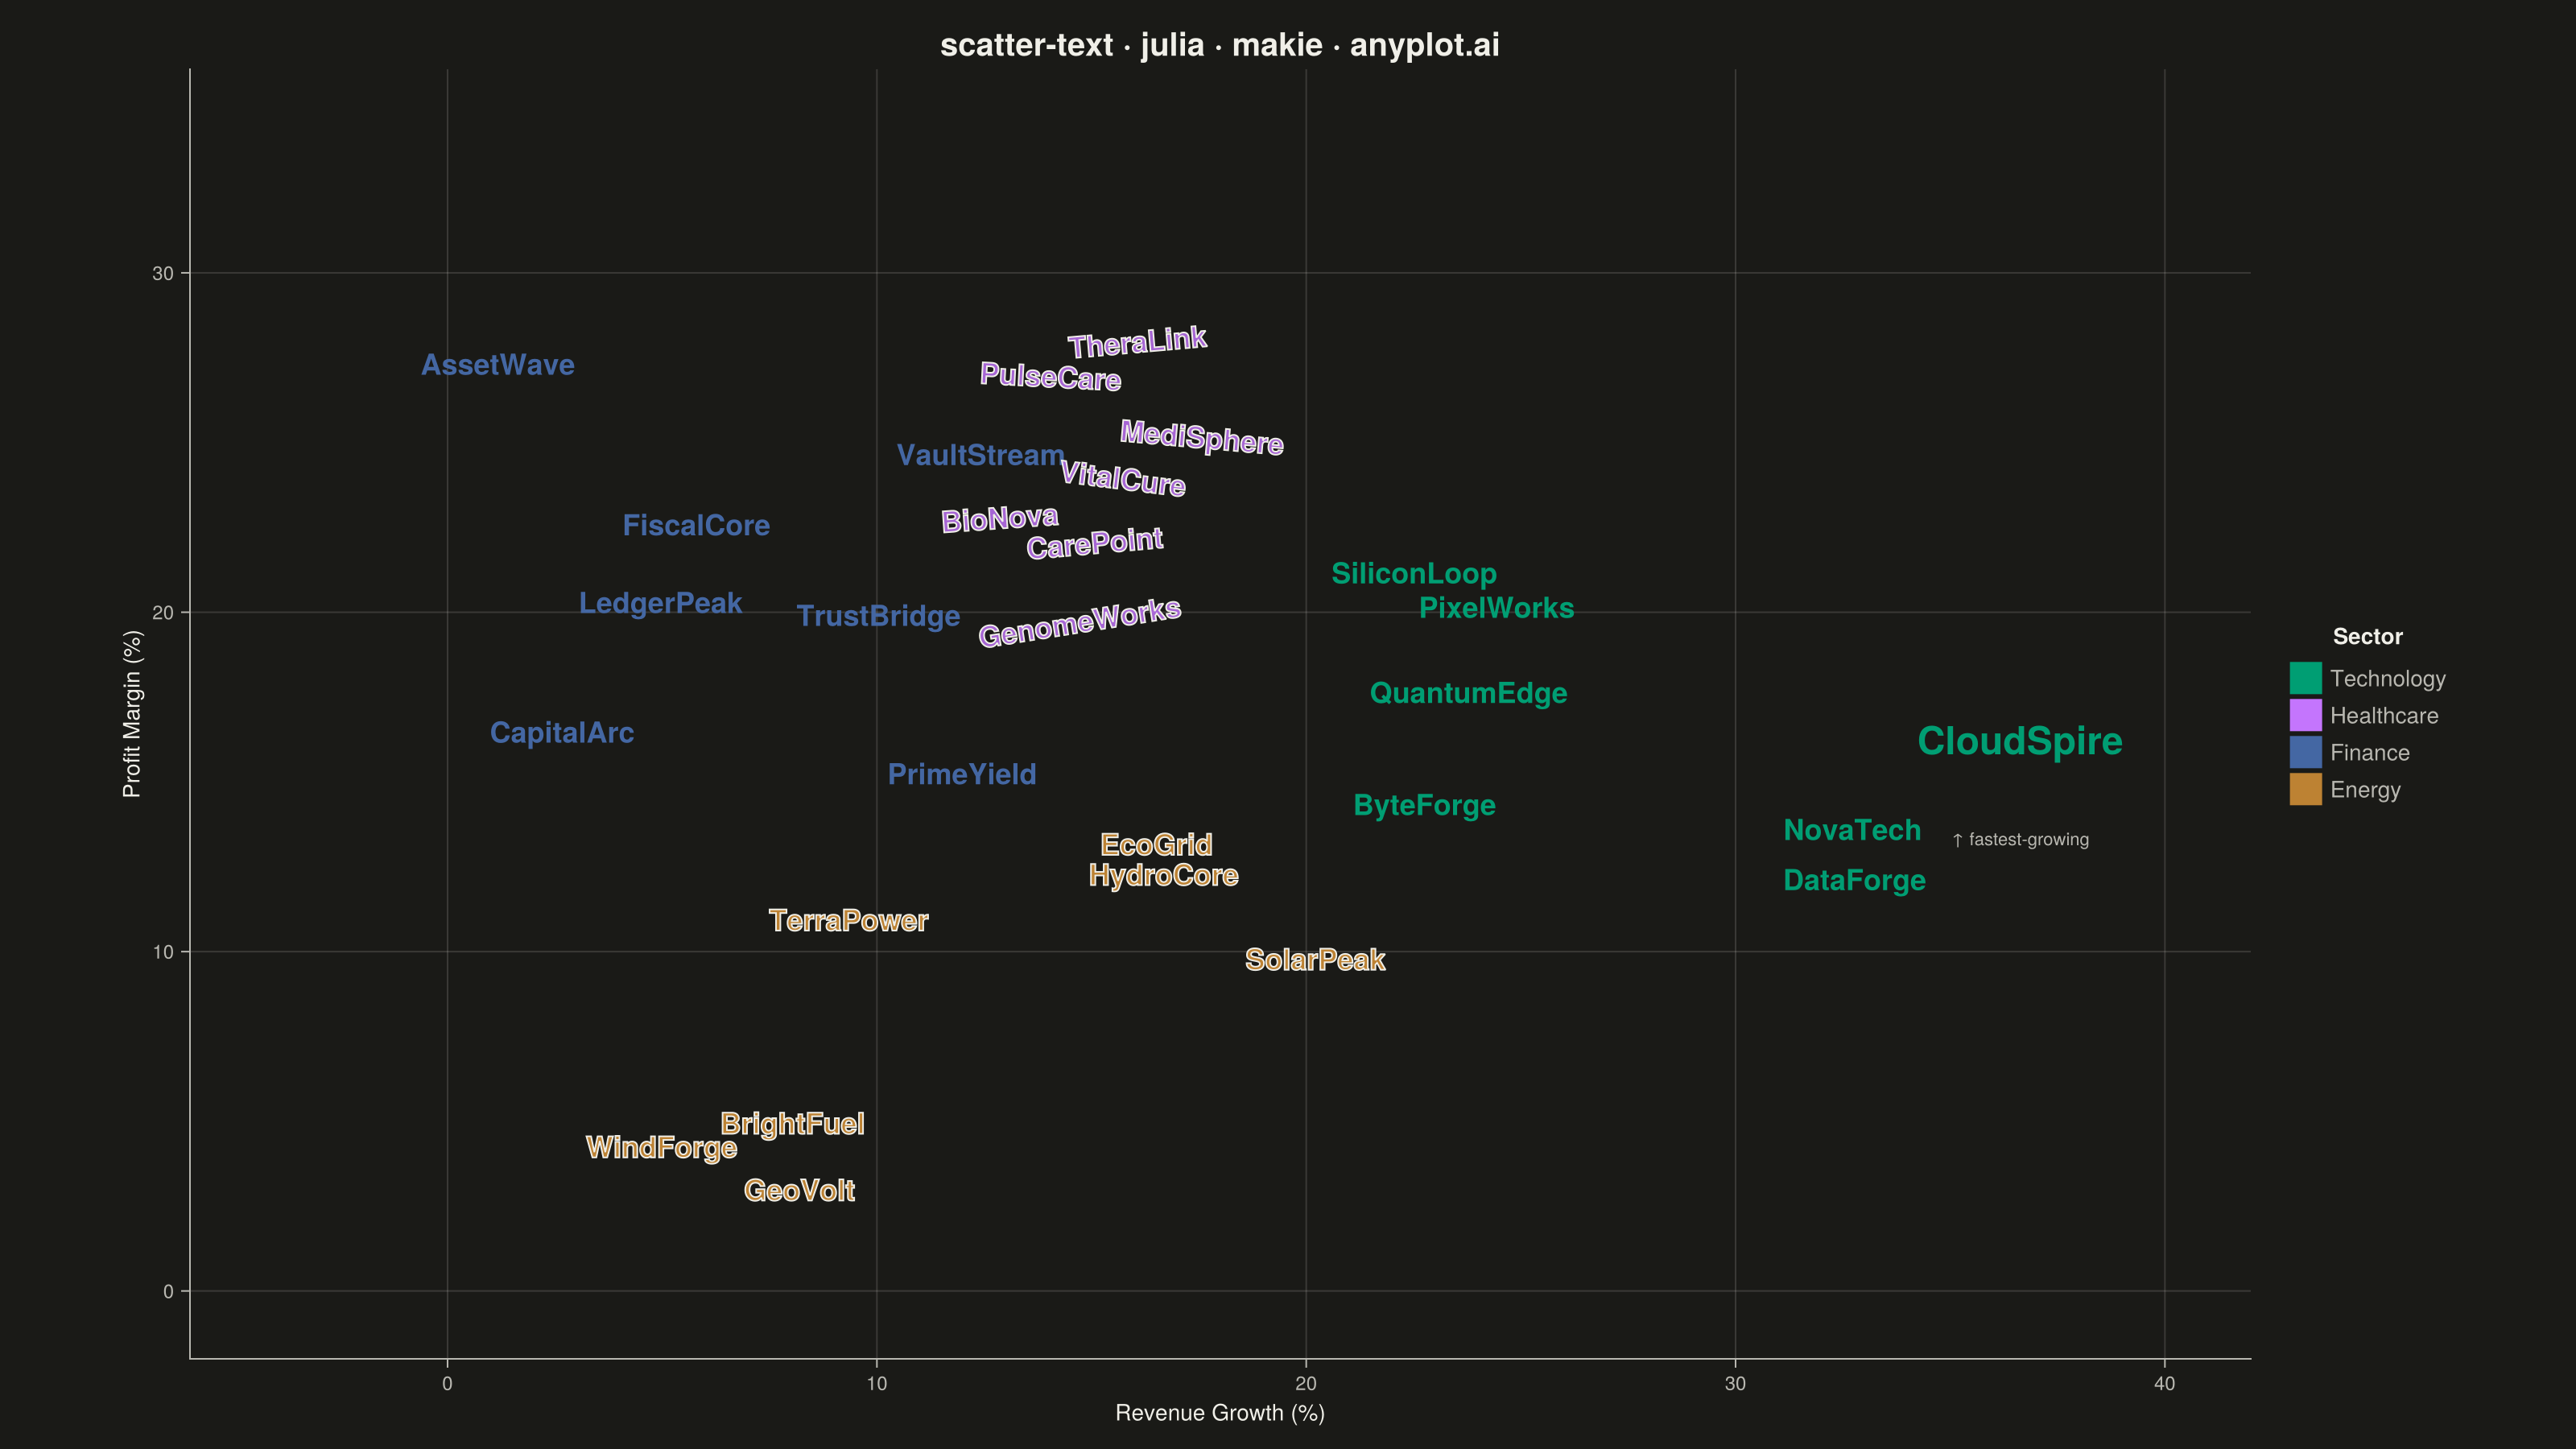
A scatter plot where data points are represented by text labels instead of markers. Each label is positioned at its corresponding coordinates, making the text itself the visual element. This visualization is particularly useful for displaying named entities in 2D space, such as word embeddings, dimensionality reduction outputs, or any scenario where identifying individual items by name is more important than seeing their relative density.
Preview render from the Makie.jl implementation.