The same plot in 14 other libraries — JavaScript: Chart.js, Apache ECharts, Highcharts, MUI X Charts; Python: Altair, Bokeh, lets-plot, Matplotlib, Plotly, plotnine, Pygal, Seaborn; R: ggplot2; Julia: Makie.jl. Compare all 15 side by side: Scatter Plot with Text Labels Instead of Points in Python, R, Julia and JavaScript.
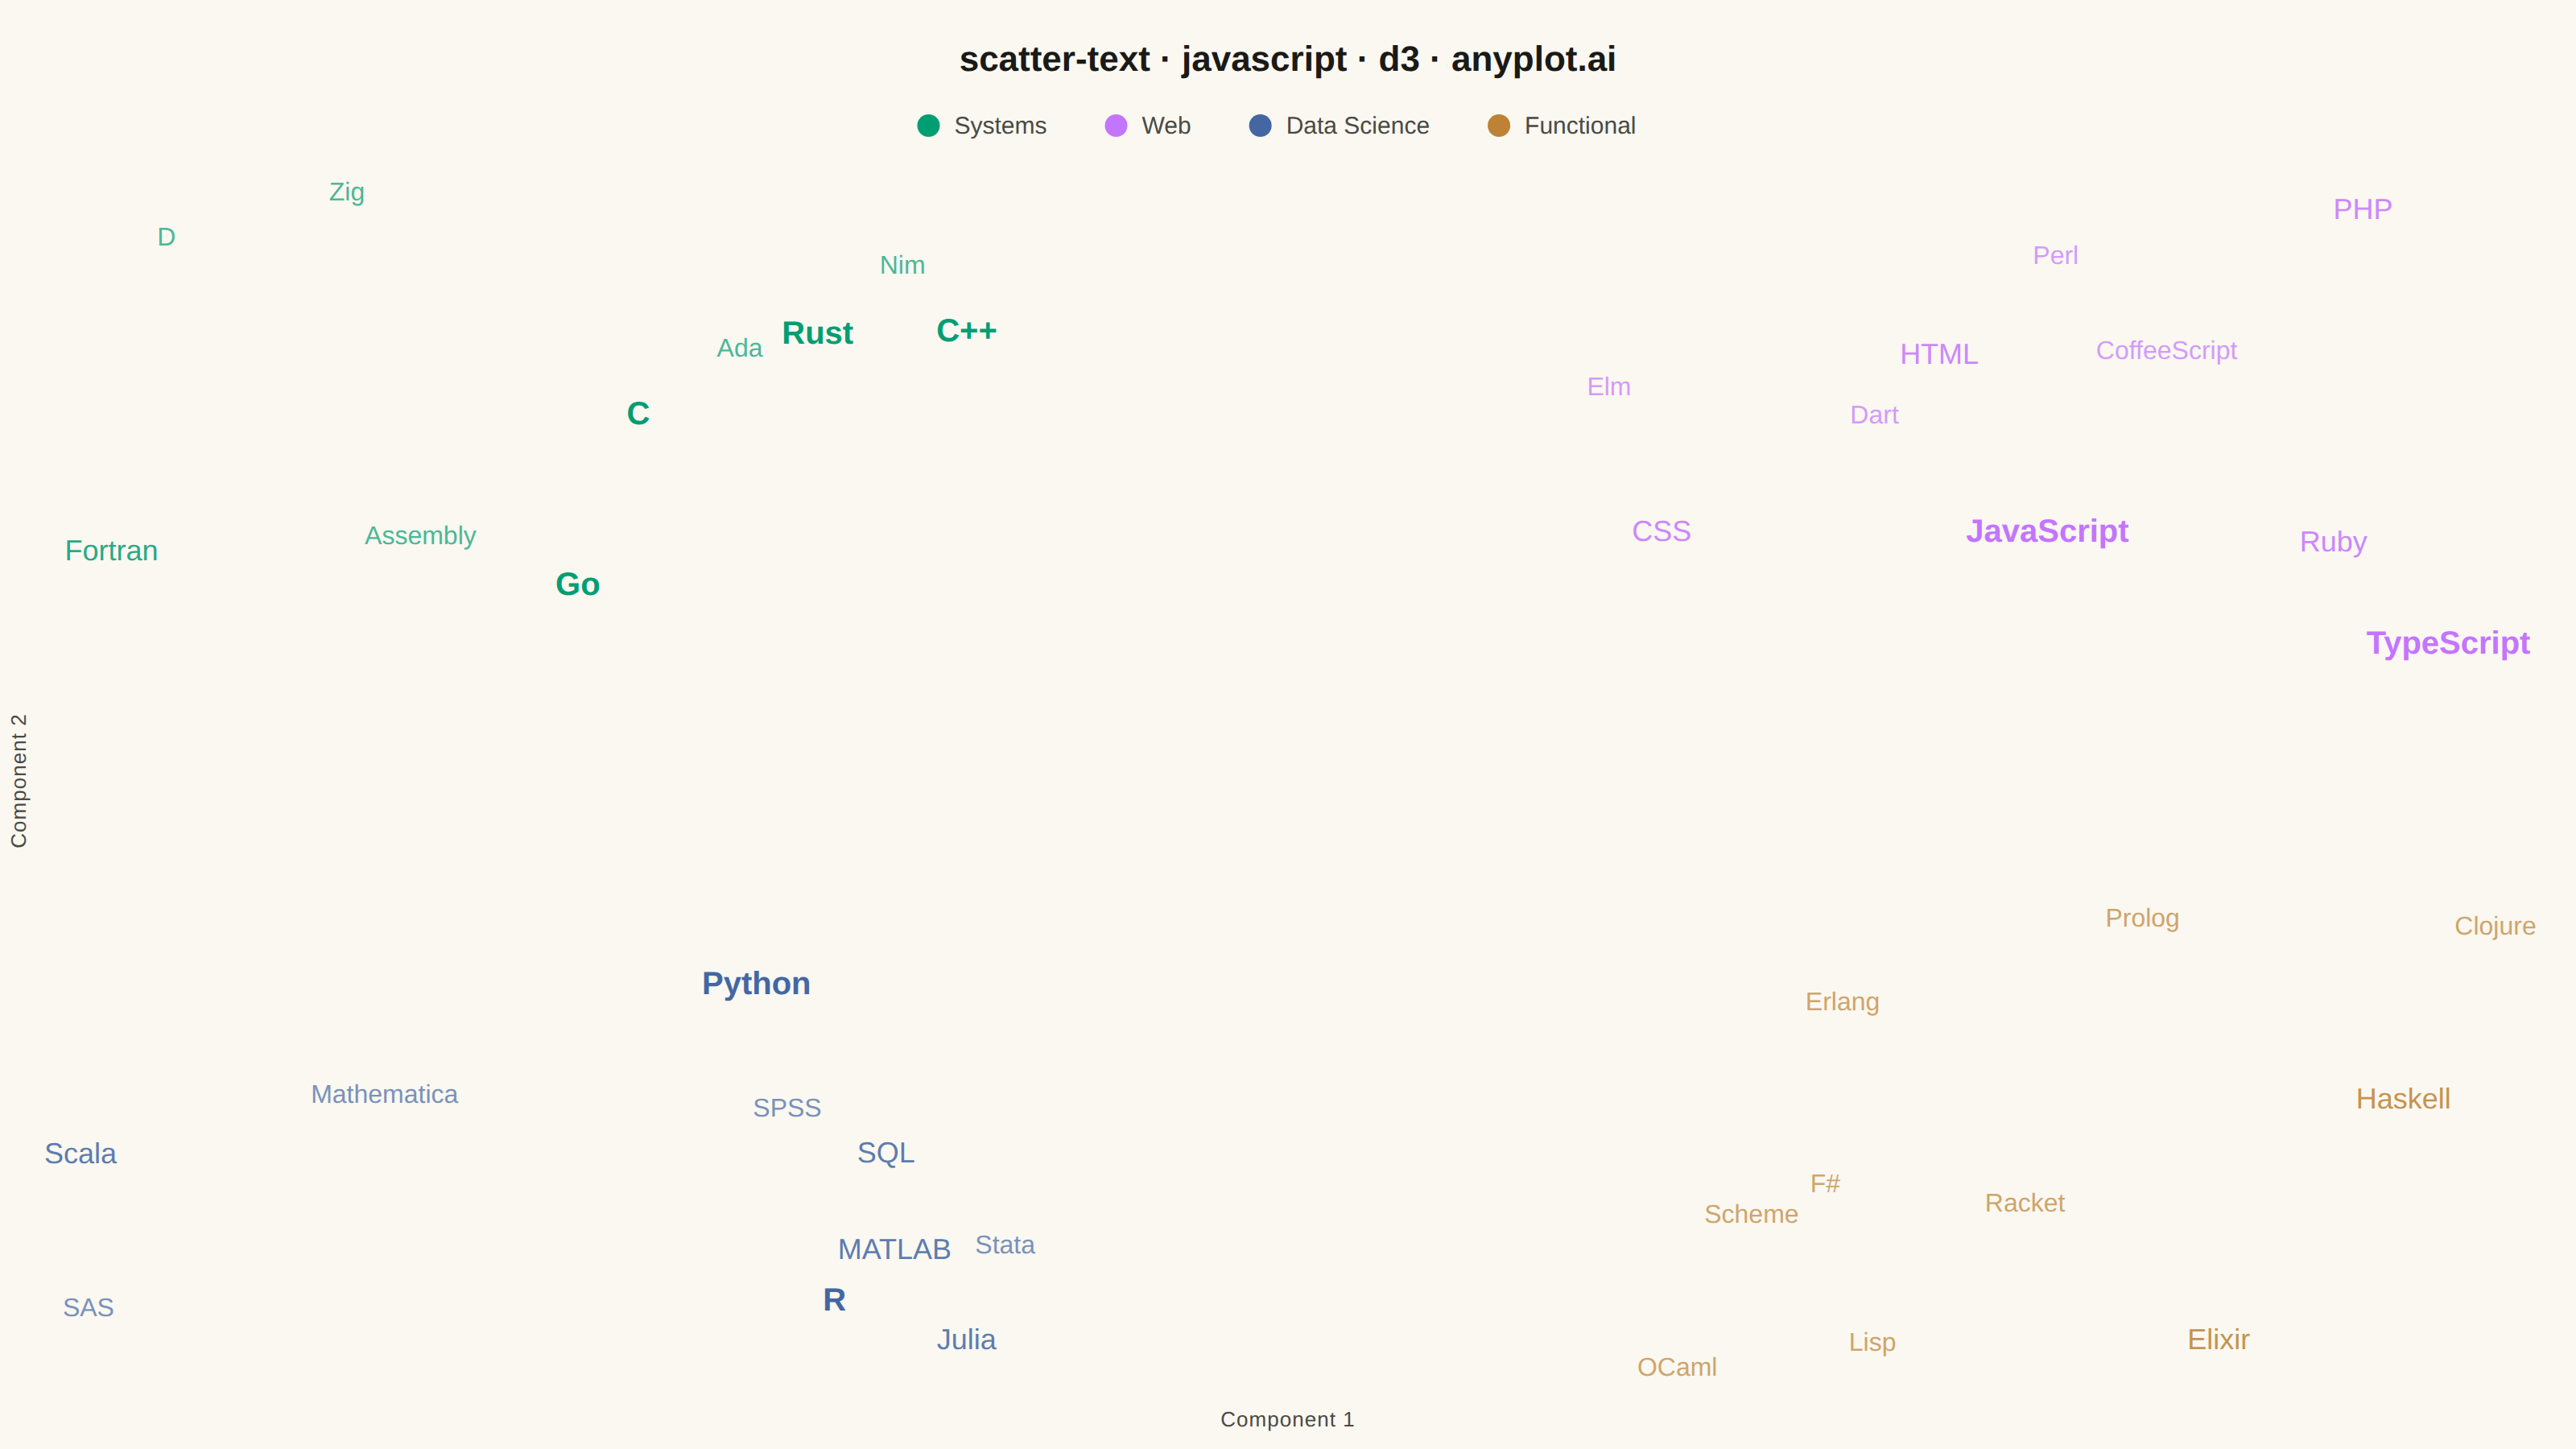
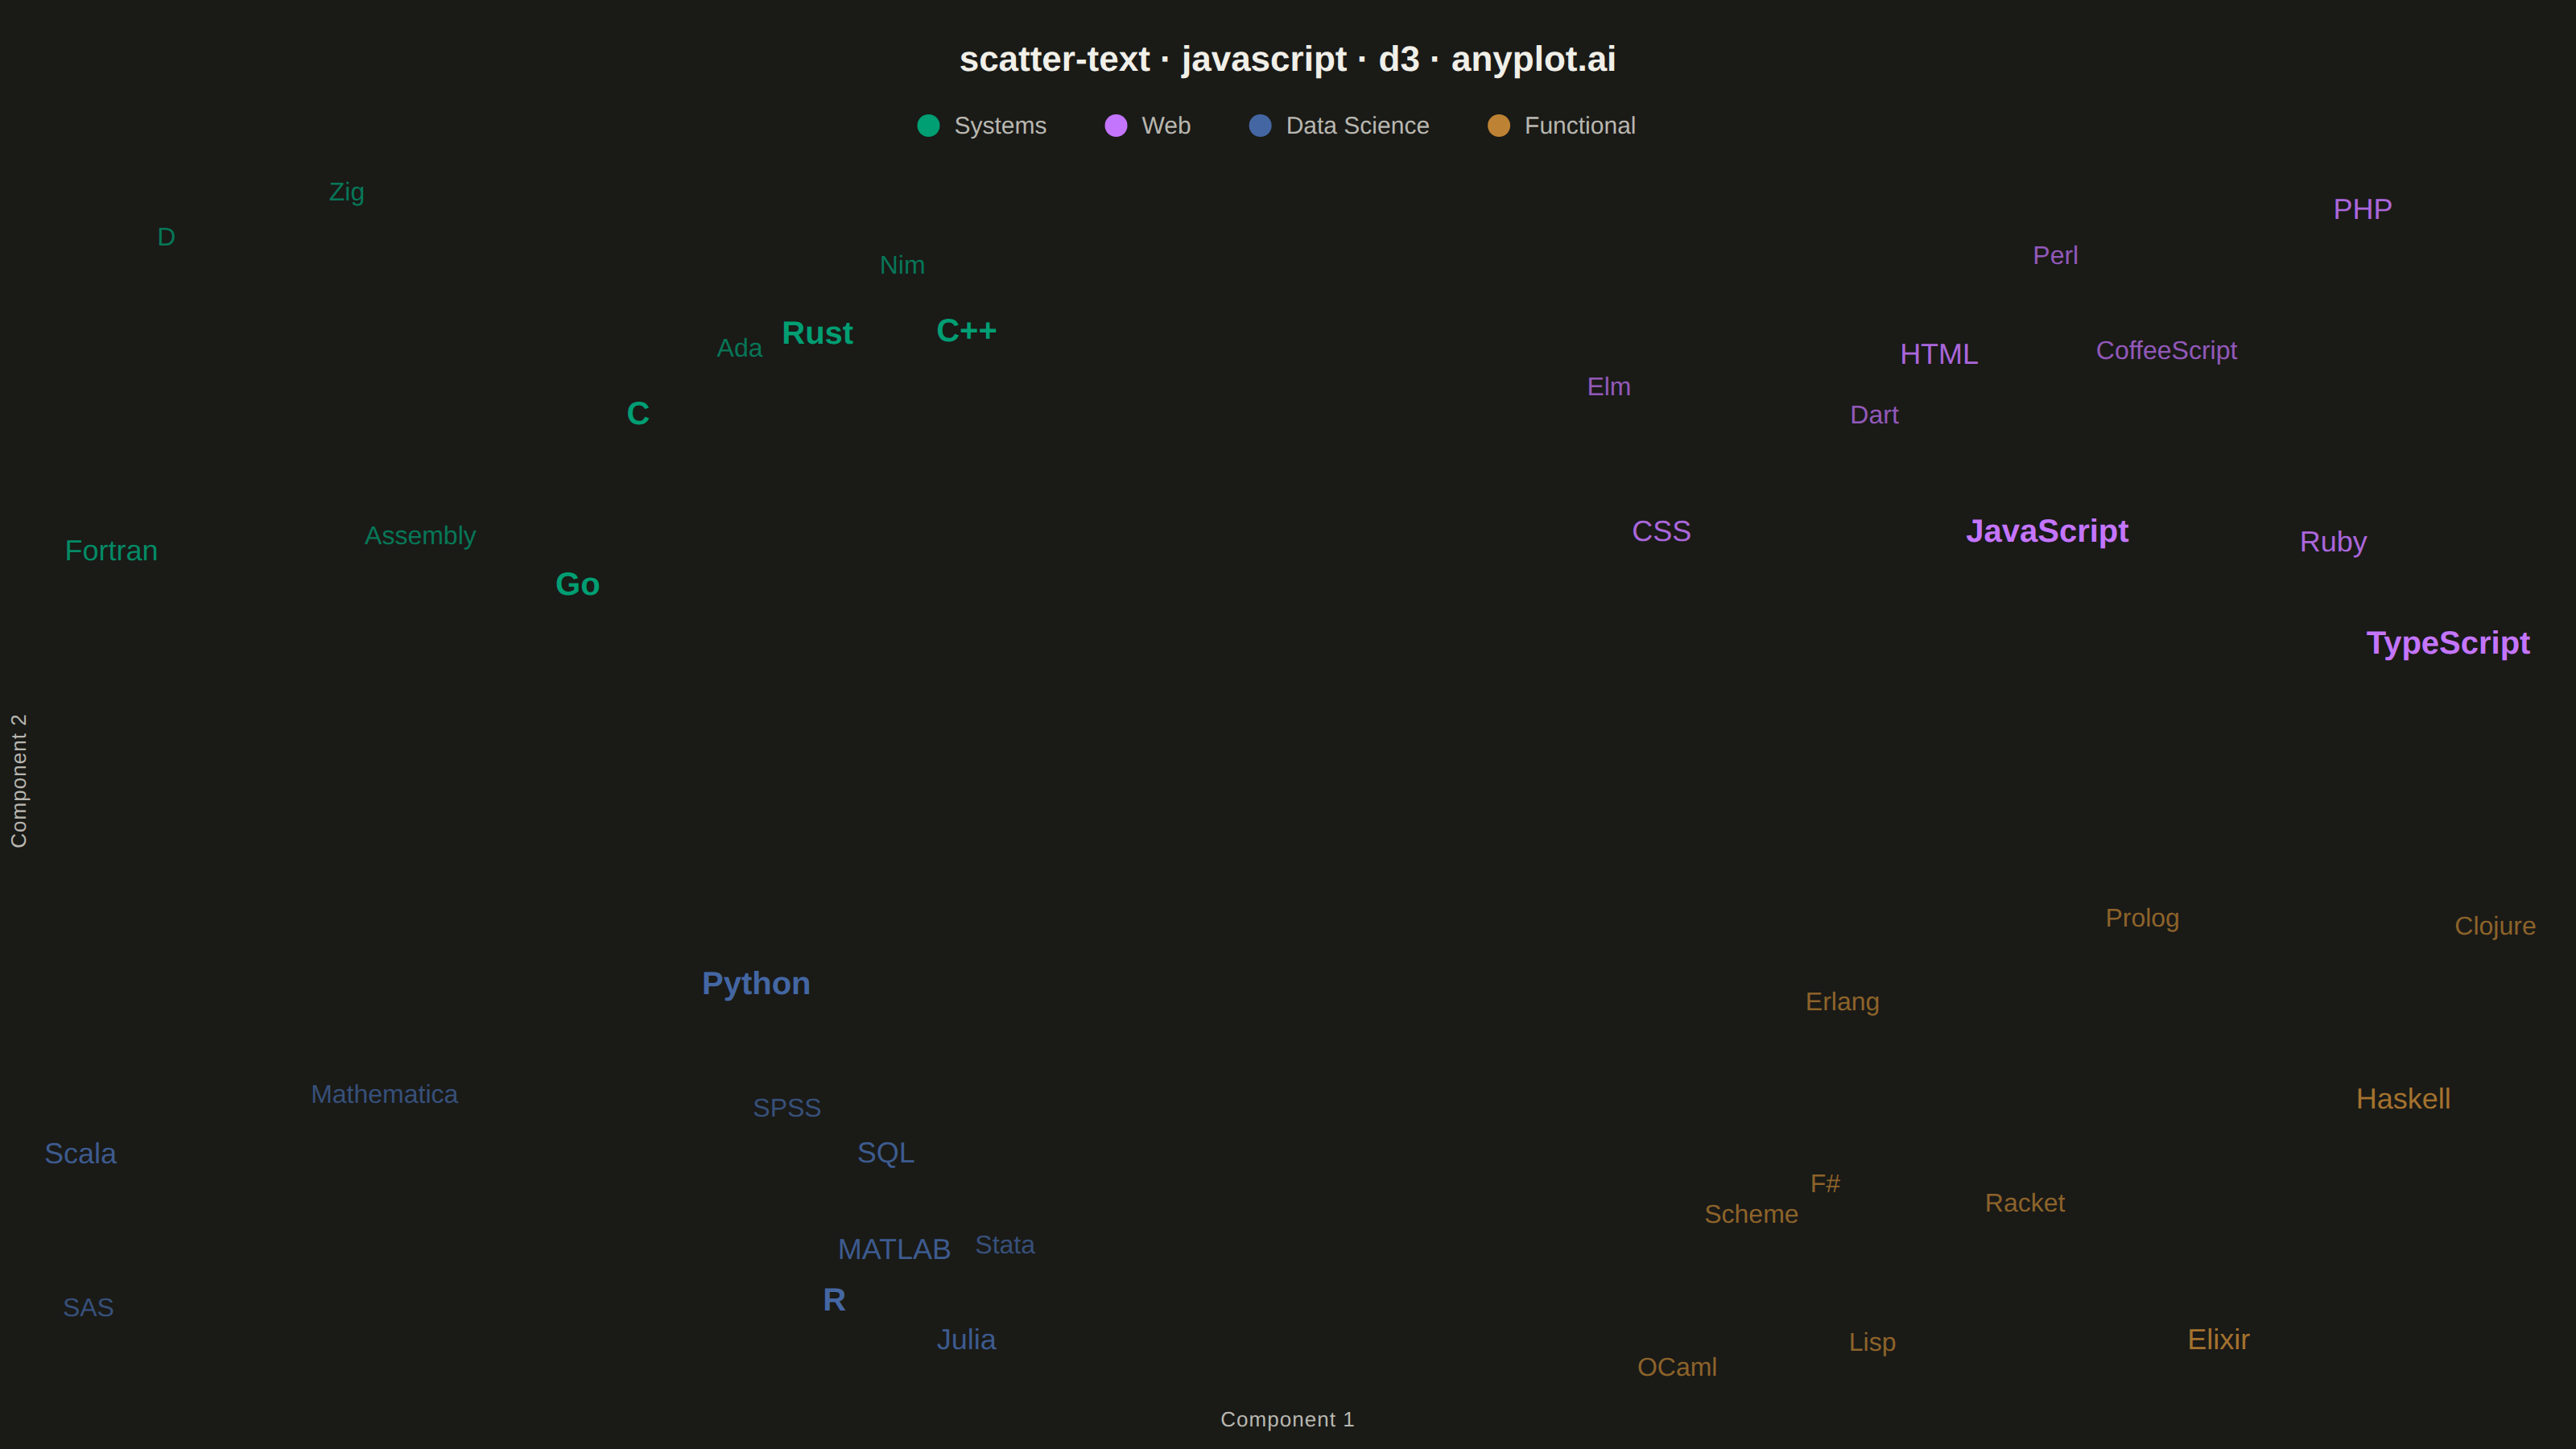
A scatter plot where data points are represented by text labels instead of markers. Each label is positioned at its corresponding coordinates, making the text itself the visual element. This visualization is particularly useful for displaying named entities in 2D space, such as word embeddings, dimensionality reduction outputs, or any scenario where identifying individual items by name is more important than seeing their relative density.
// anyplot.ai
// scatter-text: Scatter Plot with Text Labels Instead of Points
// Library: d3 7.9.0 | JavaScript 22.23.2
// Quality: 92/100 | Created: 2026-09-02

//# anyplot-orientation: landscape
const t = window.ANYPLOT_TOKENS;
const { width, height } = window.ANYPLOT_SIZE;
const margin = { top: 120, right: 50, bottom: 50, left: 50 };
const iw = width - margin.left - margin.right;
const ih = height - margin.top - margin.bottom;

// --- Data (in-memory, deterministic LCG — the browser has no seeded RNG) ---
let seed = 42;
function rand() {
  seed = (seed * 1103515245 + 12345) % 2147483648;
  return seed / 2147483648;
}

// Programming languages positioned as if by dimensionality reduction over a
// paradigm/use-case embedding — four loosely separated islands, matching the
// "word embeddings after t-SNE/UMAP" application from the specification.
const CATEGORIES = [
  { name: "Systems", cx: 25, cy: 75 },
  { name: "Web", cx: 75, cy: 75 },
  { name: "Data Science", cx: 25, cy: 25 },
  { name: "Functional", cx: 75, cy: 25 },
];

// [label, prominence] — prominence (1-3) drives font size + opacity so
// well-known languages read first, echoing real embedding-plot hierarchy.
const LANGUAGES = {
  Systems: [["C", 3], ["C++", 3], ["Rust", 3], ["Go", 3], ["Fortran", 2], ["Zig", 1], ["Ada", 1], ["Assembly", 1], ["D", 1], ["Nim", 1]],
  Web: [["JavaScript", 3], ["TypeScript", 3], ["PHP", 2], ["Ruby", 2], ["HTML", 2], ["CSS", 2], ["Perl", 1], ["Dart", 1], ["Elm", 1], ["CoffeeScript", 1]],
  "Data Science": [["Python", 3], ["R", 3], ["SQL", 2], ["Julia", 2], ["MATLAB", 2], ["Scala", 2], ["SAS", 1], ["Stata", 1], ["Mathematica", 1], ["SPSS", 1]],
  Functional: [["Haskell", 2], ["Elixir", 2], ["Lisp", 1], ["Clojure", 1], ["Erlang", 1], ["F#", 1], ["OCaml", 1], ["Scheme", 1], ["Prolog", 1], ["Racket", 1]],
};

const raw = [];
for (const cat of CATEGORIES) {
  for (const [label, prominence] of LANGUAGES[cat.name]) {
    raw.push({
      label,
      category: cat.name,
      prominence,
      dataX: cat.cx + (rand() - 0.5) * 32,
      dataY: cat.cy + (rand() - 0.5) * 32,
    });
  }
}

const FONT_SIZE = { 1: 16, 2: 18, 3: 20 };
const OPACITY = { 1: 0.7, 2: 0.85, 3: 1 };
const halfWidth = (d) => (d.label.length * FONT_SIZE[d.prominence]) / 3.1 + 4;

// --- Scales -------------------------------------------------------------
const x = d3.scaleLinear().domain(d3.extent(raw, (d) => d.dataX)).range([0, iw]);
const y = d3.scaleLinear().domain(d3.extent(raw, (d) => d.dataY)).range([ih, 0]);
const color = d3.scaleOrdinal().domain(CATEGORIES.map((c) => c.name)).range(t.palette);

// Target pixel positions from the data coordinates, then let a stopped
// force simulation nudge only the colliding labels apart (forceX/forceY pull
// each label back toward its true coordinate; forceCollide keeps label boxes
// from overlapping) — ticked synchronously since the render is a single frame.
const data = raw.map((d) => {
  const px = x(d.dataX);
  const py = y(d.dataY);
  return { ...d, px, py, x: px, y: py };
});
const simulation = d3
  .forceSimulation(data)
  .force("x", d3.forceX((d) => d.px).strength(0.9))
  .force("y", d3.forceY((d) => d.py).strength(0.9))
  .force("collide", d3.forceCollide(halfWidth).iterations(4))
  .stop();
for (let i = 0; i < 250; i += 1) simulation.tick();

// --- SVG mount ------------------------------------------------------------
const svg = d3.select("#container").append("svg").attr("width", width).attr("height", height);
const g = svg.append("g").attr("transform", `translate(${margin.left},${margin.top})`);

// --- Labels-as-markers ------------------------------------------------------
g.selectAll("text.point")
  .data(data)
  .join("text")
  .attr("class", "point")
  .attr("x", (d) => d.x)
  .attr("y", (d) => d.y)
  .attr("text-anchor", "middle")
  .attr("dominant-baseline", "central")
  .style("font-size", (d) => `${FONT_SIZE[d.prominence]}px`)
  .style("font-weight", (d) => (d.prominence === 3 ? 600 : 400))
  .style("opacity", (d) => OPACITY[d.prominence])
  .attr("fill", (d) => color(d.category))
  .text((d) => d.label);

// --- Legend (category color key, horizontally centered via getBBox) --------
const legend = svg.append("g").attr("class", "legend");
const items = legend.selectAll("g.item").data(CATEGORIES).join("g").attr("class", "item");

items.append("circle").attr("r", 7).attr("fill", (d) => color(d.name));
items
  .append("text")
  .attr("x", 16)
  .attr("y", 5)
  .style("font-size", "15px")
  .attr("fill", t.inkSoft)
  .text((d) => d.name);

const gaps = [];
items.each(function () {
  gaps.push(this.getBBox().width + 36);
});
const totalWidth = d3.sum(gaps) - 36;
let cursor = (width - totalWidth) / 2;
items.each(function (d, i) {
  d3.select(this).attr("transform", `translate(${cursor},78)`);
  cursor += gaps[i];
});

// --- Title ------------------------------------------------------------------
svg
  .append("text")
  .attr("x", width / 2)
  .attr("y", 44)
  .attr("text-anchor", "middle")
  .attr("fill", t.ink)
  .style("font-size", "22px")
  .style("font-weight", "600")
  .text("scatter-text · javascript · d3 · anyplot.ai");

// --- Minimal dimension labels (this is an embedding plot: axes are latent
// components, not measured units, so ticks would be misleading — just orient
// the viewer with the two axis names) ---------------------------------------
svg
  .append("text")
  .attr("x", margin.left + iw / 2)
  .attr("y", height - 14)
  .attr("text-anchor", "middle")
  .attr("fill", t.inkSoft)
  .style("font-size", "13px")
  .style("letter-spacing", "0.04em")
  .text("Component 1");

svg
  .append("text")
  .attr("transform", `translate(${16},${margin.top + ih / 2}) rotate(-90)`)
  .attr("text-anchor", "middle")
  .attr("fill", t.inkSoft)
  .style("font-size", "13px")
  .style("letter-spacing", "0.04em")
  .text("Component 2");
Runnable source as JSON, for any HTTP client: https://api.anyplot.ai/specs/scatter-text/d3/code. Any spec id and library id listed in llms-full.txt fit the same URL shape; every URL below is complete and callable.
{
  "spec_id": "scatter-text",
  "language": "javascript",
  "library": "d3",
  "page": "https://anyplot.ai/scatter-text/javascript/d3",
  "hub": "https://anyplot.ai/scatter-text",
  "code_json": "https://api.anyplot.ai/specs/scatter-text/d3/code",
  "spec_json": "https://api.anyplot.ai/specs/scatter-text",
  "render_light_png": "https://storage.googleapis.com/anyplot-images/plots/scatter-text/javascript/d3/plot-light.png",
  "render_dark_png": "https://storage.googleapis.com/anyplot-images/plots/scatter-text/javascript/d3/plot-dark.png",
  "interactive_light_html": "https://storage.googleapis.com/anyplot-images/plots/scatter-text/javascript/d3/plot-light.html",
  "interactive_dark_html": "https://storage.googleapis.com/anyplot-images/plots/scatter-text/javascript/d3/plot-dark.html",
  "quality_score": 92.0,
  "license": "MIT",
  "guide": "https://anyplot.ai/llms.txt"
}
Part of Scatter Plot with Text Labels Instead of Points on anyplot.ai.