The same plot in 14 other libraries — JavaScript: Chart.js, D3.js, Apache ECharts, Highcharts; Python: Altair, Bokeh, lets-plot, Matplotlib, Plotly, plotnine, Pygal, Seaborn; R: ggplot2; Julia: Makie.jl. Compare all 15 side by side: Scatter Plot with Text Labels Instead of Points in Python, R, Julia and JavaScript.
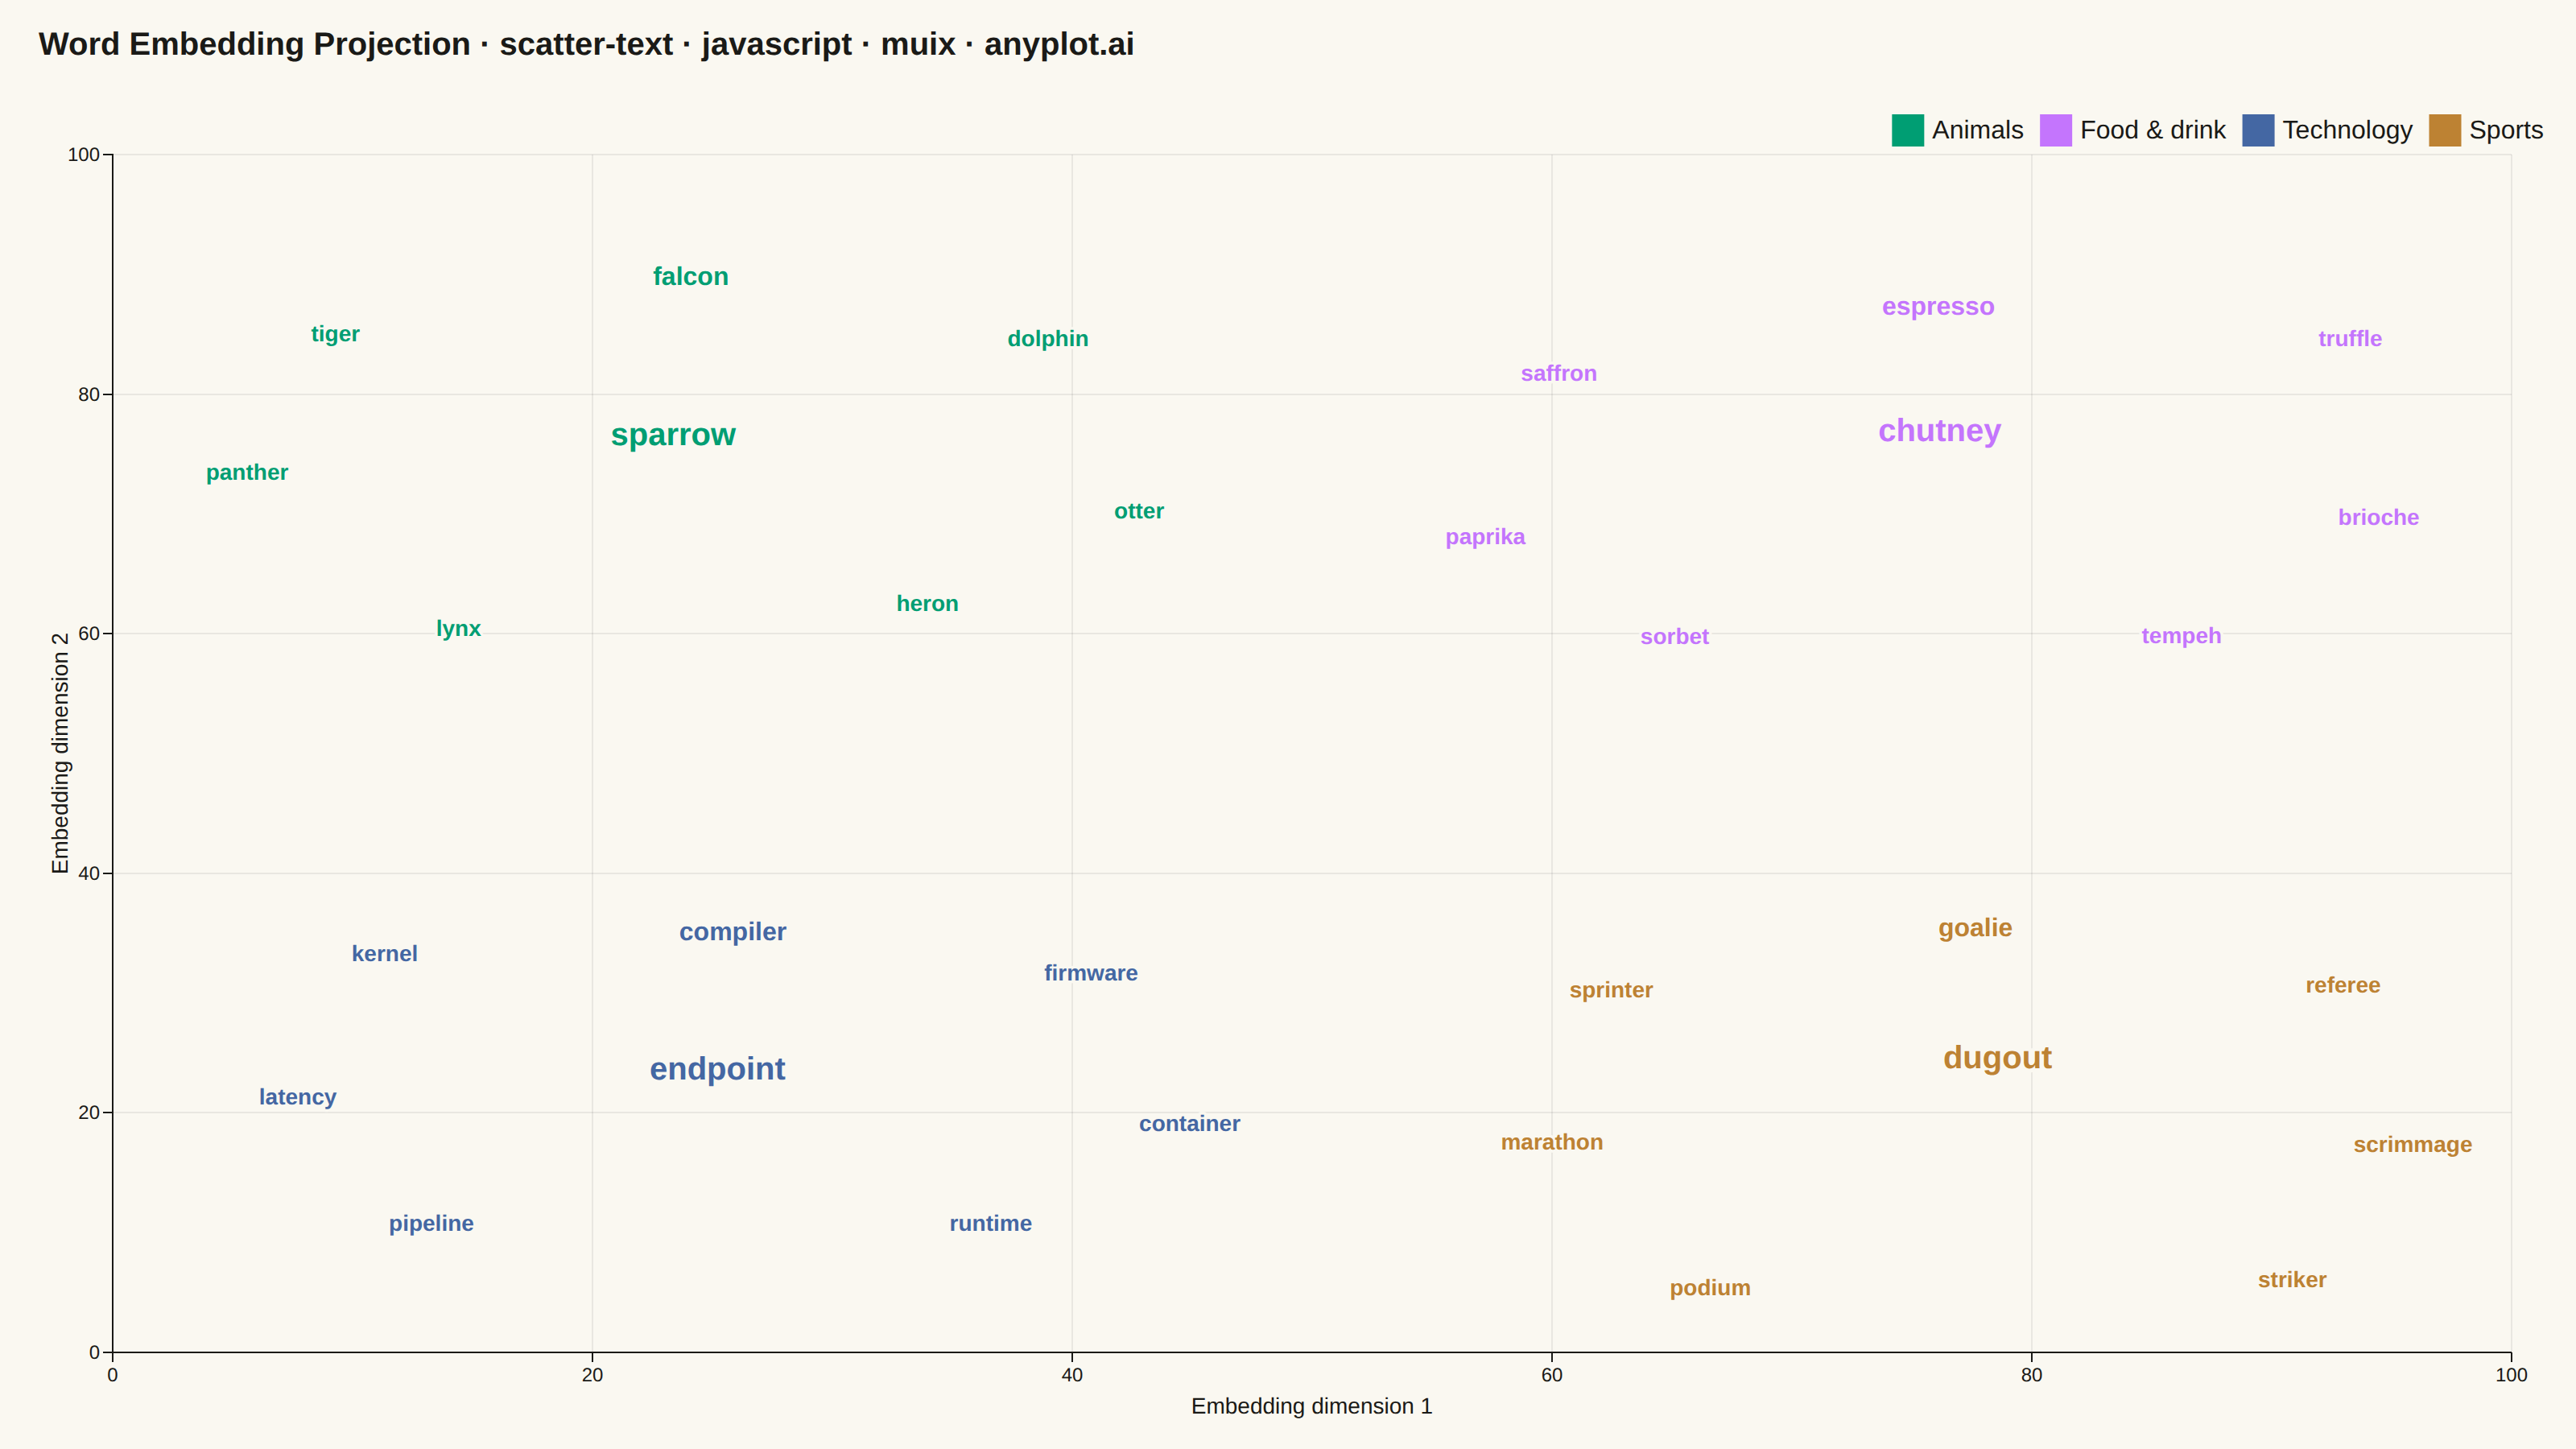
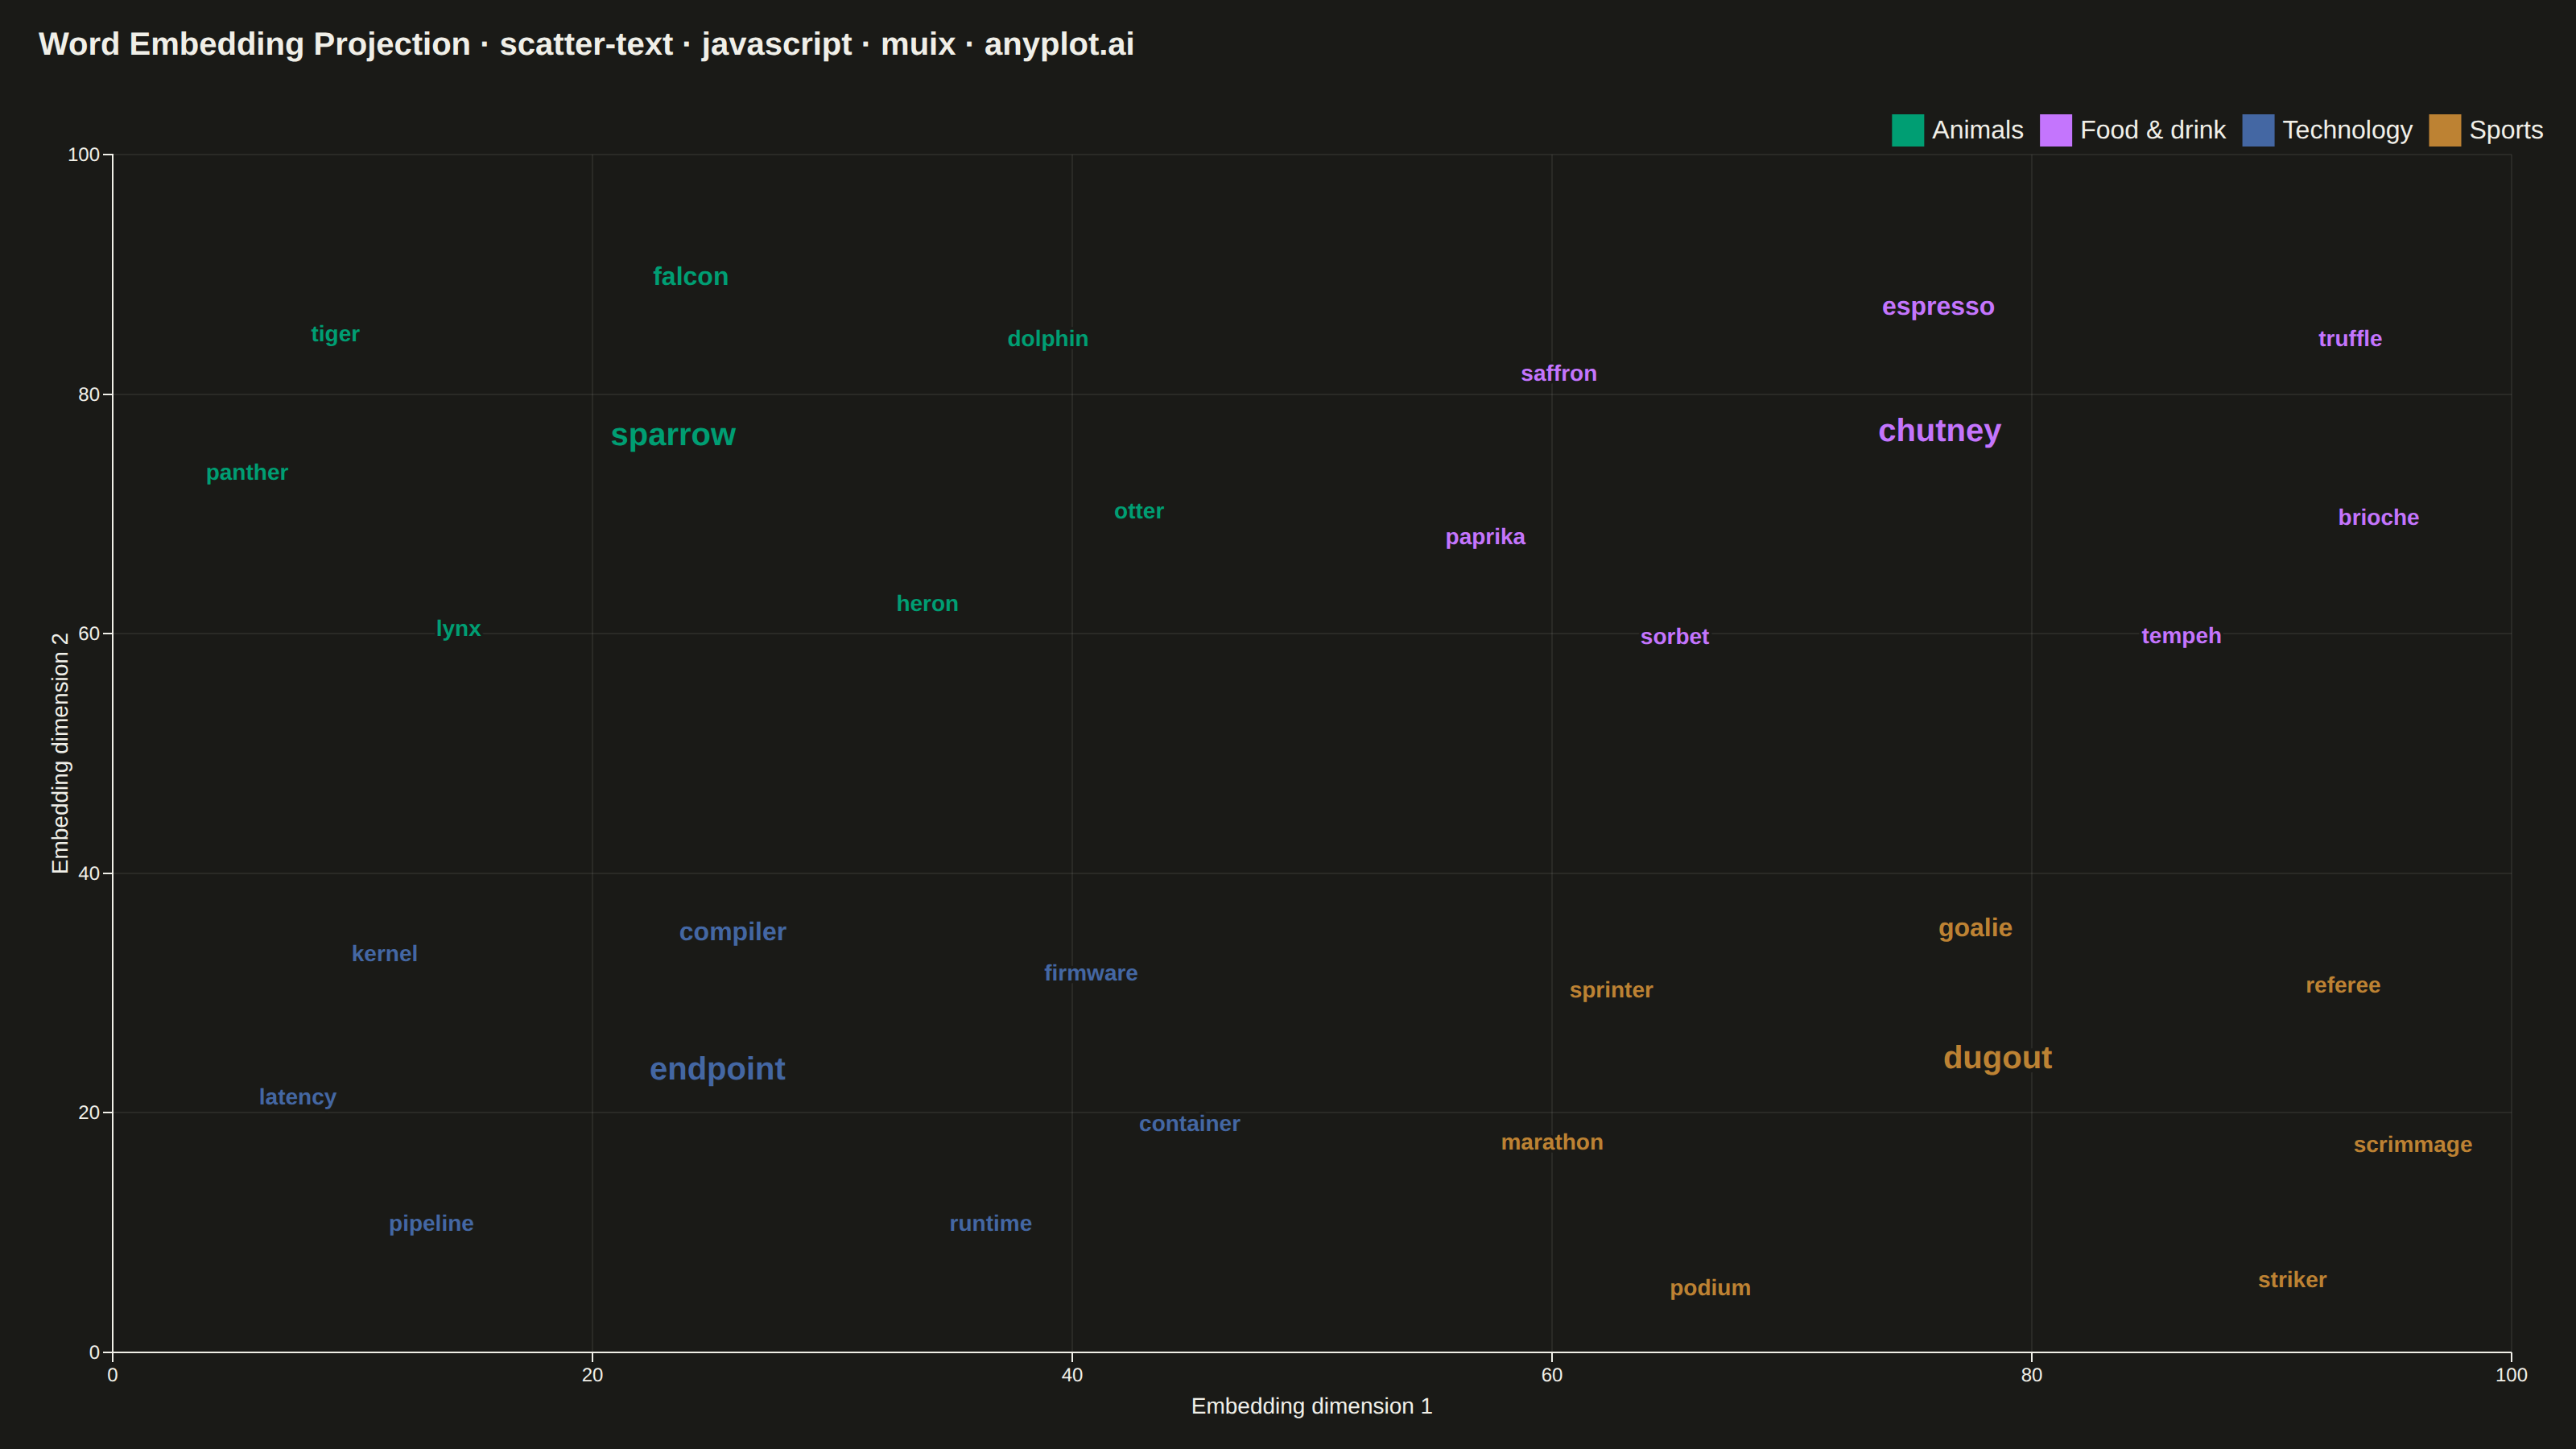
A scatter plot where data points are represented by text labels instead of markers. Each label is positioned at its corresponding coordinates, making the text itself the visual element. This visualization is particularly useful for displaying named entities in 2D space, such as word embeddings, dimensionality reduction outputs, or any scenario where identifying individual items by name is more important than seeing their relative density.
// anyplot.ai
// scatter-text: Scatter Plot with Text Labels Instead of Points
// Library: muix 7.29.1 | JavaScript 22.23.2
// Quality: 91/100 | Created: 2026-09-02
//# anyplot-orientation: landscape
// anyplot.ai
// scatter-text: Scatter Plot with Text Labels Instead of Points
// Library: MUI X Charts | React | Node 22
// License: @mui/x-charts — MIT (community). Pro/Premium are out of scope.
// Quality: pending | Created: 2026-09-02
import { ScatterChart } from "@mui/x-charts/ScatterChart";

const t = window.ANYPLOT_TOKENS;

// --- Data: word clusters positioned like a t-SNE / UMAP 2D projection ------
// Deterministic LCG so the "organic" jitter is reproducible across renders.
function makeLcg(seed) {
  let state = seed;
  return () => {
    state = (state * 1103515245 + 12345) % 2147483648;
    return state / 2147483648;
  };
}
const rng = makeLcg(20260902);

// Relative offsets for 8 points inside a cluster (staggered grid, no overlap).
const LAYOUT = [
  [-16, 9],
  [0, 13],
  [16, 9],
  [-19, -4],
  [0, 1],
  [19, -4],
  [-11, -15],
  [11, -15],
];
const MAX_RADIUS = Math.max(...LAYOUT.map(([dx, dy]) => Math.hypot(dx, dy)));

function makeCluster(id, label, color, center, words) {
  const data = words.map((word, i) => {
    const [dx, dy] = LAYOUT[i];
    const jitterX = (rng() - 0.5) * 4;
    const jitterY = (rng() - 0.5) * 4;
    // Words nearer the cluster centroid render larger — a proximity-to-size
    // encoding that reads as "how representative of the cluster" and gives
    // each group a visual anchor instead of eight equal-weight labels.
    const centrality = 1 - Math.hypot(dx, dy) / MAX_RADIUS;
    return {
      id: `${id}-${word}`,
      x: center[0] + dx + jitterX,
      y: center[1] + dy + jitterY,
      label: word,
      fontSize: Math.round(14 + 6 * centrality),
    };
  });
  return { id, label, color, data };
}

const CLUSTERS = [
  makeCluster("animals", "Animals", t.palette[0], [24, 76], [
    "tiger",
    "falcon",
    "dolphin",
    "panther",
    "sparrow",
    "otter",
    "lynx",
    "heron",
  ]),
  makeCluster("food", "Food & drink", t.palette[1], [76, 74], [
    "saffron",
    "espresso",
    "truffle",
    "paprika",
    "chutney",
    "brioche",
    "sorbet",
    "tempeh",
  ]),
  makeCluster("tech", "Technology", t.palette[2], [26, 24], [
    "kernel",
    "compiler",
    "firmware",
    "latency",
    "endpoint",
    "container",
    "pipeline",
    "runtime",
  ]),
  makeCluster("sports", "Sports", t.palette[3], [78, 22], [
    "sprinter",
    "goalie",
    "referee",
    "marathon",
    "dugout",
    "scrimmage",
    "podium",
    "striker",
  ]),
];

// Title fontsize scales linearly off the 67-char mandated-title baseline.
const TITLE = "Word Embedding Projection · scatter-text · javascript · muix · anyplot.ai";
const TITLE_FONT_SIZE = Math.round(22 * Math.min(1, 67 / TITLE.length));

// --- Custom scatter renderer: text labels instead of point markers ---------
function TextScatter(props) {
  const { series, xScale, yScale, color } = props;
  const points = series.data ?? [];
  return (
    <g>
      {points.map((point) => (
        <text
          key={point.id}
          x={xScale(point.x)}
          y={yScale(point.y)}
          fill={color}
          fontSize={point.fontSize}
          fontWeight={600}
          textAnchor="middle"
          dominantBaseline="central"
          paintOrder="stroke"
          stroke={t.pageBg}
          strokeWidth={point.fontSize / 4}
          strokeLinejoin="round"
        >
          {point.label}
        </text>
      ))}
    </g>
  );
}

// --- Chart (default-exported component — the harness mounts it) -------------
export default function Chart() {
  const { width, height } = window.ANYPLOT_SIZE;
  const titleHeight = 56;

  return (
    <div style={{ width, height, display: "flex", flexDirection: "column" }}>
      <div
        style={{
          height: titleHeight,
          display: "flex",
          alignItems: "center",
          paddingLeft: 24,
          fontSize: TITLE_FONT_SIZE,
          fontWeight: 600,
          color: t.ink,
        }}
      >
        {TITLE}
      </div>
      <ScatterChart
        width={width}
        height={height - titleHeight}
        series={CLUSTERS}
        skipAnimation
        grid={{ vertical: true, horizontal: true }}
        xAxis={[{ min: 0, max: 100, label: "Embedding dimension 1", tickNumber: 6 }]}
        yAxis={[{ min: 0, max: 100, label: "Embedding dimension 2", tickNumber: 6 }]}
        slots={{ scatter: TextScatter }}
        slotProps={{
          legend: { position: { vertical: "top", horizontal: "right" }, direction: "row" },
        }}
        margin={{ top: 40, right: 40, bottom: 60, left: 70 }}
        sx={{
          // Drop the stock axis frame/ticks for a borderless, custom look —
          // the gridlines alone are enough reference structure.
          "& .MuiChartsAxis-line": { stroke: "none" },
          "& .MuiChartsAxis-tick": { stroke: "none" },
          "& .MuiChartsGrid-line": { strokeOpacity: 0.5 },
        }}
      />
    </div>
  );
}
Runnable source as JSON, for any HTTP client: https://api.anyplot.ai/specs/scatter-text/muix/code. Any spec id and library id listed in llms-full.txt fit the same URL shape; every URL below is complete and callable.
{
  "spec_id": "scatter-text",
  "language": "javascript",
  "library": "muix",
  "page": "https://anyplot.ai/scatter-text/javascript/muix",
  "hub": "https://anyplot.ai/scatter-text",
  "code_json": "https://api.anyplot.ai/specs/scatter-text/muix/code",
  "spec_json": "https://api.anyplot.ai/specs/scatter-text",
  "render_light_png": "https://storage.googleapis.com/anyplot-images/plots/scatter-text/javascript/muix/plot-light.png",
  "render_dark_png": "https://storage.googleapis.com/anyplot-images/plots/scatter-text/javascript/muix/plot-dark.png",
  "interactive_light_html": "https://storage.googleapis.com/anyplot-images/plots/scatter-text/javascript/muix/plot-light.html",
  "interactive_dark_html": "https://storage.googleapis.com/anyplot-images/plots/scatter-text/javascript/muix/plot-dark.html",
  "quality_score": 91.0,
  "license": "MIT",
  "guide": "https://anyplot.ai/llms.txt"
}
Part of Scatter Plot with Text Labels Instead of Points on anyplot.ai.