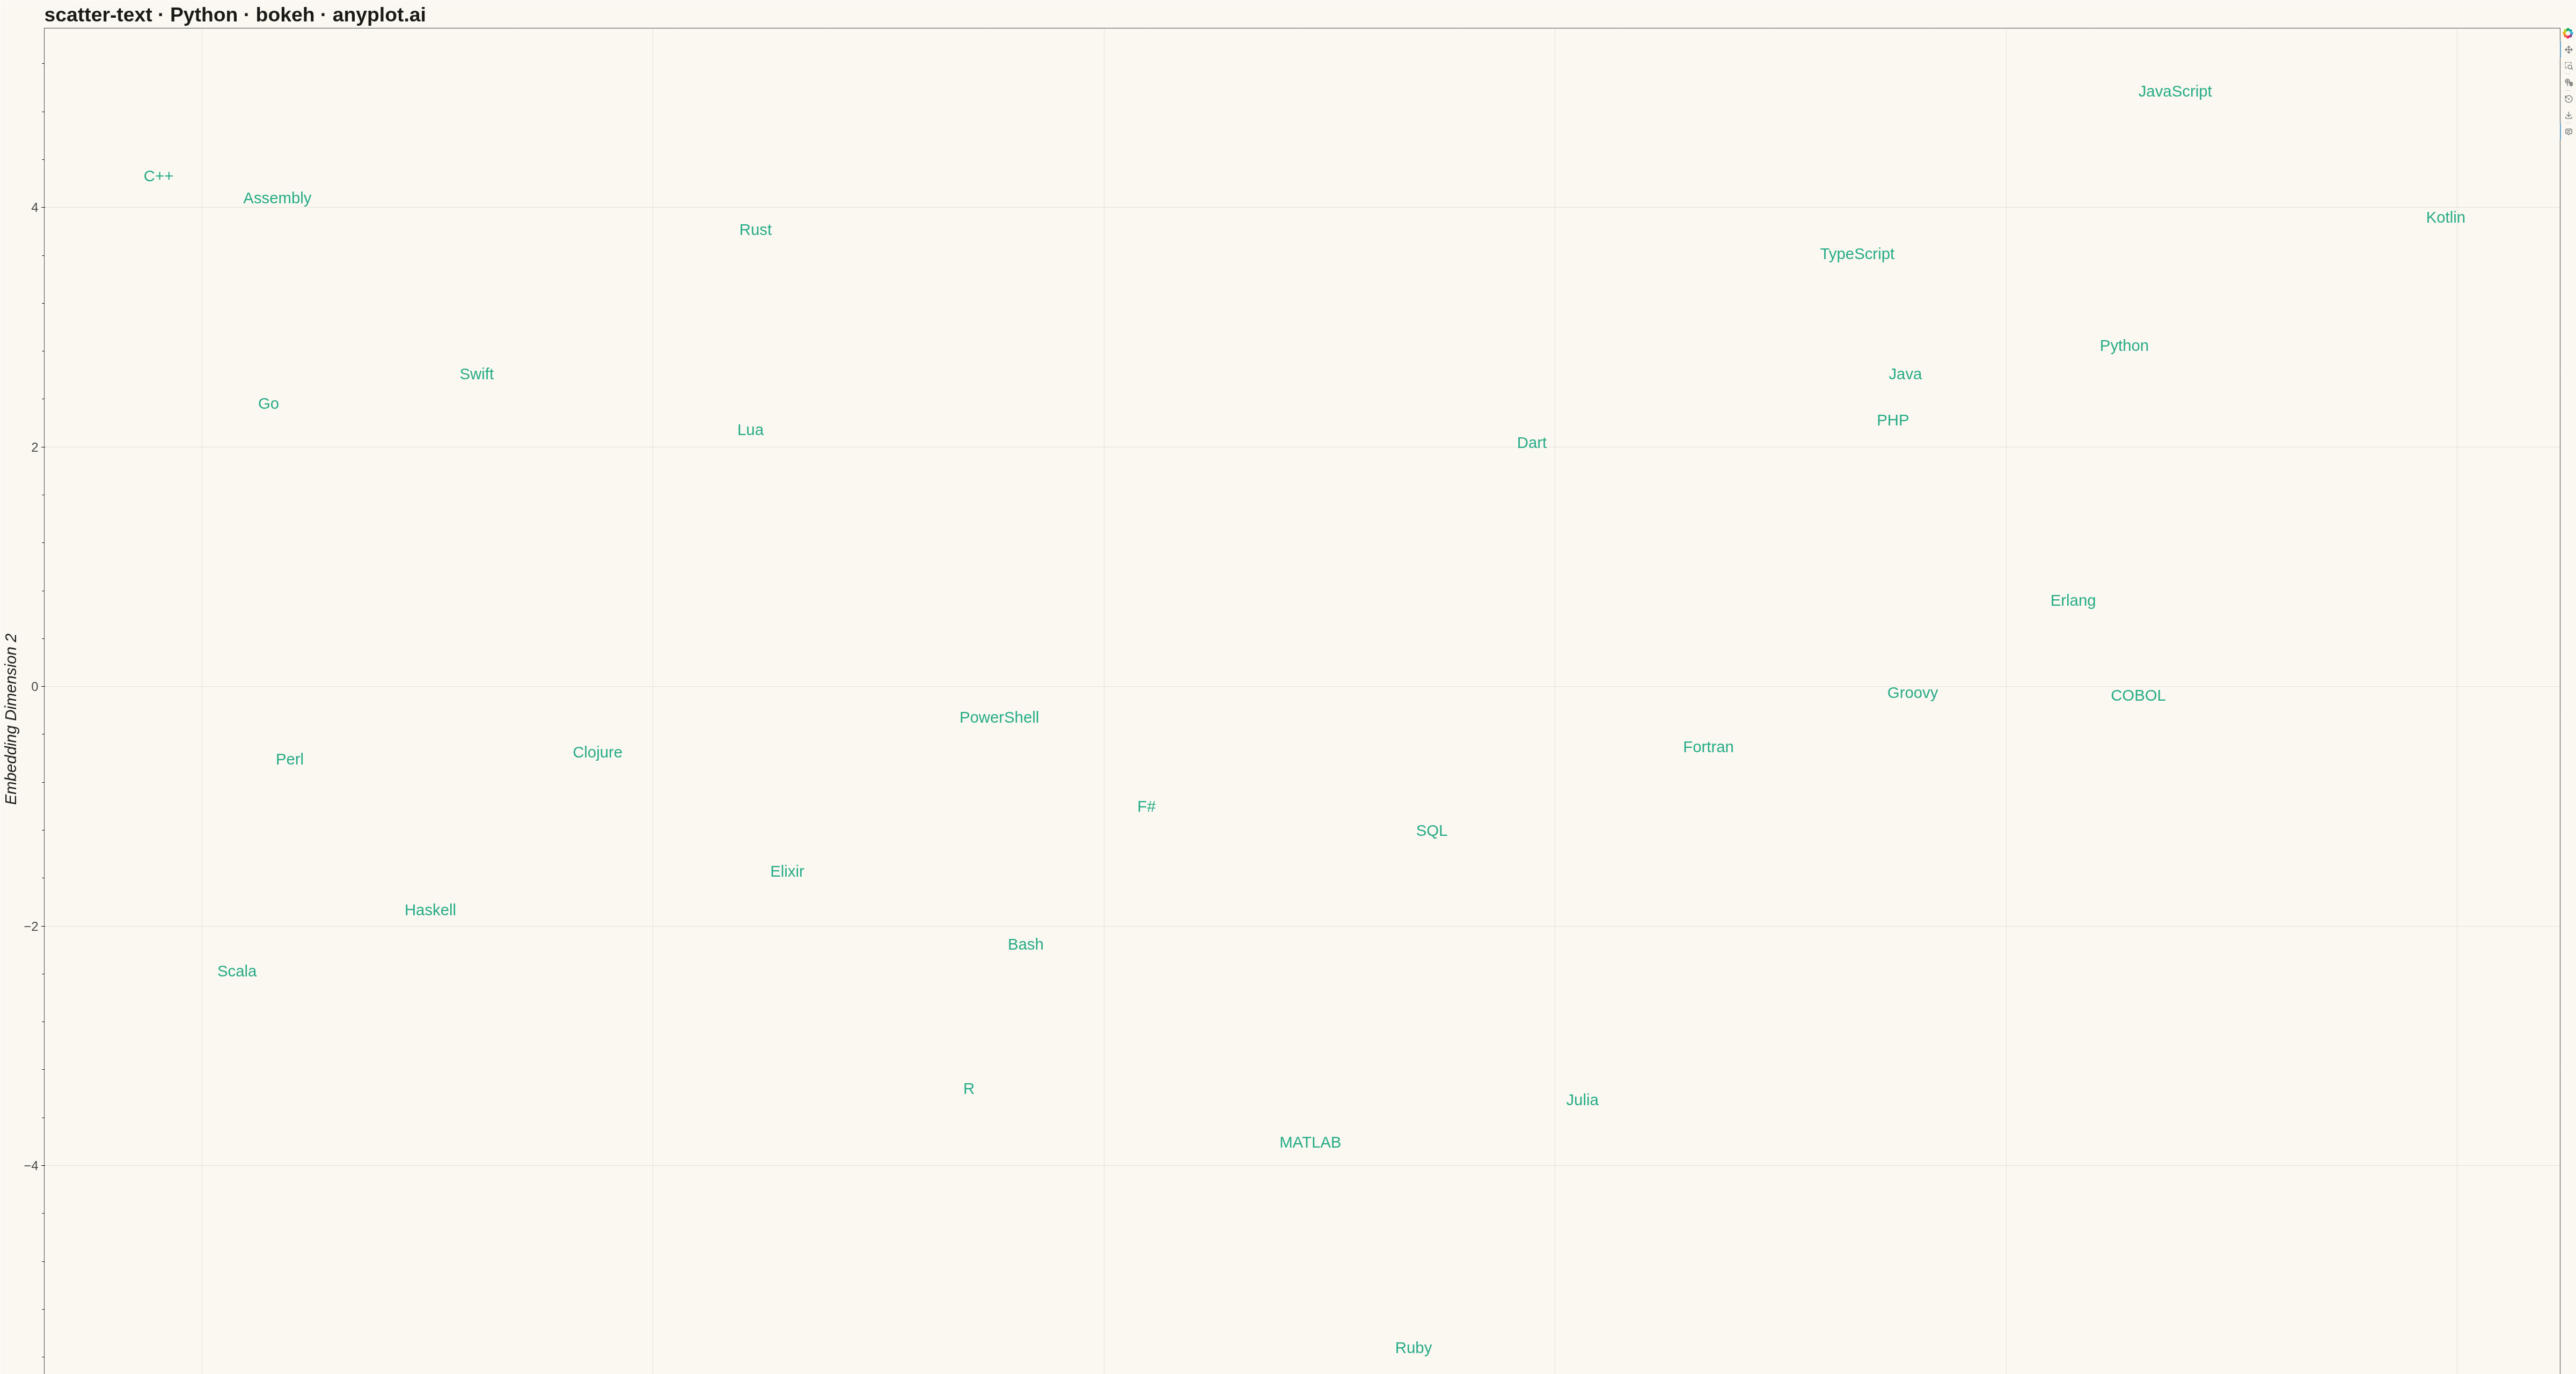
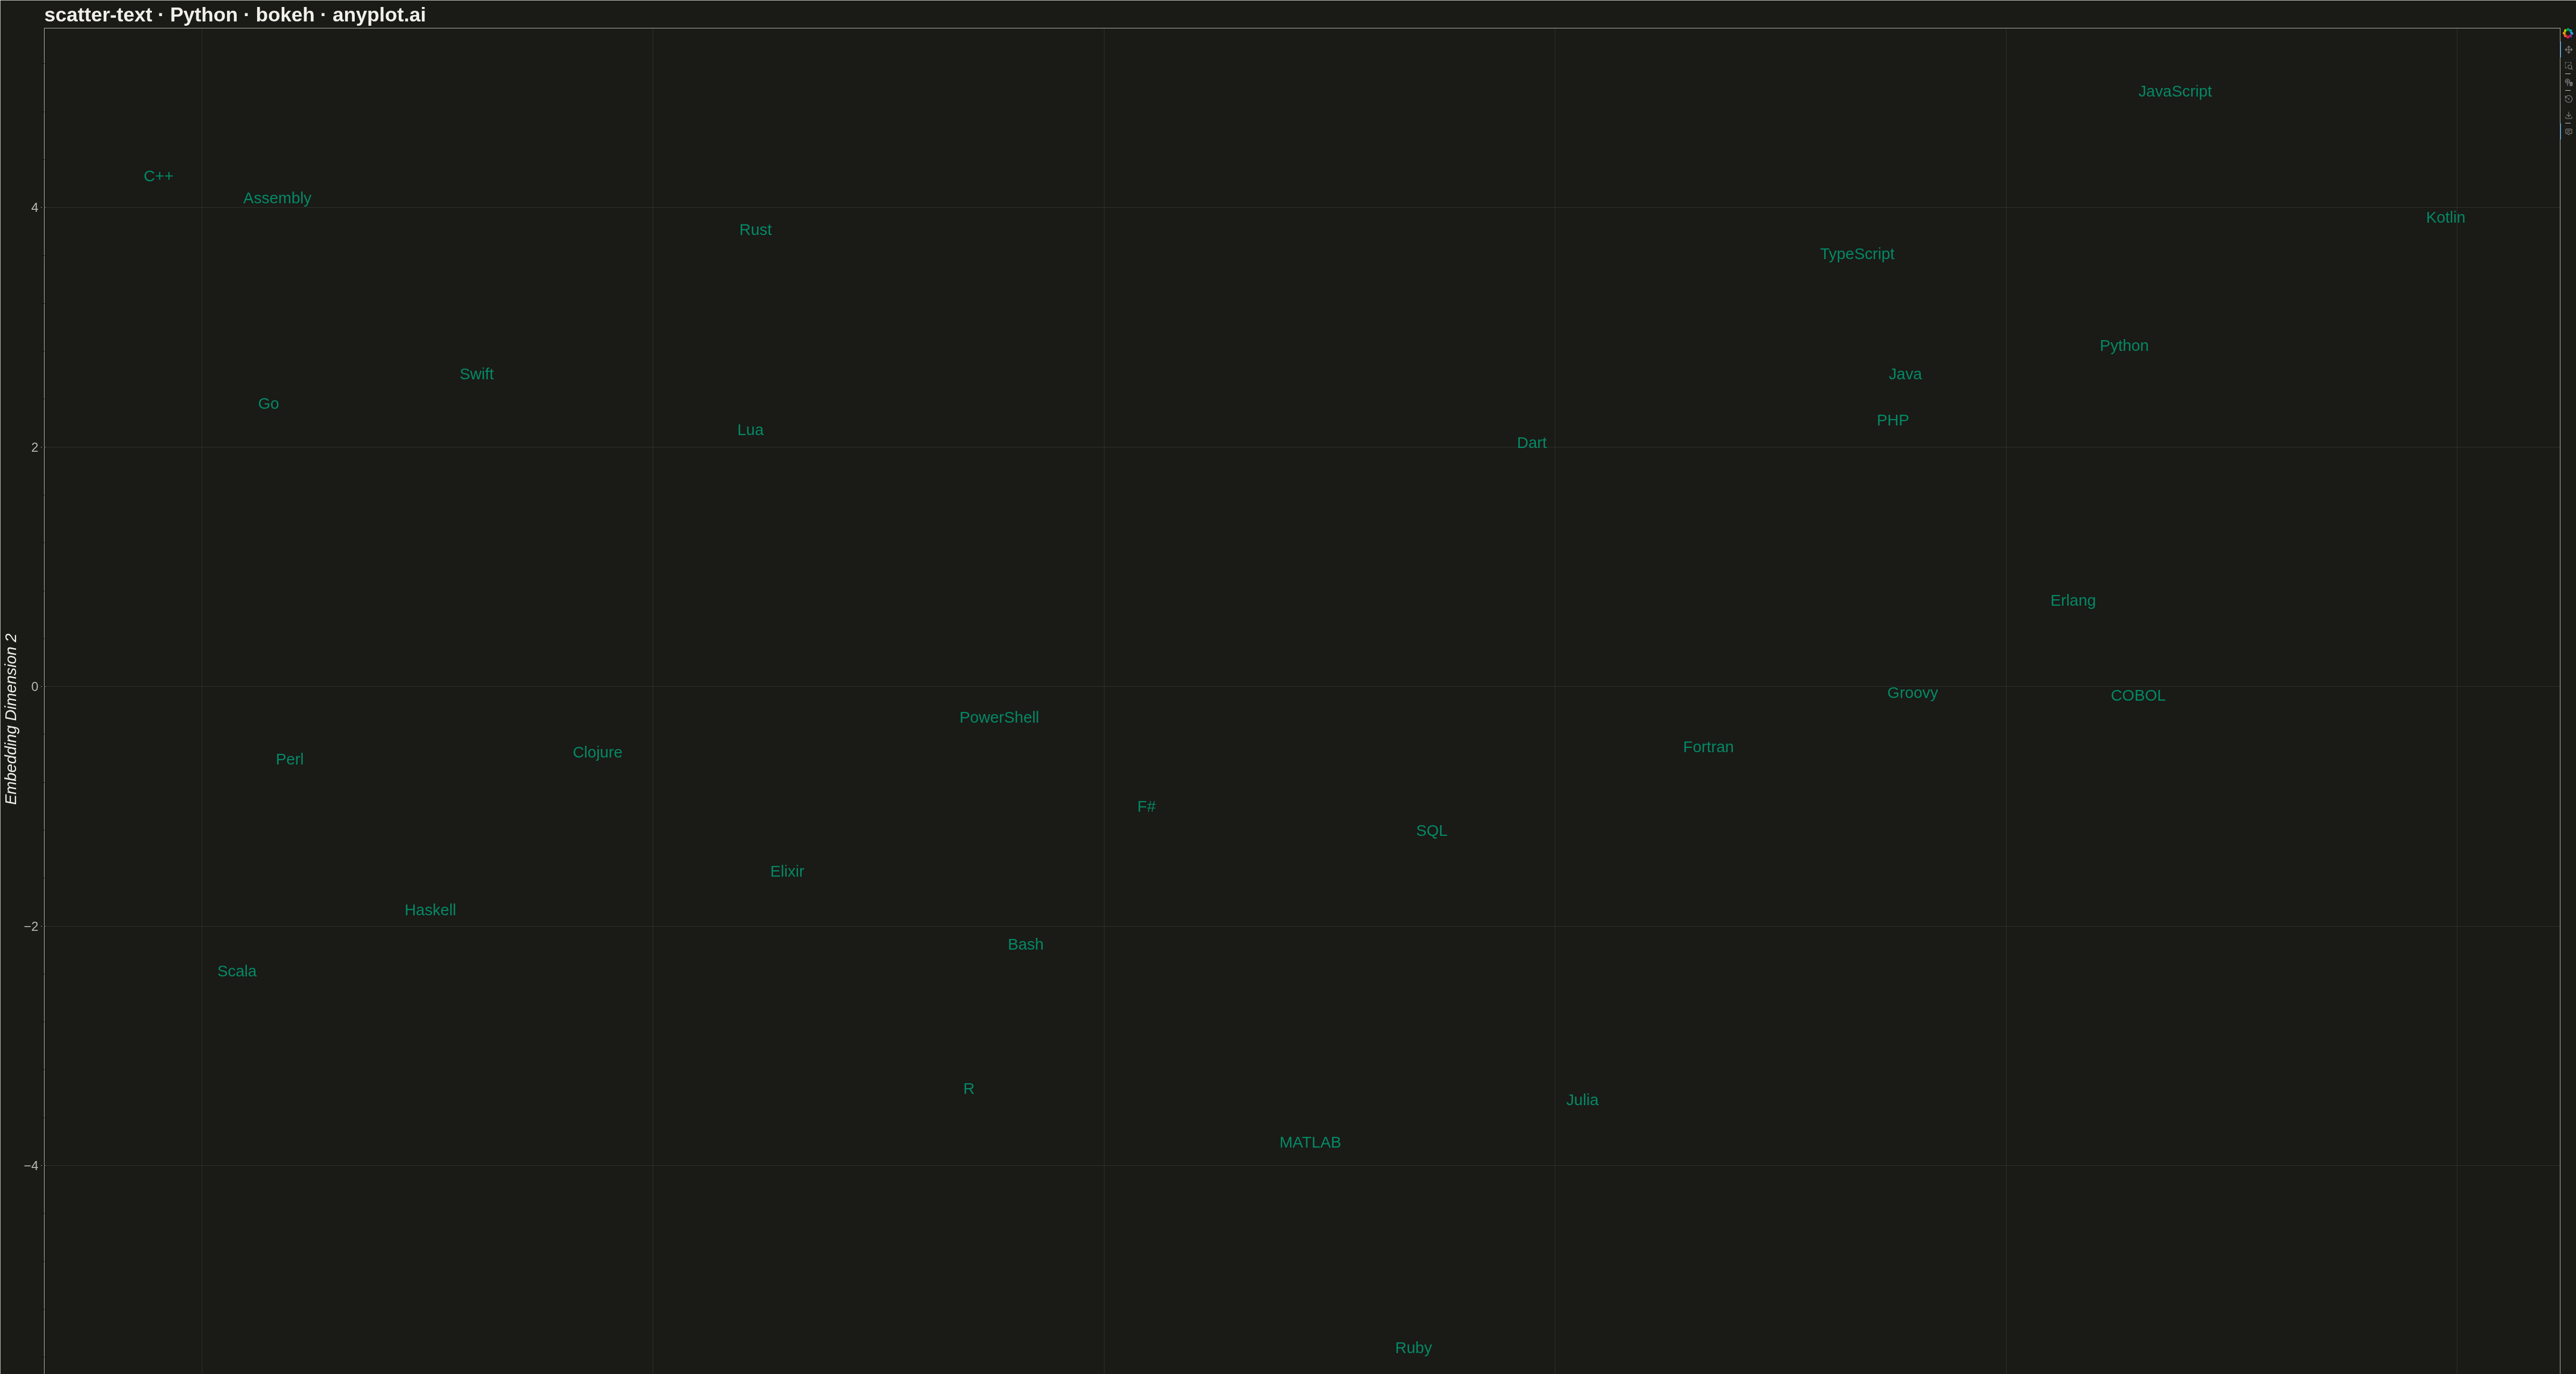
A scatter plot where data points are represented by text labels instead of markers. Each label is positioned at its corresponding coordinates, making the text itself the visual element. This visualization is particularly useful for displaying named entities in 2D space, such as word embeddings, dimensionality reduction outputs, or any scenario where identifying individual items by name is more important than seeing their relative density.
""" anyplot.ai
scatter-text: Scatter Plot with Text Labels Instead of Points
Library: bokeh 3.9.0 | Python 3.13.13
Quality: 92/100 | Updated: 2026-05-17
"""

import os
import time
from pathlib import Path

import numpy as np
from bokeh.io import output_file, save
from bokeh.models import ColumnDataSource, HoverTool, LabelSet
from bokeh.plotting import figure
from selenium import webdriver
from selenium.webdriver.chrome.options import Options


# Theme tokens
THEME = os.getenv("ANYPLOT_THEME", "light")
PAGE_BG = "#FAF8F1" if THEME == "light" else "#1A1A17"
INK = "#1A1A17" if THEME == "light" else "#F0EFE8"
INK_SOFT = "#4A4A44" if THEME == "light" else "#B8B7B0"
BRAND = "#009E73"  # Okabe-Ito position 1

# Data: Simulated word embeddings for programming languages
np.random.seed(42)

labels = [
    "Python",
    "JavaScript",
    "Java",
    "C++",
    "Ruby",
    "Go",
    "Rust",
    "Swift",
    "Kotlin",
    "TypeScript",
    "PHP",
    "Scala",
    "R",
    "Julia",
    "Perl",
    "Lua",
    "Haskell",
    "Clojure",
    "Erlang",
    "Elixir",
    "Dart",
    "MATLAB",
    "Fortran",
    "COBOL",
    "Assembly",
    "SQL",
    "Bash",
    "PowerShell",
    "Groovy",
    "F#",
]

n = len(labels)
x = np.zeros(n)
y = np.zeros(n)

# Modern general-purpose languages
modern = [0, 1, 2, 8, 9, 10, 18, 20]
for i in modern:
    x[i] = np.random.normal(4, 1.2)
    y[i] = np.random.normal(3, 1.2)

# Systems languages
systems = [3, 5, 6, 7, 24]
for i in systems:
    x[i] = np.random.normal(-3, 1.0)
    y[i] = np.random.normal(4, 1.0)

# Functional languages with improved spacing
functional = [11, 16, 17, 19, 29]
for i, idx in enumerate(functional):
    x[idx] = np.random.normal(-3.5 + i * 0.8, 0.5)
    y[idx] = np.random.normal(-2.5 + i * 0.5, 0.5)

# Data science / Scientific
scientific = [4, 12, 13, 21]
for i in scientific:
    x[i] = np.random.normal(1, 1.2)
    y[i] = np.random.normal(-3.5, 1.0)

# Scripting languages
scripting = [14, 15, 26, 27]
for i in scripting:
    x[i] = np.random.normal(-1, 1.5)
    y[i] = np.random.normal(0.5, 1.5)

# Legacy languages with adjusted positions to reduce COBOL/Erlang overlap
legacy = [22, 23, 25, 28]
legacy_x_offsets = [0, 0.8, -0.8, 0.4]  # Space COBOL away from Erlang
for idx, x_off in zip(legacy, legacy_x_offsets, strict=True):
    x[idx] = np.random.normal(3 + x_off, 0.8)
    y[idx] = np.random.normal(-1, 0.8)

# Add jitter with reduced magnitude for COBOL/Erlang pair
jitter_x = np.random.normal(0, 0.15, n)
jitter_y = np.random.normal(0, 0.15, n)
# Reduce jitter for COBOL (index 23) and Erlang (index 18)
jitter_x[[18, 23]] *= 0.5
jitter_y[[18, 23]] *= 0.5
x += jitter_x
y += jitter_y

# Create data source
source = ColumnDataSource(data={"x": x, "y": y, "labels": labels})

# Create figure
p = figure(
    width=4800,
    height=2700,
    title="scatter-text · Python · bokeh · anyplot.ai",
    x_axis_label="Embedding Dimension 1",
    y_axis_label="Embedding Dimension 2",
    tools="pan,wheel_zoom,box_zoom,reset,save",
)

# Style the figure
p.background_fill_color = PAGE_BG
p.border_fill_color = PAGE_BG
p.outline_line_color = INK_SOFT

p.title.text_font_size = "28pt"
p.title.text_color = INK

p.xaxis.axis_label_text_font_size = "22pt"
p.yaxis.axis_label_text_font_size = "22pt"
p.xaxis.axis_label_text_color = INK
p.yaxis.axis_label_text_color = INK

p.xaxis.major_label_text_font_size = "18pt"
p.yaxis.major_label_text_font_size = "18pt"
p.xaxis.major_label_text_color = INK_SOFT
p.yaxis.major_label_text_color = INK_SOFT

p.xaxis.axis_line_color = INK_SOFT
p.yaxis.axis_line_color = INK_SOFT
p.xaxis.major_tick_line_color = INK_SOFT
p.yaxis.major_tick_line_color = INK_SOFT

# Grid styling
p.xgrid.grid_line_color = INK
p.ygrid.grid_line_color = INK
p.xgrid.grid_line_alpha = 0.10
p.ygrid.grid_line_alpha = 0.10

# Define group membership for visual hierarchy
groups = {
    "modern": [0, 1, 2, 8, 9, 10, 18, 20],
    "systems": [3, 5, 6, 7, 24],
    "functional": [11, 16, 17, 19, 29],
    "scientific": [4, 12, 13, 21],
    "scripting": [14, 15, 26, 27],
    "legacy": [22, 23, 25, 28],
}

# Create per-group styling with visual hierarchy: modern prominent, others subtle
group_alpha = {
    "modern": 0.95,  # Primary group
    "systems": 0.80,  # Subtle
    "functional": 0.75,  # Subtle
    "scientific": 0.85,  # Moderate
    "scripting": 0.78,  # Subtle
    "legacy": 0.73,  # Subtle
}

group_size = {
    "modern": "23pt",  # Slightly larger
    "systems": "21pt",  # Slightly smaller
    "functional": "20pt",
    "scientific": "22pt",
    "scripting": "20pt",
    "legacy": "20pt",
}

# Assign group info to data for styling
group_membership = [""] * n
for group_name, indices in groups.items():
    for idx in indices:
        group_membership[idx] = group_name

source.data["group"] = group_membership

# Add invisible scatter points for HoverTool
hover = HoverTool(tooltips=[("Language", "@labels"), ("Group", "@group")])
p.add_tools(hover)
p.scatter("x", "y", source=source, size=1, alpha=0)

# Add text labels with per-group visual hierarchy
for group_name, indices in groups.items():
    group_data = ColumnDataSource(
        data={"x": [x[i] for i in indices], "y": [y[i] for i in indices], "labels": [labels[i] for i in indices]}
    )
    text_labels = LabelSet(
        x="x",
        y="y",
        text="labels",
        source=group_data,
        text_font_size=group_size[group_name],
        text_color=BRAND,
        text_alpha=group_alpha[group_name],
        text_align="center",
        text_baseline="middle",
    )
    p.add_layout(text_labels)

# Save HTML
output_file(f"plot-{THEME}.html")
save(p)

# Screenshot with headless Chrome using Selenium
W, H = 4800, 2700
opts = Options()
for arg in (
    "--headless=new",
    "--no-sandbox",
    "--disable-dev-shm-usage",
    "--disable-gpu",
    f"--window-size={W},{H}",
    "--hide-scrollbars",
):
    opts.add_argument(arg)
driver = webdriver.Chrome(options=opts)
driver.set_window_size(W, H)
driver.get(f"file://{Path(f'plot-{THEME}.html').resolve()}")
time.sleep(3)
driver.save_screenshot(f"plot-{THEME}.png")
driver.quit()
Runnable source as JSON, for any HTTP client: https://api.anyplot.ai/specs/scatter-text/bokeh/code. Any spec id and library id listed in llms-full.txt fit the same URL shape; every URL below is complete and callable.
{
  "spec_id": "scatter-text",
  "language": "python",
  "library": "bokeh",
  "page": "https://anyplot.ai/scatter-text/python/bokeh",
  "hub": "https://anyplot.ai/scatter-text",
  "code_json": "https://api.anyplot.ai/specs/scatter-text/bokeh/code",
  "spec_json": "https://api.anyplot.ai/specs/scatter-text",
  "render_light_png": "https://storage.googleapis.com/anyplot-images/plots/scatter-text/python/bokeh/plot-light.png",
  "render_dark_png": "https://storage.googleapis.com/anyplot-images/plots/scatter-text/python/bokeh/plot-dark.png",
  "interactive_light_html": "https://storage.googleapis.com/anyplot-images/plots/scatter-text/python/bokeh/plot-light.html",
  "interactive_dark_html": "https://storage.googleapis.com/anyplot-images/plots/scatter-text/python/bokeh/plot-dark.html",
  "quality_score": 92.0,
  "license": "MIT",
  "guide": "https://anyplot.ai/llms.txt"
}
Part of Scatter Plot with Text Labels Instead of Points on anyplot.ai.