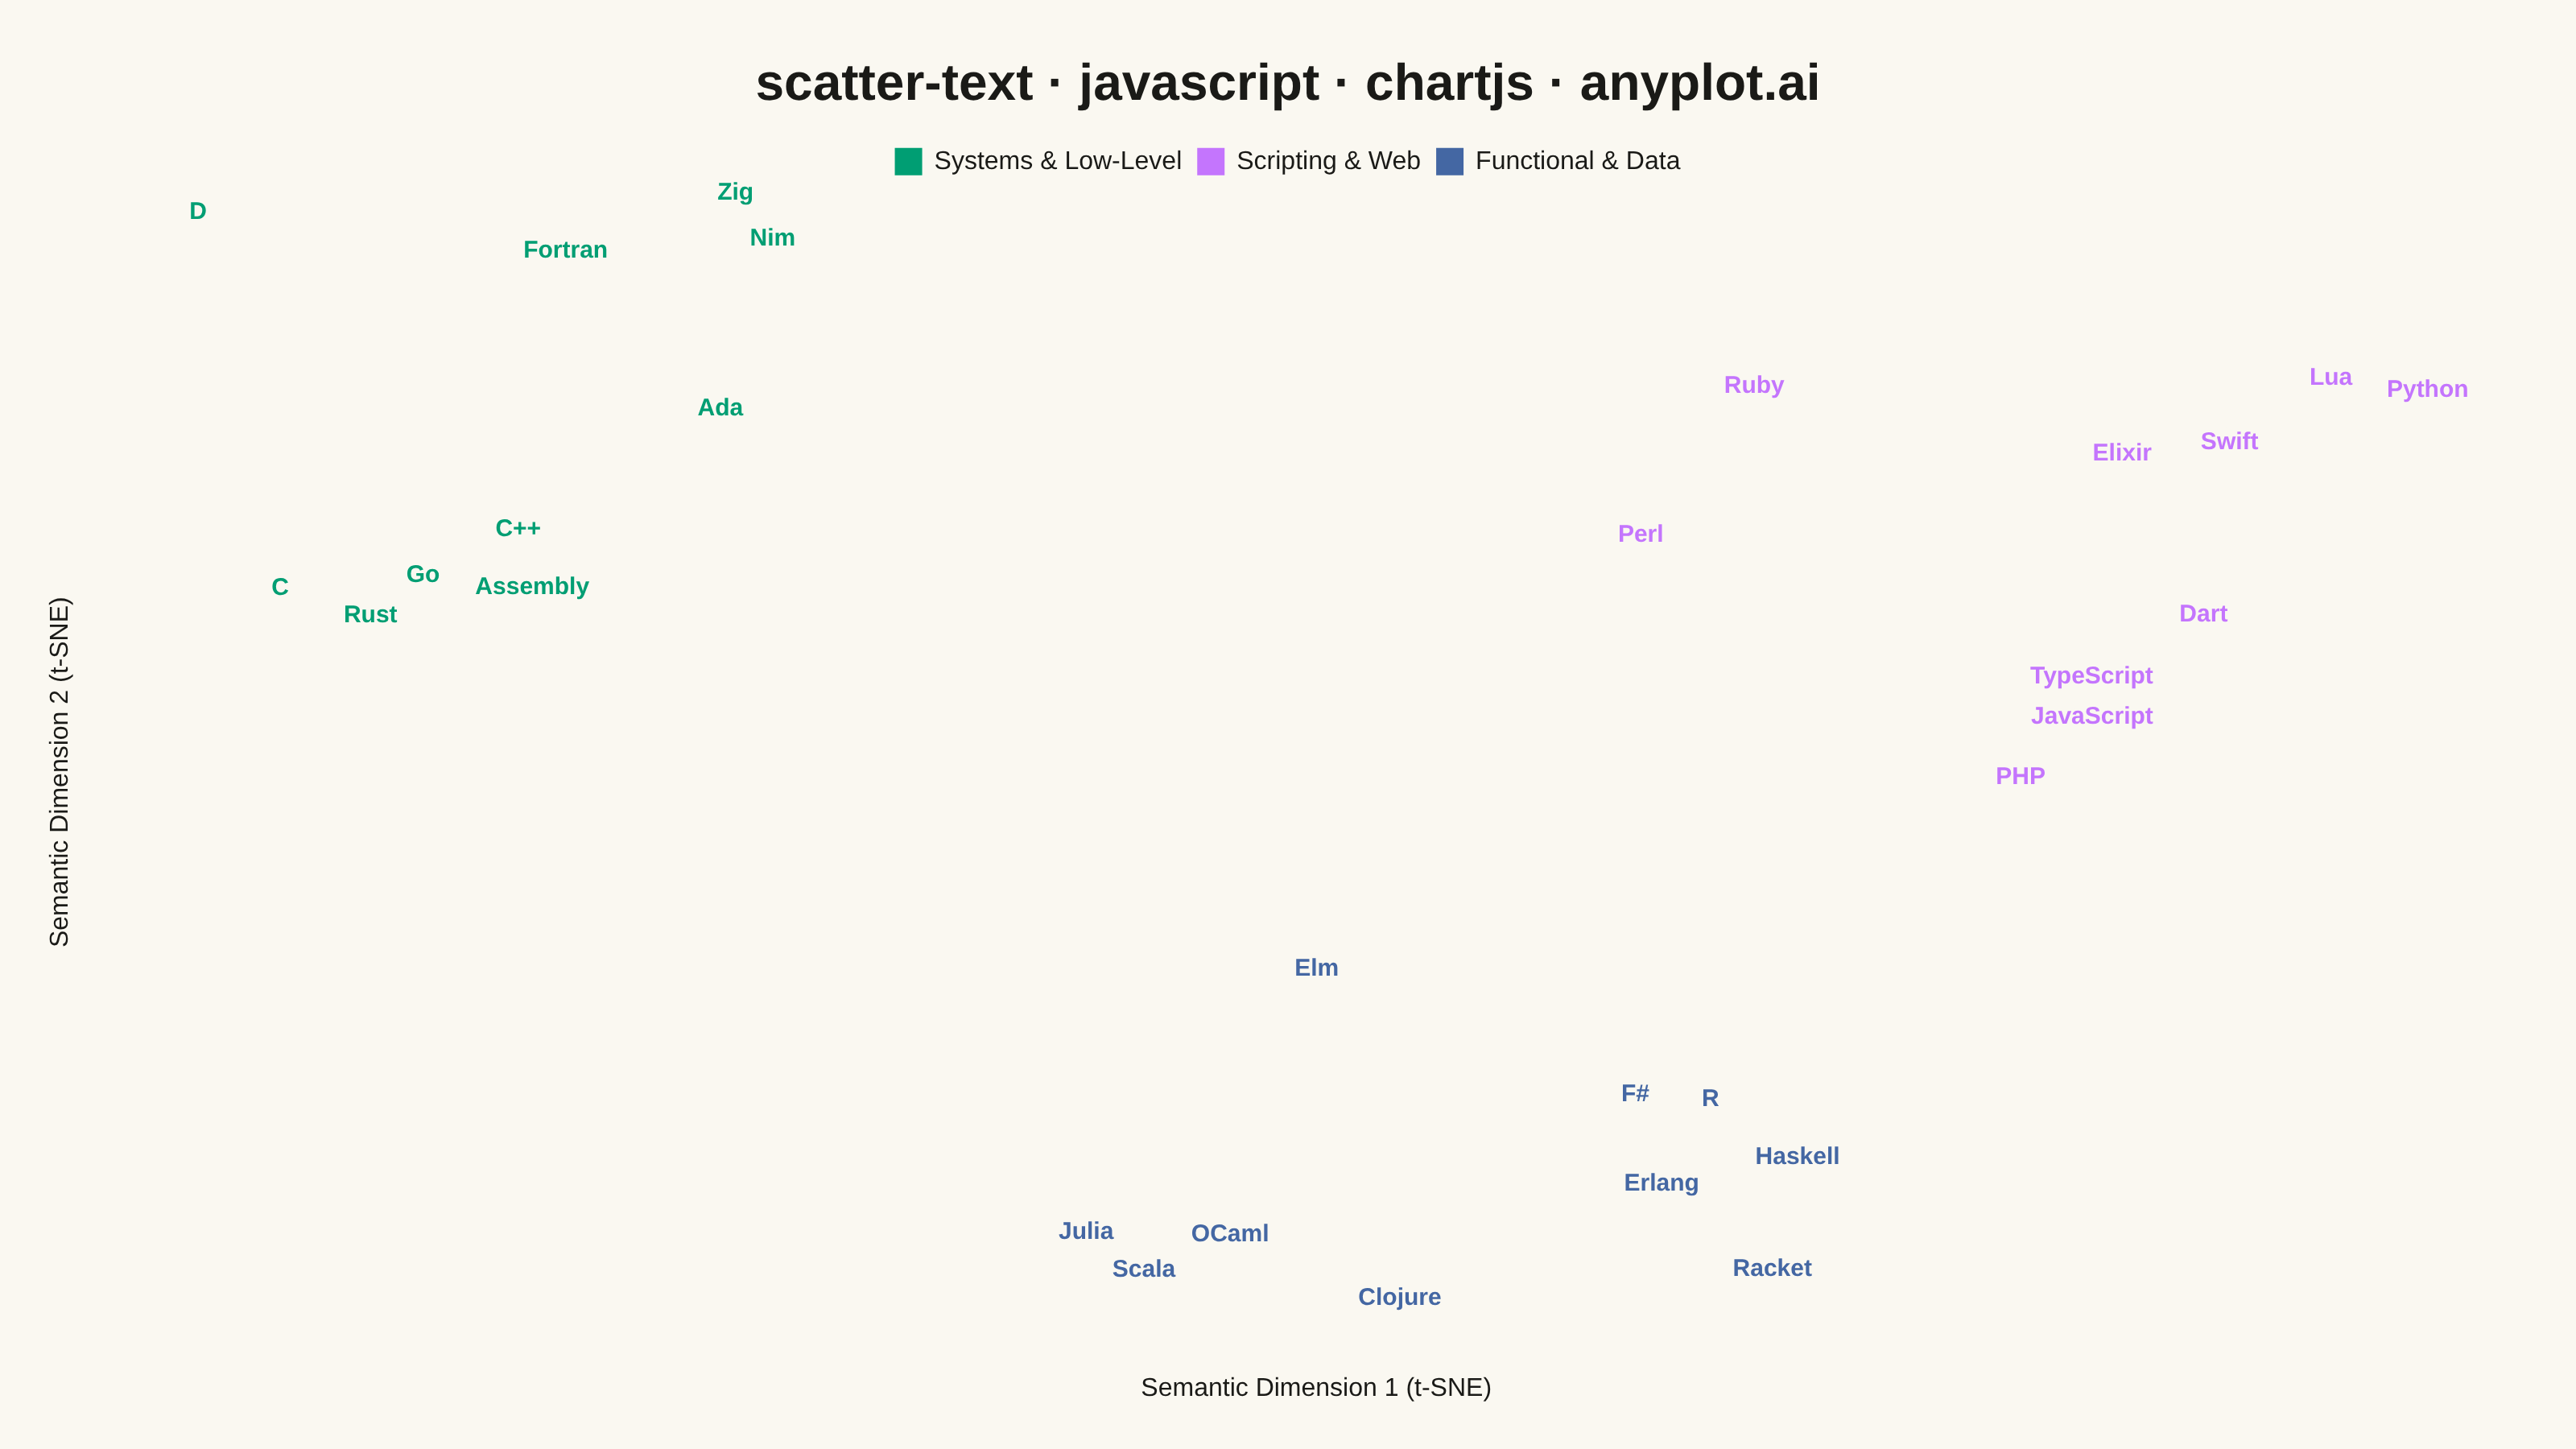
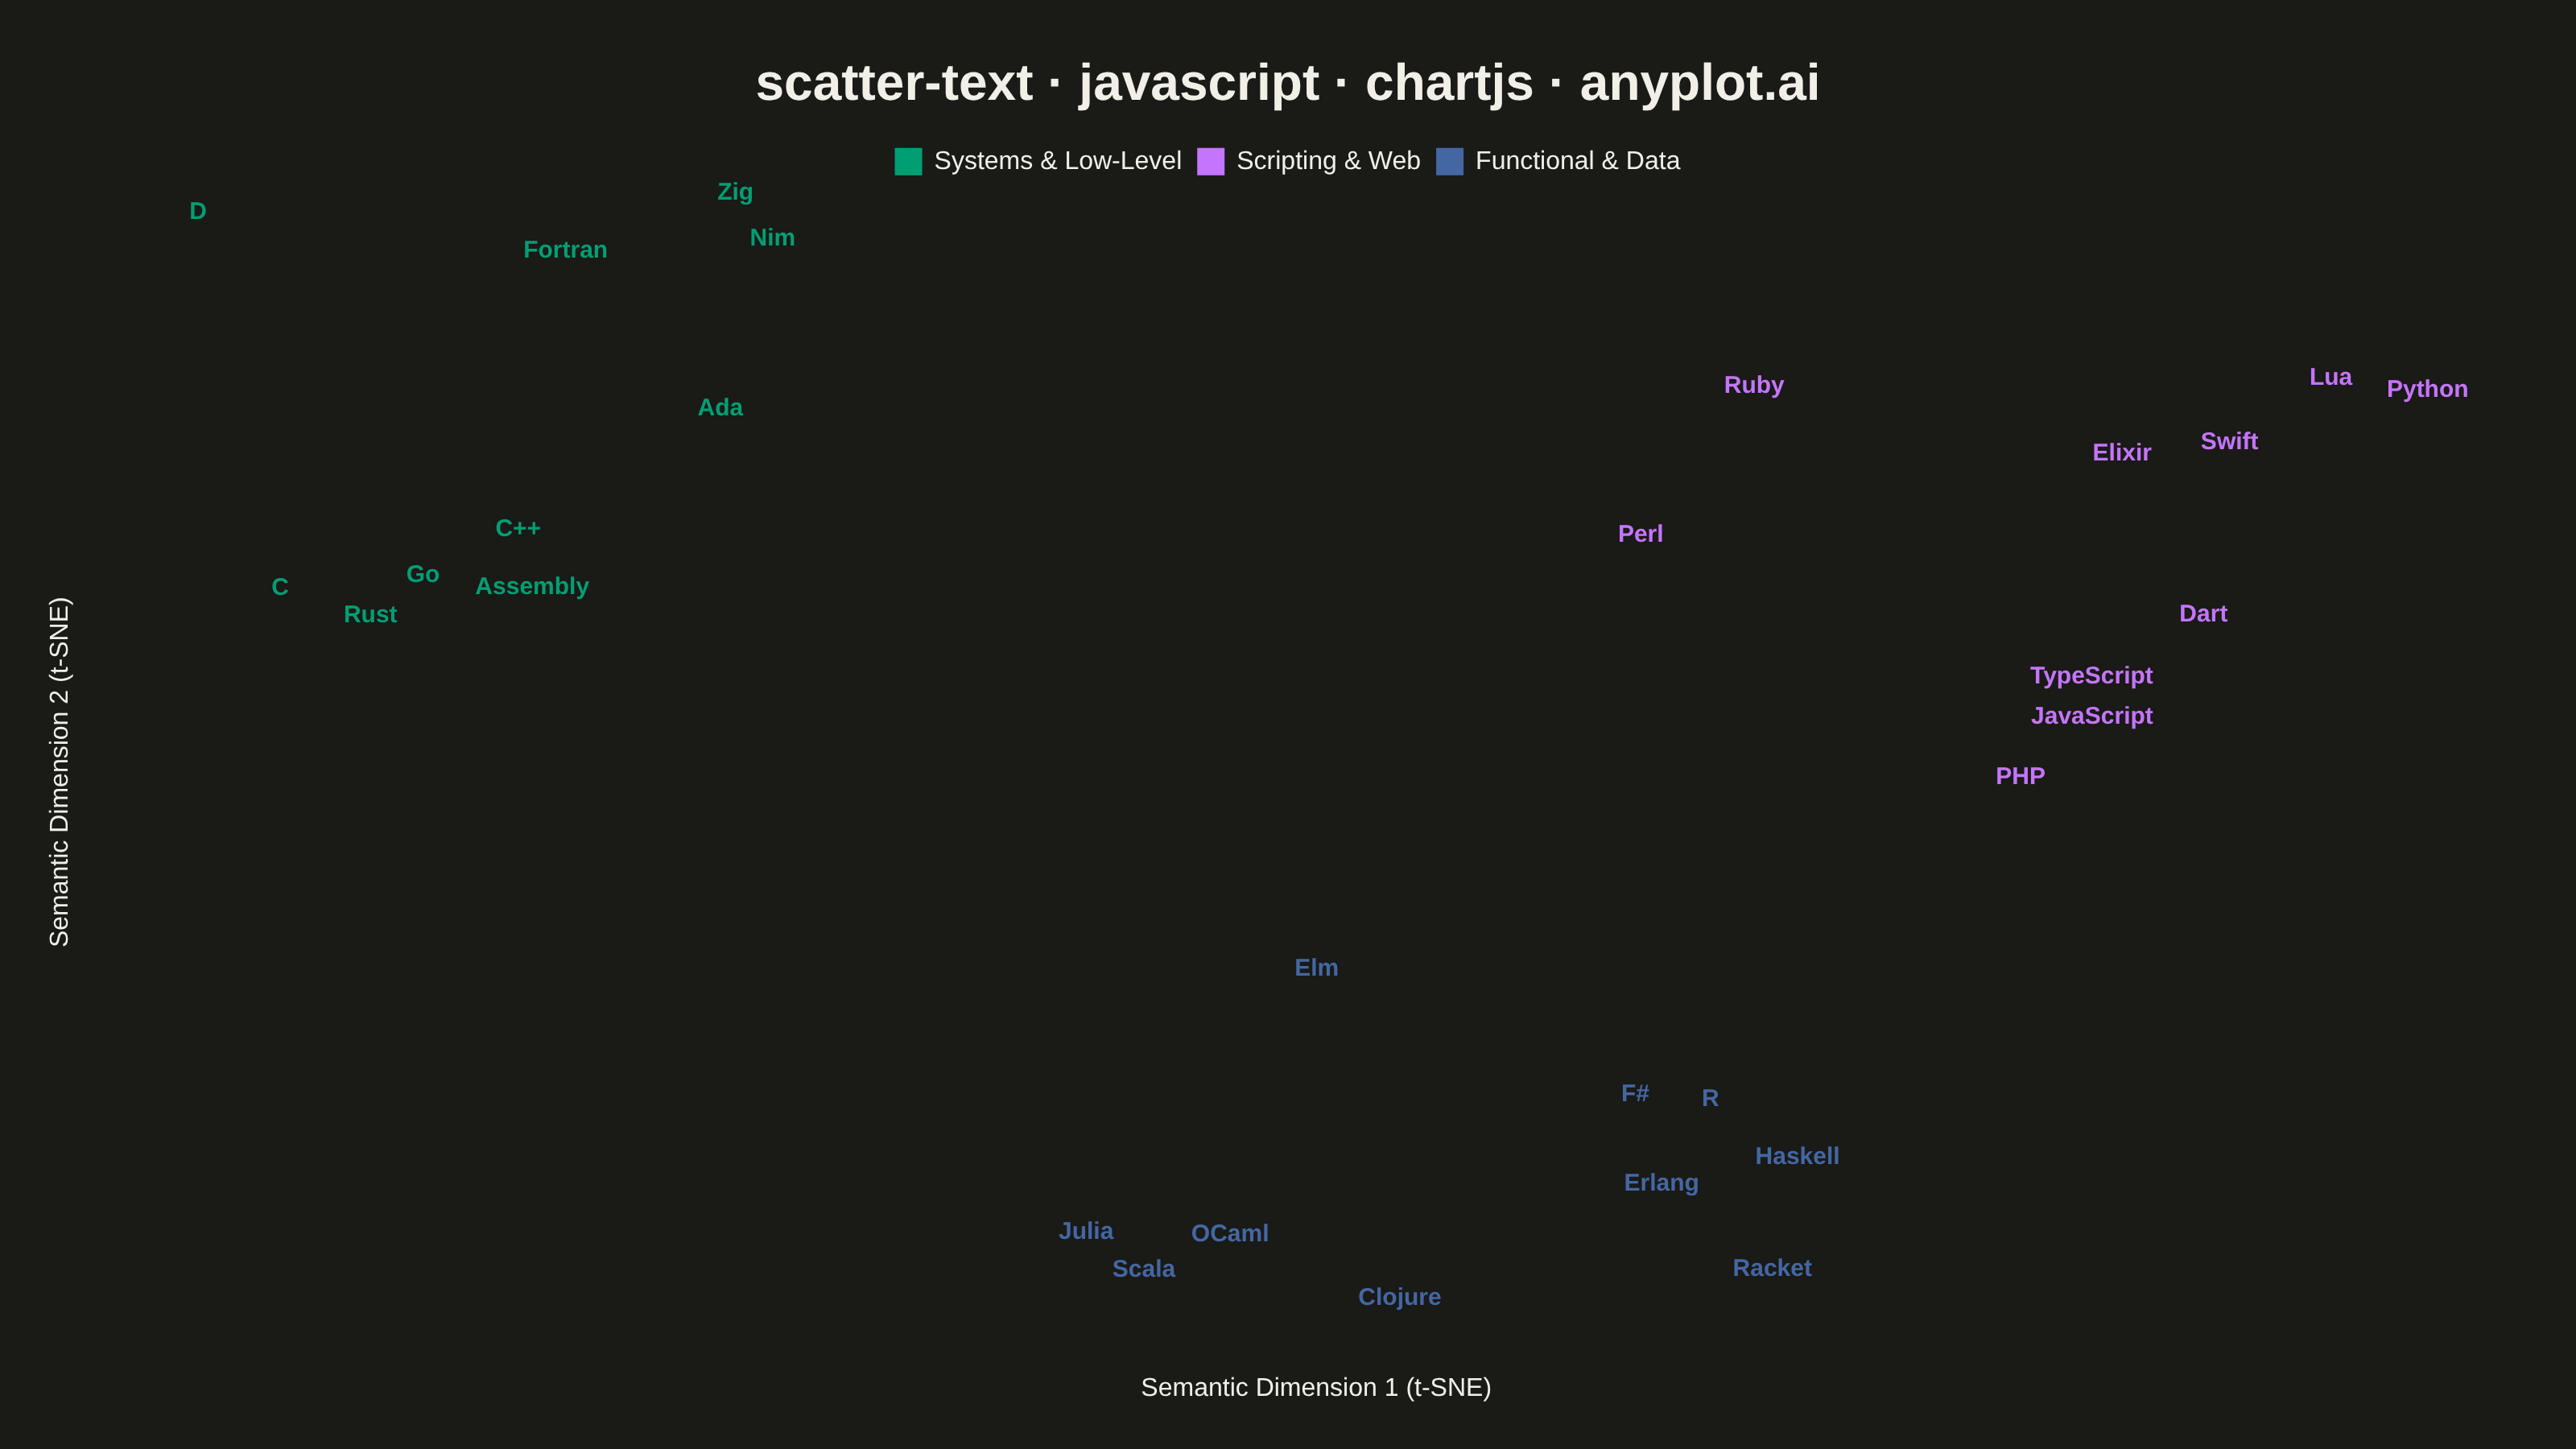
The same plot in 14 other libraries — JavaScript: D3.js, Apache ECharts, Highcharts, MUI X Charts; Python: Altair, Bokeh, lets-plot, Matplotlib, Plotly, plotnine, Pygal, Seaborn; R: ggplot2; Julia: Makie.jl. Compare all 15 side by side: Scatter Plot with Text Labels Instead of Points in Python, R, Julia and JavaScript.
A scatter plot where data points are represented by text labels instead of markers. Each label is positioned at its corresponding coordinates, making the text itself the visual element. This visualization is particularly useful for displaying named entities in 2D space, such as word embeddings, dimensionality reduction outputs, or any scenario where identifying individual items by name is more important than seeing their relative density.
// anyplot.ai
// scatter-text: Scatter Plot with Text Labels Instead of Points
// Library: chartjs 4.4.7 | JavaScript 22.23.2
// Quality: 89/100 | Created: 2026-09-02

const t = window.ANYPLOT_TOKENS;

// --- Data (in-memory, deterministic t-SNE-style embedding) ------------------
// Fixed-seed LCG — the browser has no seeded Math.random().
let seed = 42;
function rand() {
  seed = (seed * 1664525 + 1013904223) % 4294967296;
  return seed / 4294967296;
}
function jitter(cx, cy, spread) {
  return { x: cx + (rand() - 0.5) * spread, y: cy + (rand() - 0.5) * spread };
}

// Cluster centers/spreads chosen to spread coverage across all four quadrants
// of the wide 16:9 canvas (avoids the empty bottom-right seen at attempt 1) and
// to open up the previously crowded Scripting & Web cluster.
const clusters = [
  {
    domain: "Systems & Low-Level",
    center: [-7, 3],
    spread: 6,
    words: ["C", "C++", "Rust", "Go", "Zig", "Ada", "Fortran", "Assembly", "D", "Nim"],
  },
  {
    domain: "Scripting & Web",
    center: [6, 1],
    spread: 7,
    words: ["JavaScript", "TypeScript", "Python", "Ruby", "PHP", "Perl", "Lua", "Dart", "Elixir", "Swift"],
  },
  {
    domain: "Functional & Data",
    center: [1, -7],
    spread: 6,
    words: ["Haskell", "Scala", "Clojure", "F#", "Erlang", "OCaml", "Julia", "Elm", "Racket", "R"],
  },
];

const datasets = clusters.map((cluster, i) => ({
  label: cluster.domain,
  data: cluster.words.map((word) => {
    const p = jitter(cluster.center[0], cluster.center[1], cluster.spread);
    return { x: p.x, y: p.y, label: word };
  }),
  backgroundColor: t.palette[i],
  borderColor: t.palette[i],
  pointRadius: 0,
  pointHoverRadius: 0,
  pointHitRadius: 14,
}));

// --- Plugin: draw each point as its text label instead of a marker ---------
const textLabelPlugin = {
  id: "textLabels",
  afterDatasetsDraw(chart) {
    const { ctx } = chart;
    chart.data.datasets.forEach((dataset, datasetIndex) => {
      const meta = chart.getDatasetMeta(datasetIndex);
      meta.data.forEach((point, index) => {
        const { x, y } = point.getProps(["x", "y"], true);
        const label = dataset.data[index].label;
        ctx.save();
        ctx.font = "600 15px sans-serif";
        ctx.textAlign = "center";
        ctx.textBaseline = "middle";
        // Halo in the page background keeps text legible where labels crowd or cross gridlines.
        ctx.lineWidth = 3;
        ctx.strokeStyle = t.pageBg;
        ctx.strokeText(label, x, y);
        ctx.fillStyle = dataset.backgroundColor;
        ctx.fillText(label, x, y);
        ctx.restore();
      });
    });
  },
};

// --- Mount -------------------------------------------------------------------
const canvas = document.createElement("canvas");
document.getElementById("container").appendChild(canvas);

// --- Chart ---------------------------------------------------------------------
new Chart(canvas, {
  type: "scatter",
  data: { datasets },
  plugins: [textLabelPlugin],
  options: {
    responsive: true,
    maintainAspectRatio: false,
    animation: false,
    layout: { padding: 24 },
    plugins: {
      title: {
        display: true,
        text: "scatter-text · javascript · chartjs · anyplot.ai",
        color: t.ink,
        font: { size: 32, weight: "600" },
      },
      legend: {
        position: "top",
        labels: { color: t.ink, font: { size: 16 }, boxWidth: 16, boxHeight: 16 },
      },
      tooltip: {
        callbacks: {
          label: (context) => context.raw.label,
        },
      },
    },
    scales: {
      // Numeric t-SNE coordinates carry no literal meaning, so ticks stay hidden;
      // going fully borderless (no grid, no axis line) avoids the four-sided box
      // a bare grid would draw and keeps focus on the text-label clusters.
      x: {
        title: { display: true, text: "Semantic Dimension 1 (t-SNE)", color: t.ink, font: { size: 16 } },
        ticks: { display: false },
        grid: { display: false },
        border: { display: false },
      },
      y: {
        title: { display: true, text: "Semantic Dimension 2 (t-SNE)", color: t.ink, font: { size: 16 } },
        ticks: { display: false },
        grid: { display: false },
        border: { display: false },
      },
    },
  },
});
Runnable source as JSON, for any HTTP client: https://api.anyplot.ai/specs/scatter-text/chartjs/code. Any spec id and library id listed in llms-full.txt fit the same URL shape; every URL below is complete and callable.
{
  "spec_id": "scatter-text",
  "language": "javascript",
  "library": "chartjs",
  "page": "https://anyplot.ai/scatter-text/javascript/chartjs",
  "hub": "https://anyplot.ai/scatter-text",
  "code_json": "https://api.anyplot.ai/specs/scatter-text/chartjs/code",
  "spec_json": "https://api.anyplot.ai/specs/scatter-text",
  "render_light_png": "https://storage.googleapis.com/anyplot-images/plots/scatter-text/javascript/chartjs/plot-light.png",
  "render_dark_png": "https://storage.googleapis.com/anyplot-images/plots/scatter-text/javascript/chartjs/plot-dark.png",
  "interactive_light_html": "https://storage.googleapis.com/anyplot-images/plots/scatter-text/javascript/chartjs/plot-light.html",
  "interactive_dark_html": "https://storage.googleapis.com/anyplot-images/plots/scatter-text/javascript/chartjs/plot-dark.html",
  "quality_score": 89.0,
  "license": "MIT",
  "guide": "https://anyplot.ai/llms.txt"
}
Part of Scatter Plot with Text Labels Instead of Points on anyplot.ai.