The same plot in 14 other libraries — Python: Altair, Bokeh, lets-plot, Matplotlib, Plotly, plotnine, Pygal, Seaborn; R: ggplot2; JavaScript: Chart.js, D3.js, Apache ECharts, Highcharts, MUI X Charts. Compare all 15 side by side: Scatter Plot with Text Labels Instead of Points in Python, R, Julia and JavaScript.
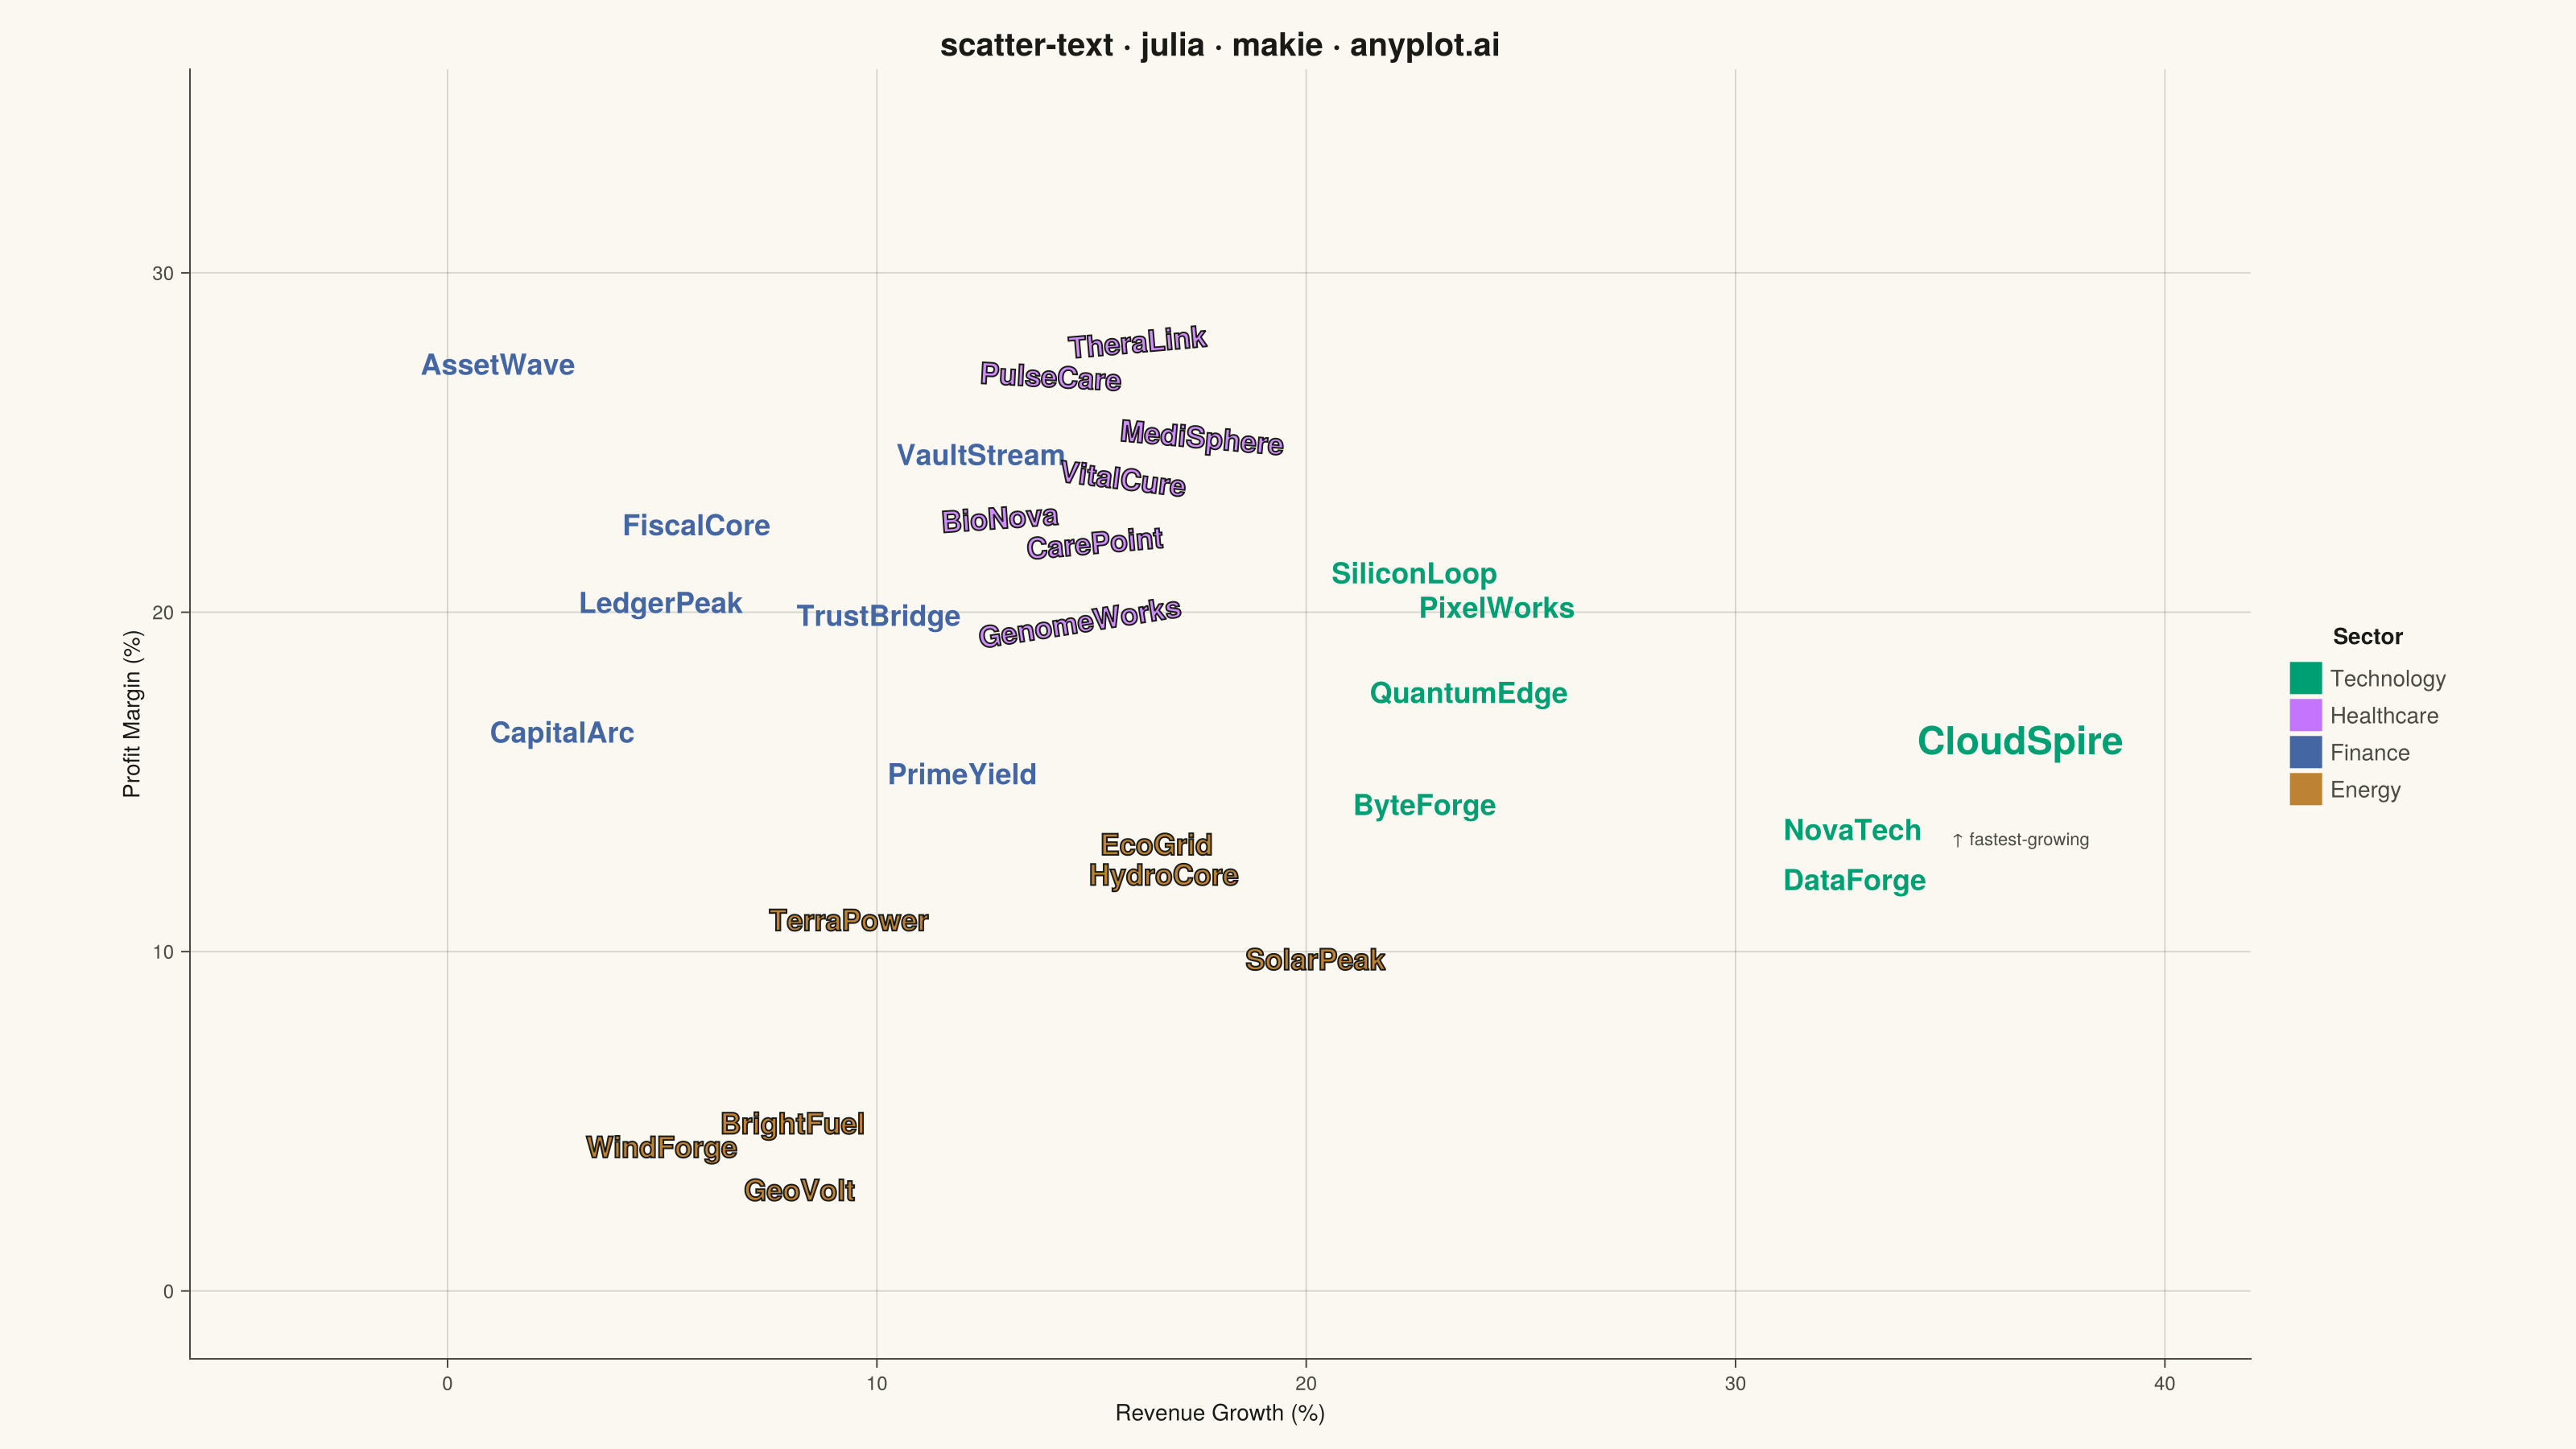
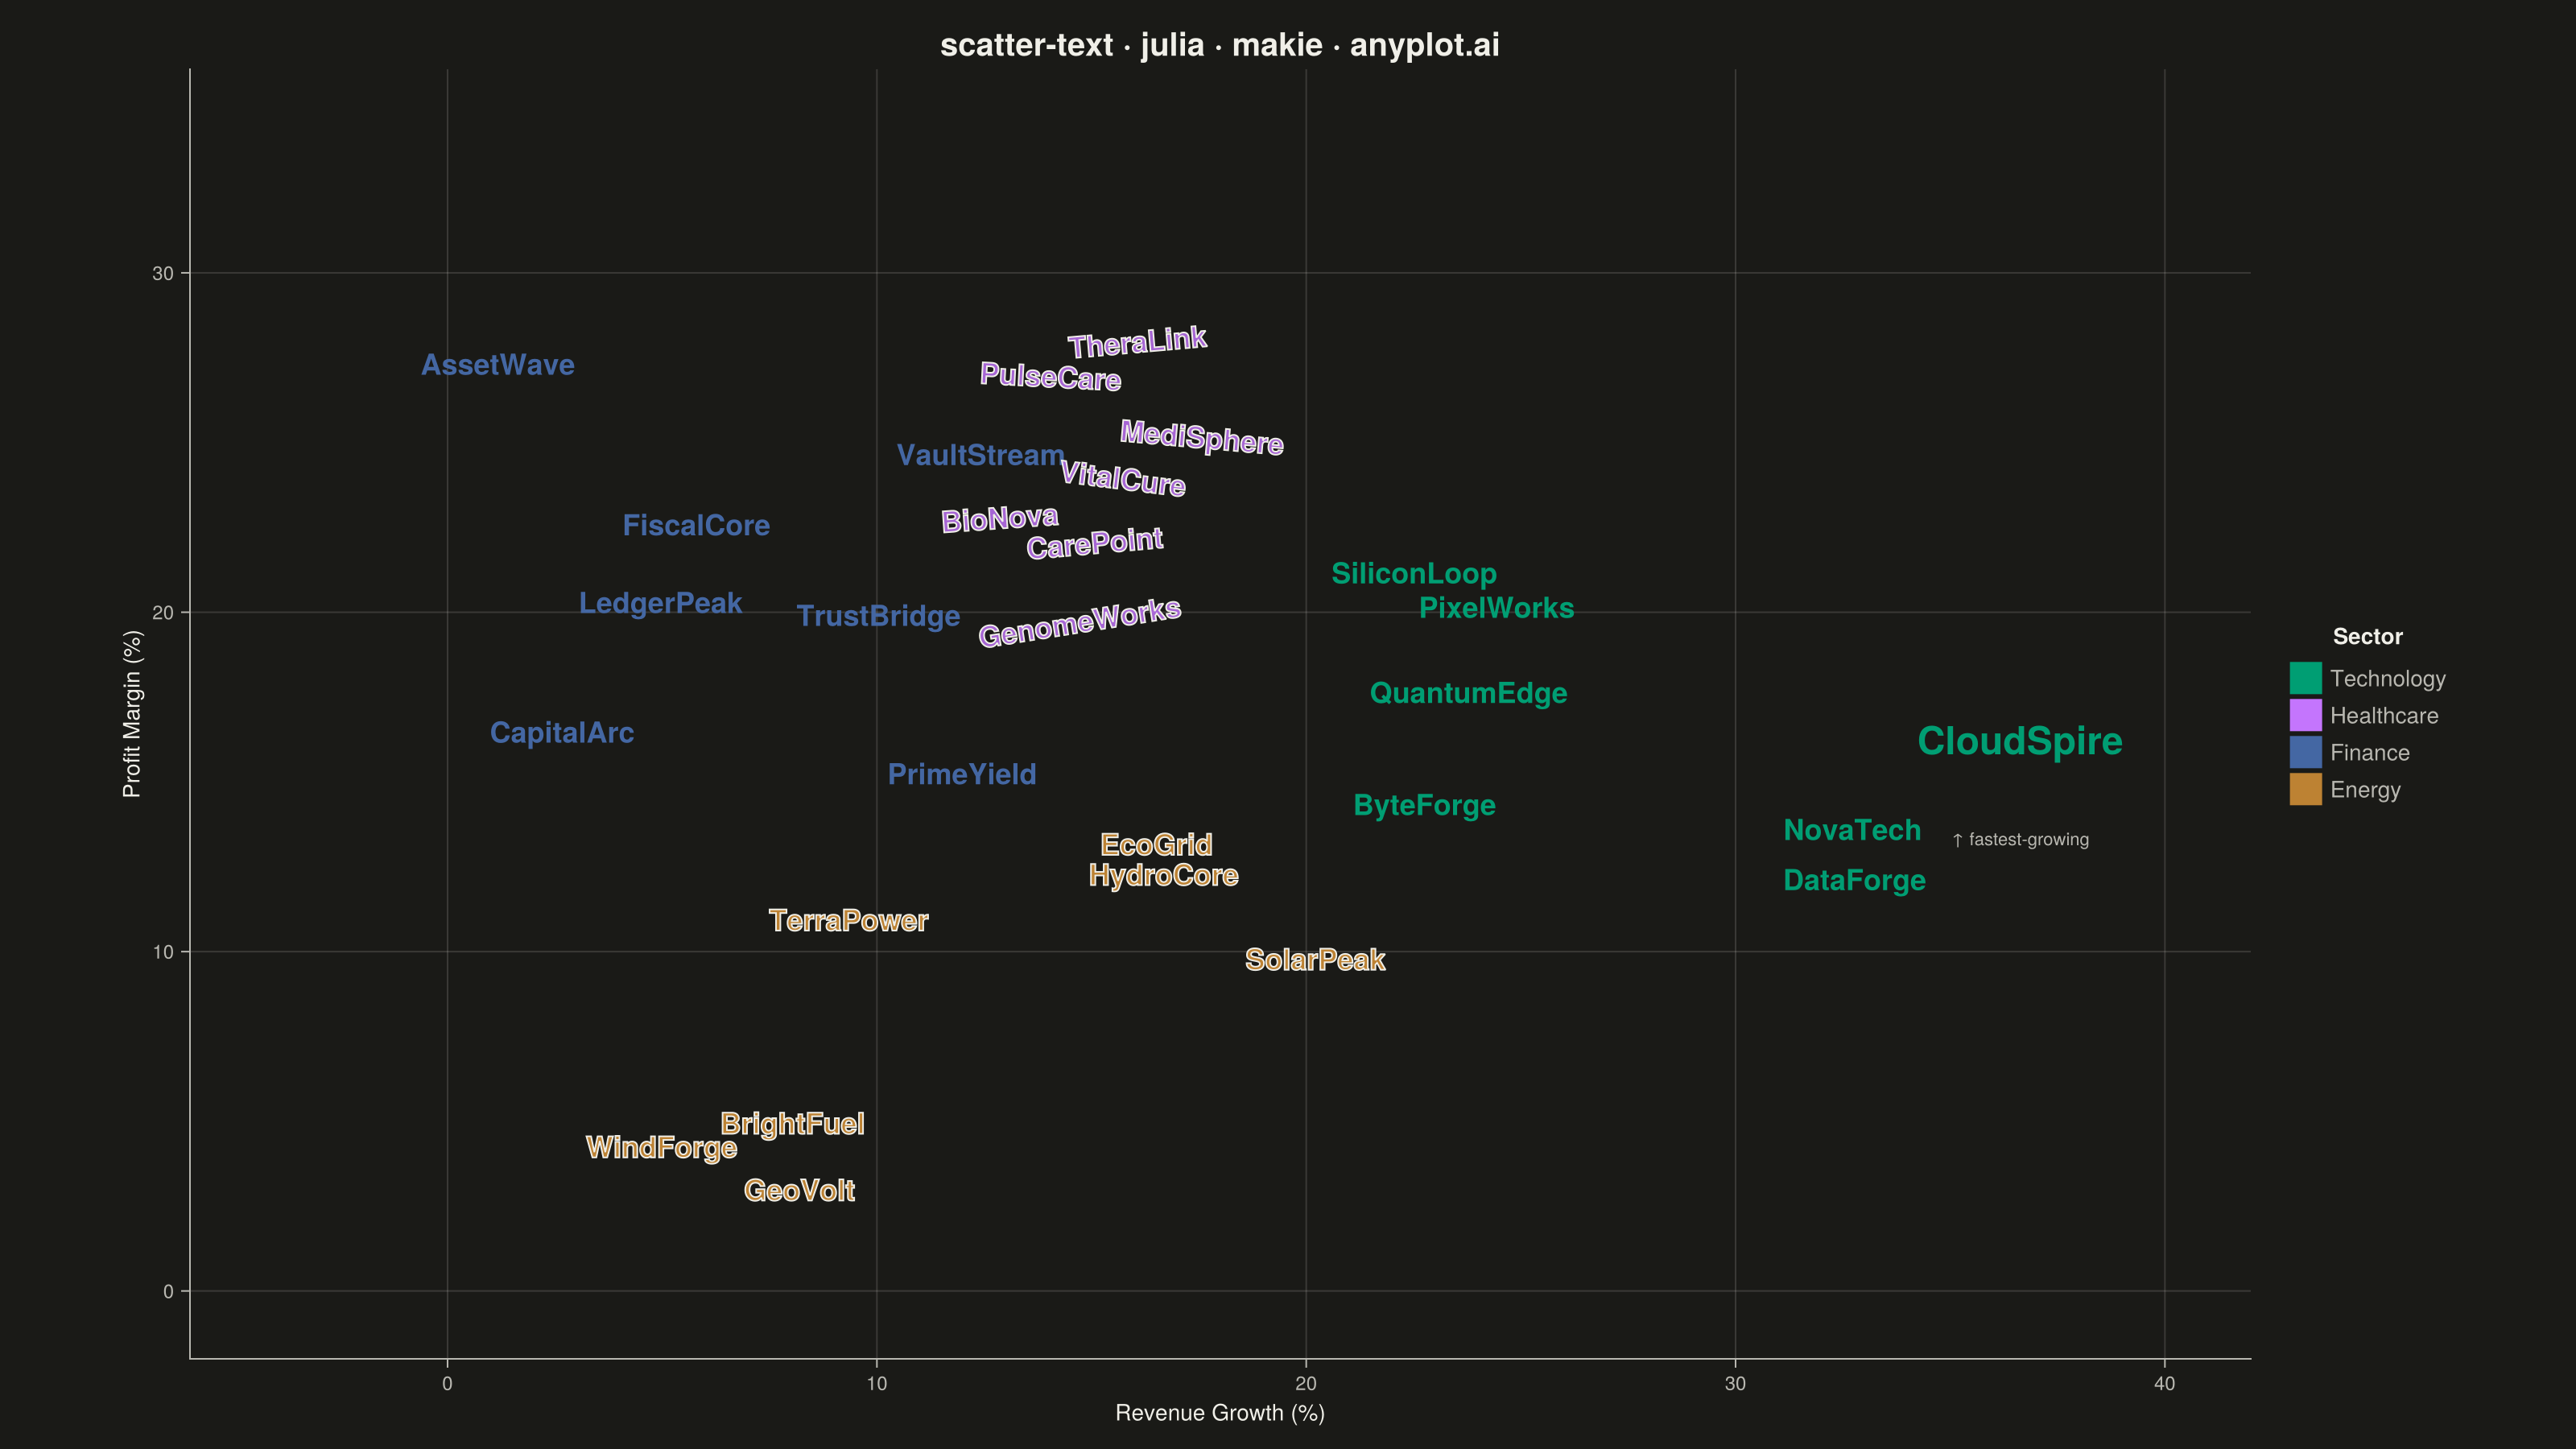
A scatter plot where data points are represented by text labels instead of markers. Each label is positioned at its corresponding coordinates, making the text itself the visual element. This visualization is particularly useful for displaying named entities in 2D space, such as word embeddings, dimensionality reduction outputs, or any scenario where identifying individual items by name is more important than seeing their relative density.
# anyplot.ai
# scatter-text: Scatter Plot with Text Labels Instead of Points
# Library: makie 0.21.9 | Julia 1.11.9
# Quality: 95/100 | Created: 2026-09-02

using CairoMakie
using Colors
using Random

Random.seed!(42)

# --- Theme tokens -------------------------------------------------------------
const THEME    = get(ENV, "ANYPLOT_THEME", "light")
const PAGE_BG  = THEME == "light" ? colorant"#FAF8F1" : colorant"#1A1A17"
const INK      = THEME == "light" ? colorant"#1A1A17" : colorant"#F0EFE8"
const INK_SOFT = THEME == "light" ? colorant"#4A4A44" : colorant"#B8B7B0"

# Imprint palette — 8 hues, theme-independent, hybrid-v3 sort
const IMPRINT_PALETTE = [
    colorant"#009E73", colorant"#C475FD", colorant"#4467A3", colorant"#BD8233",
    colorant"#AE3030", colorant"#2ABCCD", colorant"#954477", colorant"#99B314",
]

# --- Data -----------------------------------------------------------------
# Fictional companies positioned by revenue growth vs. profit margin —
# competitive-landscape mapping where the company name matters more than density.
sectors = ["Technology", "Healthcare", "Finance", "Energy"]

companies = Dict(
    "Technology" => ["NovaTech", "ByteForge", "QuantumEdge", "SiliconLoop", "CloudSpire", "DataForge", "PixelWorks"],
    "Healthcare" => ["VitalCure", "BioNova", "MediSphere", "PulseCare", "GenomeWorks", "CarePoint", "TheraLink"],
    "Finance" => ["CapitalArc", "TrustBridge", "LedgerPeak", "FiscalCore", "AssetWave", "VaultStream", "PrimeYield"],
    "Energy" => ["SolarPeak", "WindForge", "HydroCore", "GeoVolt", "EcoGrid", "TerraPower", "BrightFuel"],
)

# (growth_mean, growth_std, margin_mean, margin_std) per sector.
# Healthcare is drawn with a tighter spread on purpose: it is the one sector
# where labels sit close enough together to require the density-management
# techniques (rotation jitter + alpha) the spec calls out for dense regions.
cluster_params = Dict(
    "Technology" => (28.0, 6.0, 18.0, 5.0),
    "Healthcare" => (14.0, 2.5, 24.0, 2.8),
    "Finance" => (6.0, 5.0, 22.0, 5.5),
    "Energy" => (10.0, 7.0, 10.0, 6.0),
)

labels = String[]
growth = Float64[]
margin = Float64[]
point_colors = RGB{Float64}[]
point_sectors = String[]

for (i, sector) in enumerate(sectors)
    growth_mean, growth_std, margin_mean, margin_std = cluster_params[sector]
    for name in companies[sector]
        push!(labels, name)
        push!(growth, growth_mean + growth_std * randn())
        push!(margin, margin_mean + margin_std * randn())
        push!(point_colors, IMPRINT_PALETTE[i])
        push!(point_sectors, sector)
    end
end

# De-overlap pass: the tight Healthcare cluster can draw a label almost on top
# of a neighbor (in or out of Healthcare) by chance — nudge any such pair
# apart symmetrically along their connecting vector. Runs a few passes since
# separating one pair can nudge a label into a third; only Healthcare's
# tighter cluster is normalized this aggressively, so other sectors keep
# their original (already-reviewed) spacing untouched.
healthcare_idx = findall(==("Healthcare"), point_sectors)
xspan, yspan = 48.0, 38.0  # matches xlims!/ylims! below
min_norm_dist = 0.05
n = length(labels)
for _pass in 1:4, a in 1:n, b in (a + 1):n
    if a ∉ healthcare_idx && b ∉ healthcare_idx
        continue
    end
    dx = (growth[b] - growth[a]) / xspan
    dy = (margin[b] - margin[a]) / yspan
    dist = max(hypot(dx, dy), 1e-6)
    if dist < min_norm_dist
        push_x = (min_norm_dist - dist) * (dx / dist) * xspan / 2
        push_y = (min_norm_dist - dist) * (dy / dist) * yspan / 2
        growth[a] -= push_x; margin[a] -= push_y
        growth[b] += push_x; margin[b] += push_y
    end
end

# CloudSpire is the clear growth outlier — give it visual emphasis (larger,
# bolder label) instead of leaving it to blend in with the rest of the cluster.
outlier_idx = findfirst(==("CloudSpire"), labels)
fontsizes = fill(18.0, length(labels))
fontsizes[outlier_idx] = 24.0

# Jitter rotation and soften alpha for the dense Healthcare cluster, per the
# spec's density-management guidance.
rotations = zeros(Float64, length(labels))
alphas = ones(Float64, length(labels))
for idx in healthcare_idx
    rotations[idx] = deg2rad(rand(-12:12))
    alphas[idx] = 0.82
end

label_colors = [RGBAf(c.r, c.g, c.b, a) for (c, a) in zip(point_colors, alphas)]
points = Point2f.(growth, margin)

# Healthcare and Energy sit below WCAG 3:1 contrast on the cream bg as plain
# text (no marker ink to fall back on) — give just those two an ink stroke.
energy_idx = findall(==("Energy"), point_sectors)
stroke_idx = vcat(healthcare_idx, energy_idx)
plain_idx = findall(s -> s in ("Technology", "Finance"), point_sectors)

# --- Plot -------------------------------------------------------------------
fig = Figure(
    resolution      = (1600, 900),
    fontsize        = 14,
    backgroundcolor = PAGE_BG,
)

ax = Axis(
    fig[1, 1];
    title              = "scatter-text · julia · makie · anyplot.ai",
    titlesize          = 20,
    titlecolor         = INK,
    xlabel             = "Revenue Growth (%)",
    ylabel             = "Profit Margin (%)",
    xlabelsize         = 14,
    ylabelsize         = 14,
    xlabelcolor        = INK,
    ylabelcolor        = INK,
    xticklabelsize     = 12,
    yticklabelsize     = 12,
    xticklabelcolor    = INK_SOFT,
    yticklabelcolor    = INK_SOFT,
    xtickcolor         = INK_SOFT,
    ytickcolor         = INK_SOFT,
    backgroundcolor    = PAGE_BG,
    topspinevisible    = false,
    rightspinevisible  = false,
    leftspinecolor     = INK_SOFT,
    bottomspinecolor   = INK_SOFT,
    xgridcolor         = RGBAf(INK.r, INK.g, INK.b, 0.15),
    ygridcolor         = RGBAf(INK.r, INK.g, INK.b, 0.15),
    xminorgridvisible  = false,
    yminorgridvisible  = false,
)

text!(
    ax, points[plain_idx];
    text = labels[plain_idx],
    color = label_colors[plain_idx],
    fontsize = fontsizes[plain_idx],
    rotation = rotations[plain_idx],
    font = :bold,
    align = (:center, :center),
)

text!(
    ax, points[stroke_idx];
    text = labels[stroke_idx],
    color = label_colors[stroke_idx],
    fontsize = fontsizes[stroke_idx],
    rotation = rotations[stroke_idx],
    font = :bold,
    align = (:center, :center),
    strokewidth = 1.0,
    strokecolor = INK,
)

# Callout for the growth outlier, reinforcing the emphasis from its larger fontsize.
text!(
    ax, Point2f(growth[outlier_idx], margin[outlier_idx] - 2.6);
    text = "↑ fastest-growing",
    fontsize = 11,
    font = :regular,
    color = INK_SOFT,
    align = (:center, :top),
)

xlims!(ax, -6, 42)
ylims!(ax, -2, 36)

legend_elements = [PolyElement(color = IMPRINT_PALETTE[i], strokecolor = :transparent) for i in 1:length(sectors)]
Legend(
    fig[1, 2], legend_elements, sectors, "Sector";
    framevisible = false,
    labelcolor = INK_SOFT,
    titlecolor = INK,
    backgroundcolor = PAGE_BG,
)
colsize!(fig.layout, 1, Relative(0.85))

# --- Save -------------------------------------------------------------------
save("plot-$(THEME).png", fig; px_per_unit = 2)
Runnable source as JSON, for any HTTP client: https://api.anyplot.ai/specs/scatter-text/makie/code. Any spec id and library id listed in llms-full.txt fit the same URL shape; every URL below is complete and callable.
{
  "spec_id": "scatter-text",
  "language": "julia",
  "library": "makie",
  "page": "https://anyplot.ai/scatter-text/julia/makie",
  "hub": "https://anyplot.ai/scatter-text",
  "code_json": "https://api.anyplot.ai/specs/scatter-text/makie/code",
  "spec_json": "https://api.anyplot.ai/specs/scatter-text",
  "render_light_png": "https://storage.googleapis.com/anyplot-images/plots/scatter-text/julia/makie/plot-light.png",
  "render_dark_png": "https://storage.googleapis.com/anyplot-images/plots/scatter-text/julia/makie/plot-dark.png",
  "quality_score": 95.0,
  "license": "MIT",
  "guide": "https://anyplot.ai/llms.txt"
}
Part of Scatter Plot with Text Labels Instead of Points on anyplot.ai.