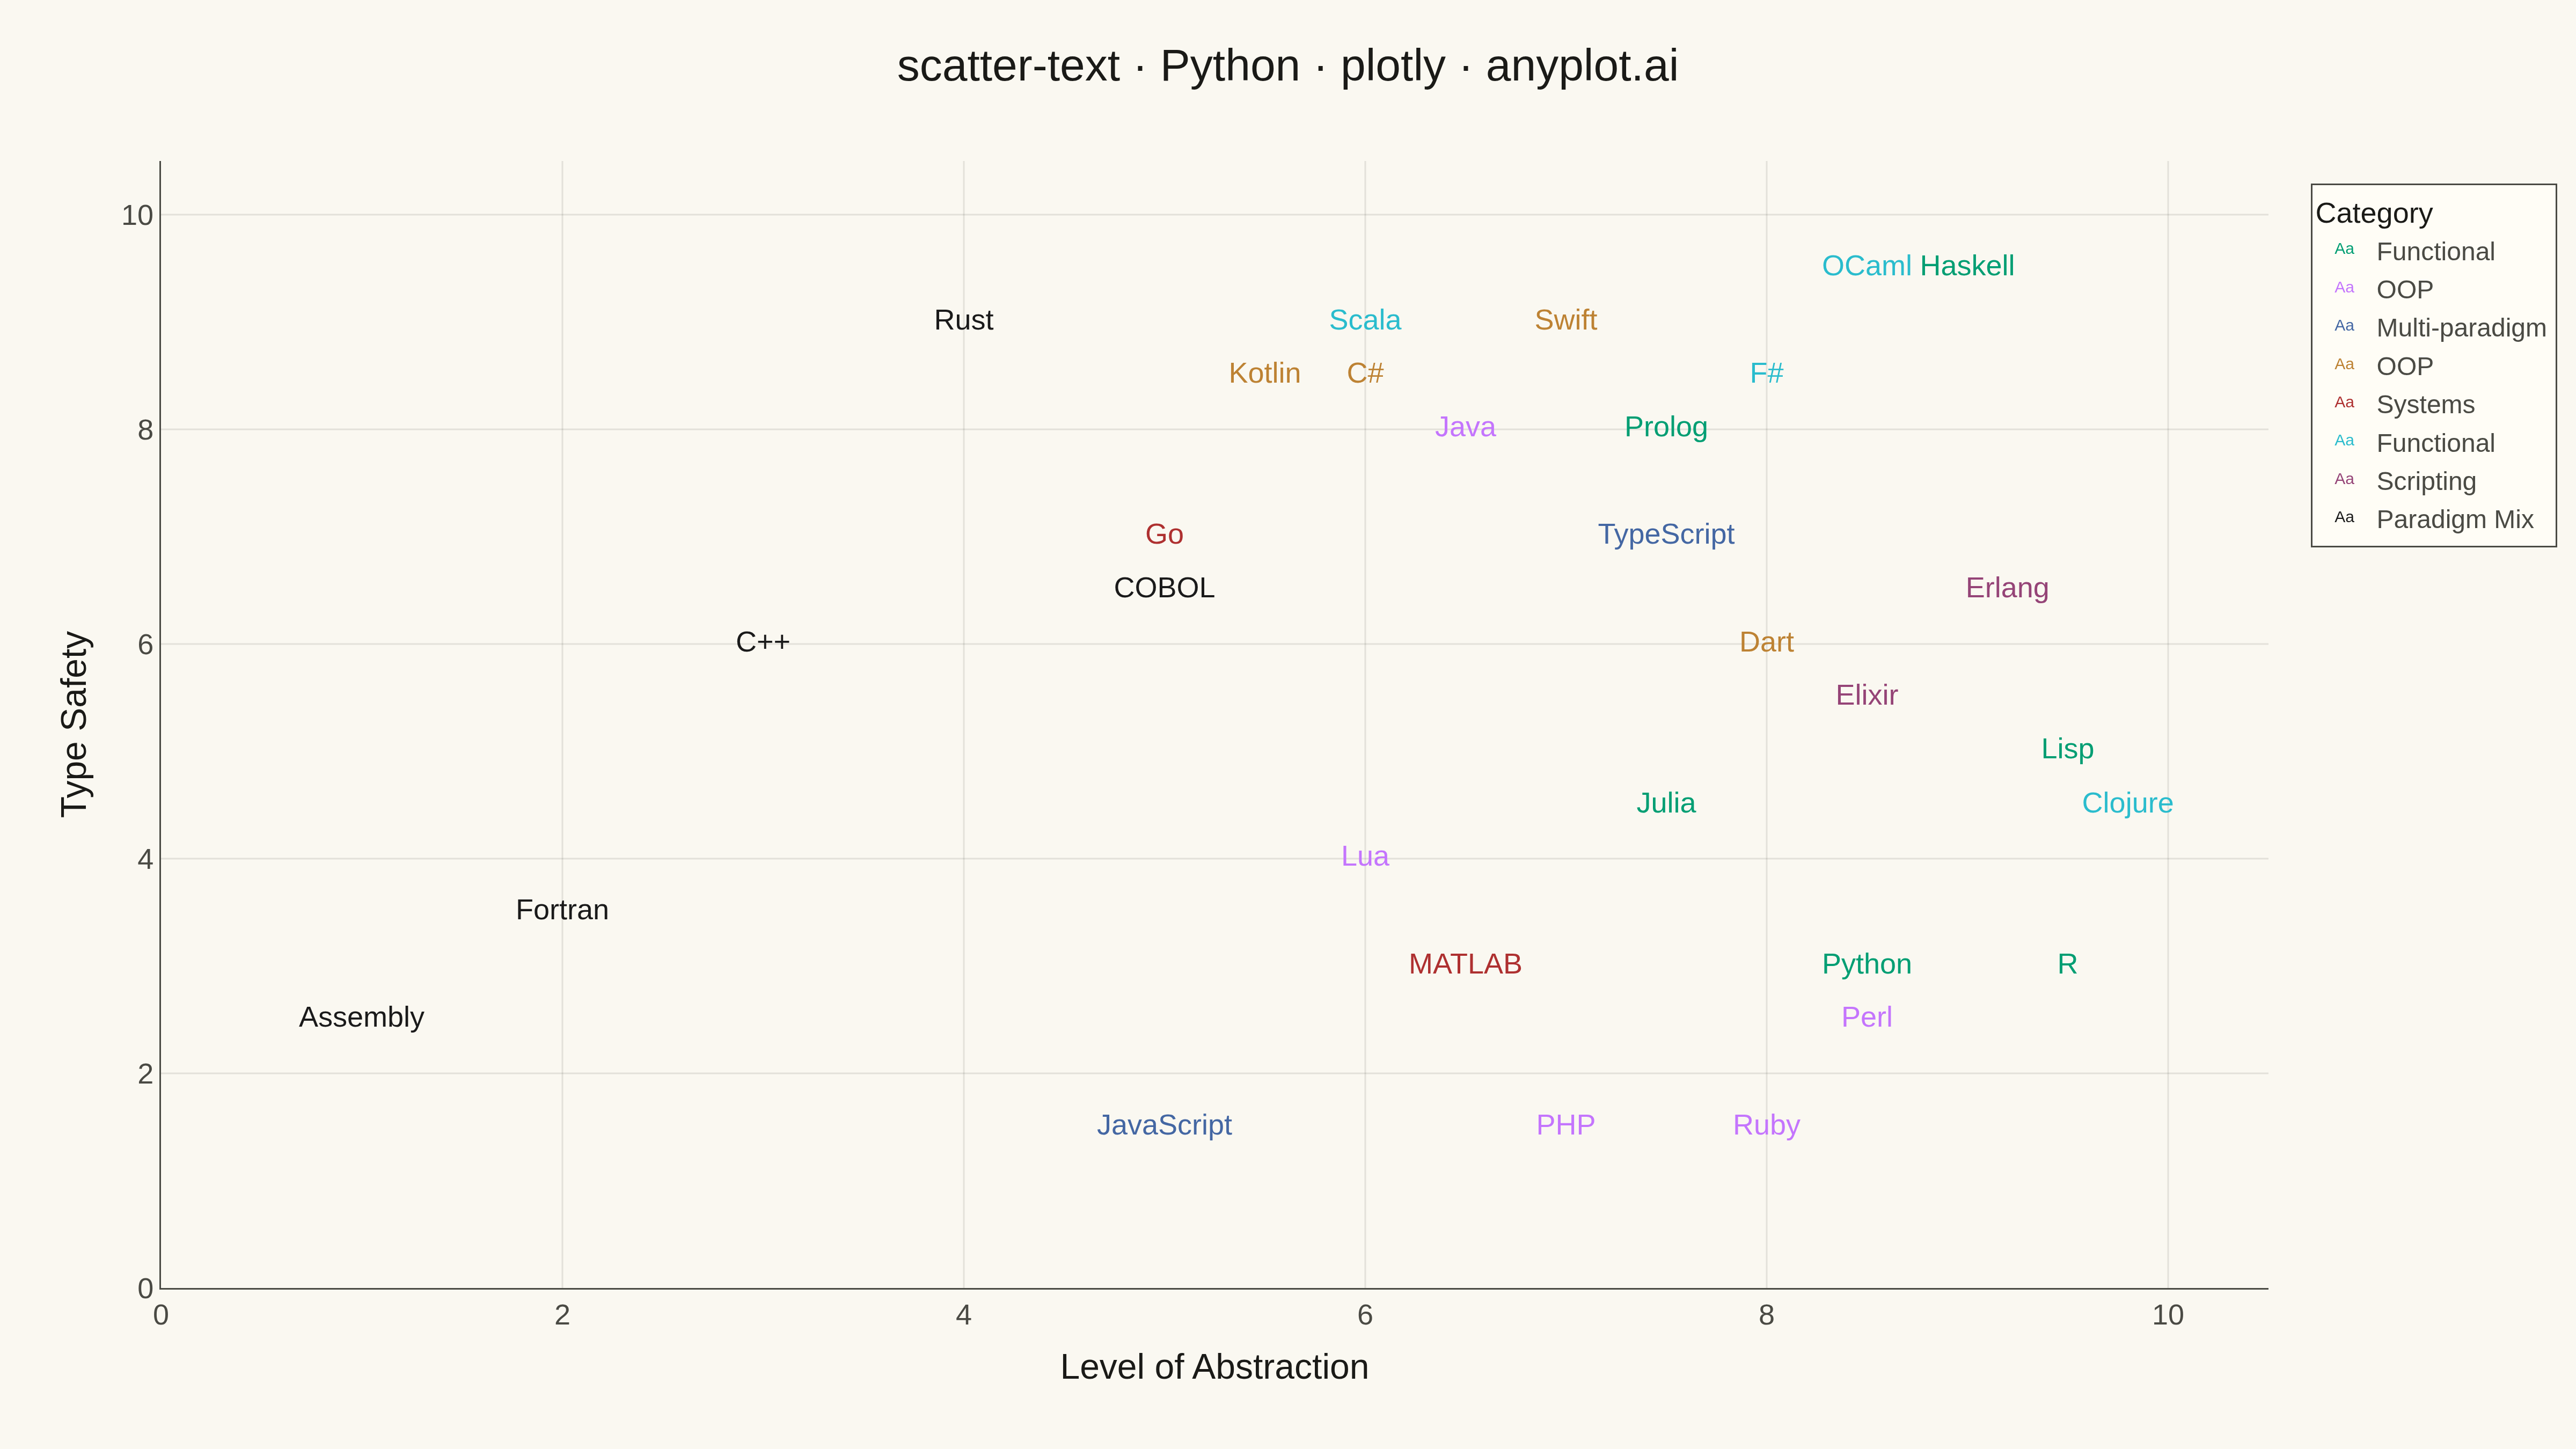
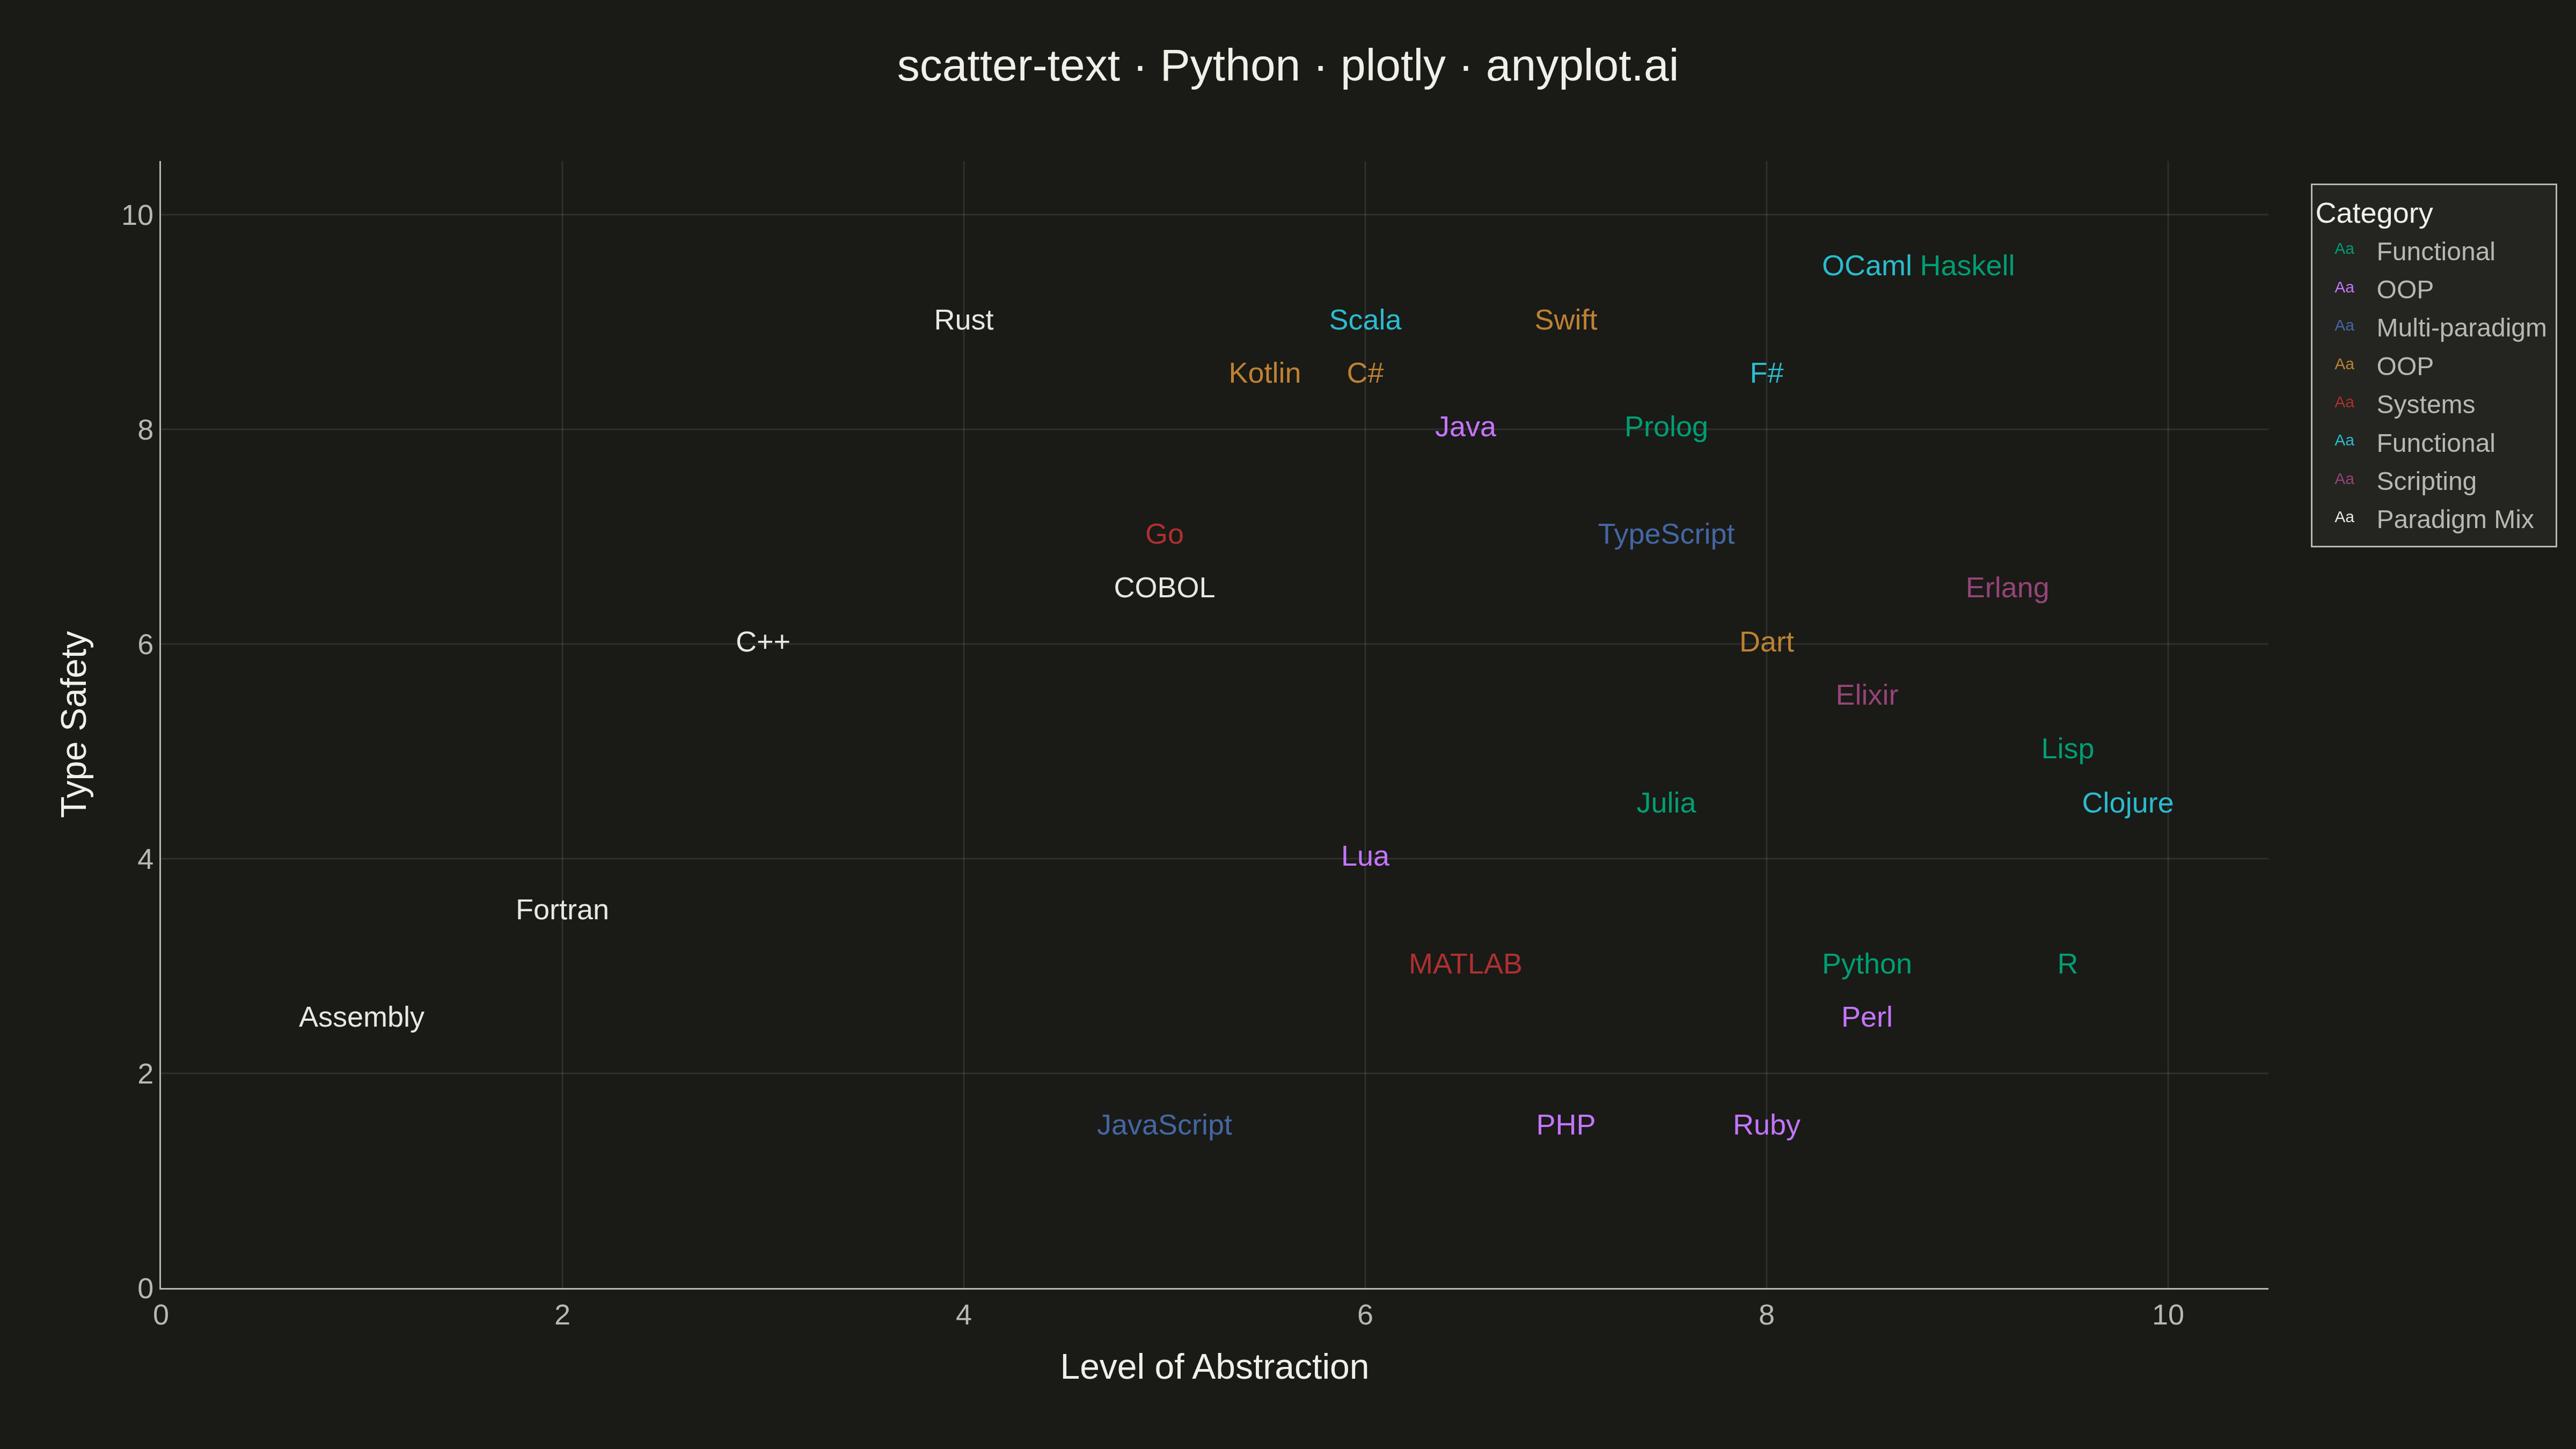
A scatter plot where data points are represented by text labels instead of markers. Each label is positioned at its corresponding coordinates, making the text itself the visual element. This visualization is particularly useful for displaying named entities in 2D space, such as word embeddings, dimensionality reduction outputs, or any scenario where identifying individual items by name is more important than seeing their relative density.
""" anyplot.ai
scatter-text: Scatter Plot with Text Labels Instead of Points
Library: plotly 6.7.0 | Python 3.13.13
Quality: 84/100 | Updated: 2026-05-17
"""

import os

import plotly.graph_objects as go


# Theme tokens
THEME = os.getenv("ANYPLOT_THEME", "light")
PAGE_BG = "#FAF8F1" if THEME == "light" else "#1A1A17"
ELEVATED_BG = "#FFFDF6" if THEME == "light" else "#242420"
INK = "#1A1A17" if THEME == "light" else "#F0EFE8"
INK_SOFT = "#4A4A44" if THEME == "light" else "#B8B7B0"
GRID = "rgba(26,26,23,0.10)" if THEME == "light" else "rgba(240,239,232,0.10)"

# Okabe-Ito palette for categories
IMPRINT = [
    "#009E73",  # bluish green (brand)
    "#C475FD",  # vermillion
    "#4467A3",  # blue
    "#BD8233",  # reddish purple
    "#AE3030",  # orange
    "#2ABCCD",  # sky blue
    "#954477",  # yellow
    "#1A1A1A" if THEME == "light" else "#E8E8E0",  # adaptive neutral
]

# Data - Programming languages positioned by paradigm characteristics
labels = [
    "Python",
    "JavaScript",
    "Java",
    "C++",
    "Ruby",
    "Go",
    "Rust",
    "Kotlin",
    "Swift",
    "TypeScript",
    "Scala",
    "Haskell",
    "Elixir",
    "Clojure",
    "F#",
    "R",
    "Julia",
    "MATLAB",
    "Perl",
    "PHP",
    "C#",
    "Dart",
    "Lua",
    "Erlang",
    "OCaml",
    "Fortran",
    "COBOL",
    "Assembly",
    "Lisp",
    "Prolog",
]

# Position based on: x = Level of abstraction, y = Type safety
# Improved coordinates to reduce clustering
x = [
    8.5,  # Python
    5.0,  # JavaScript - shifted further left
    6.5,  # Java
    3.0,  # C++
    8.0,  # Ruby
    5.0,  # Go
    4.0,  # Rust
    5.5,  # Kotlin
    7.0,  # Swift
    7.5,  # TypeScript
    6.0,  # Scala
    9.0,  # Haskell
    8.5,  # Elixir
    9.8,  # Clojure
    8.0,  # F#
    9.5,  # R
    7.5,  # Julia
    6.5,  # MATLAB
    8.5,  # Perl
    7.0,  # PHP
    6.0,  # C#
    8.0,  # Dart
    6.0,  # Lua
    9.2,  # Erlang
    8.5,  # OCaml
    2.0,  # Fortran
    5.0,  # COBOL
    1.0,  # Assembly
    9.5,  # Lisp
    7.5,  # Prolog
]

y = [
    3.0,  # Python
    1.5,  # JavaScript
    8.0,  # Java
    6.0,  # C++
    1.5,  # Ruby
    7.0,  # Go
    9.0,  # Rust
    8.5,  # Kotlin
    9.0,  # Swift
    7.0,  # TypeScript
    9.0,  # Scala
    9.5,  # Haskell
    5.5,  # Elixir
    4.5,  # Clojure
    8.5,  # F#
    3.0,  # R
    4.5,  # Julia
    3.0,  # MATLAB
    2.5,  # Perl
    1.5,  # PHP
    8.5,  # C#
    6.0,  # Dart
    4.0,  # Lua
    6.5,  # Erlang
    9.5,  # OCaml
    3.5,  # Fortran
    6.5,  # COBOL
    2.5,  # Assembly
    5.0,  # Lisp
    8.0,  # Prolog
]

# Assign to Okabe-Ito positions by paradigm
categories = [
    0,  # Python - bluish green (brand)
    2,  # JavaScript - blue
    1,  # Java - vermillion
    7,  # C++ - neutral
    1,  # Ruby - vermillion
    4,  # Go - orange
    7,  # Rust - neutral
    3,  # Kotlin - reddish purple
    3,  # Swift - reddish purple
    2,  # TypeScript - blue
    5,  # Scala - sky blue
    0,  # Haskell - bluish green
    6,  # Elixir - yellow
    5,  # Clojure - sky blue
    5,  # F# - sky blue
    0,  # R - bluish green
    0,  # Julia - bluish green
    4,  # MATLAB - orange
    1,  # Perl - vermillion
    1,  # PHP - vermillion
    3,  # C# - reddish purple
    3,  # Dart - reddish purple
    1,  # Lua - vermillion
    6,  # Erlang - yellow
    5,  # OCaml - sky blue
    7,  # Fortran - neutral
    7,  # COBOL - neutral
    7,  # Assembly - neutral
    0,  # Lisp - bluish green
    0,  # Prolog - bluish green
]

category_names = ["Functional", "OOP", "Multi-paradigm", "OOP", "Systems", "Functional", "Scripting", "Paradigm Mix"]

# Create figure with text labels as data points
fig = go.Figure()

# Add text labels grouped by category for legend
category_colors = {}
for cat_idx, cat_name in enumerate(category_names):
    mask = [c == cat_idx for c in categories]
    if any(mask):
        x_cat = [x[i] for i in range(len(x)) if mask[i]]
        y_cat = [y[i] for i in range(len(y)) if mask[i]]
        labels_cat = [labels[i] for i in range(len(labels)) if mask[i]]

        color = IMPRINT[cat_idx]
        category_colors[cat_name] = color

        # Create hover text with detailed information
        hover_cat = [
            f"<b>{labels[i]}</b><br>Abstraction: {x[i]:.1f}<br>Type Safety: {y[i]:.1f}"
            for i in range(len(labels))
            if mask[i]
        ]

        fig.add_trace(
            go.Scatter(
                x=x_cat,
                y=y_cat,
                mode="text",
                text=labels_cat,
                textfont=dict(size=18, color=color),
                textposition="middle center",
                name=cat_name,
                showlegend=True,
                hovertext=hover_cat,
                hoverinfo="text",
            )
        )

# Update layout with theme-adaptive colors
fig.update_layout(
    title=dict(
        text="scatter-text · Python · plotly · anyplot.ai", font=dict(size=28, color=INK), x=0.5, xanchor="center"
    ),
    xaxis=dict(
        title=dict(text="Level of Abstraction", font=dict(size=22, color=INK)),
        tickfont=dict(size=18, color=INK_SOFT),
        range=[0, 10.5],
        gridcolor=GRID,
        gridwidth=1,
        linecolor=INK_SOFT,
        zerolinecolor=INK_SOFT,
    ),
    yaxis=dict(
        title=dict(text="Type Safety", font=dict(size=22, color=INK)),
        tickfont=dict(size=18, color=INK_SOFT),
        range=[0, 10.5],
        gridcolor=GRID,
        gridwidth=1,
        linecolor=INK_SOFT,
        zerolinecolor=INK_SOFT,
    ),
    paper_bgcolor=PAGE_BG,
    plot_bgcolor=PAGE_BG,
    legend=dict(
        title=dict(text="Category", font=dict(size=18, color=INK)),
        font=dict(size=16, color=INK_SOFT),
        bgcolor=ELEVATED_BG,
        bordercolor=INK_SOFT,
        borderwidth=1,
        x=1.02,
        y=0.98,
        xanchor="left",
        yanchor="top",
    ),
    margin=dict(l=100, r=180, t=100, b=100),
    font=dict(family="Arial"),
)

# Save as PNG and HTML
fig.write_image(f"plot-{THEME}.png", width=1600, height=900, scale=3)
fig.write_html(f"plot-{THEME}.html", include_plotlyjs="cdn")
Runnable source as JSON, for any HTTP client: https://api.anyplot.ai/specs/scatter-text/plotly/code. Any spec id and library id listed in llms-full.txt fit the same URL shape; every URL below is complete and callable.
{
  "spec_id": "scatter-text",
  "language": "python",
  "library": "plotly",
  "page": "https://anyplot.ai/scatter-text/python/plotly",
  "hub": "https://anyplot.ai/scatter-text",
  "code_json": "https://api.anyplot.ai/specs/scatter-text/plotly/code",
  "spec_json": "https://api.anyplot.ai/specs/scatter-text",
  "render_light_png": "https://storage.googleapis.com/anyplot-images/plots/scatter-text/python/plotly/plot-light.png",
  "render_dark_png": "https://storage.googleapis.com/anyplot-images/plots/scatter-text/python/plotly/plot-dark.png",
  "interactive_light_html": "https://storage.googleapis.com/anyplot-images/plots/scatter-text/python/plotly/plot-light.html",
  "interactive_dark_html": "https://storage.googleapis.com/anyplot-images/plots/scatter-text/python/plotly/plot-dark.html",
  "quality_score": 84.0,
  "license": "MIT",
  "guide": "https://anyplot.ai/llms.txt"
}
Part of Scatter Plot with Text Labels Instead of Points on anyplot.ai.