The same plot in 14 other libraries — JavaScript: D3.js, Apache ECharts, Highcharts, MUI X Charts; Python: Altair, Bokeh, lets-plot, Matplotlib, Plotly, plotnine, Pygal, Seaborn; R: ggplot2; Julia: Makie.jl. Compare all 15 side by side: SHAP Summary Plot in Python, R, Julia and JavaScript.
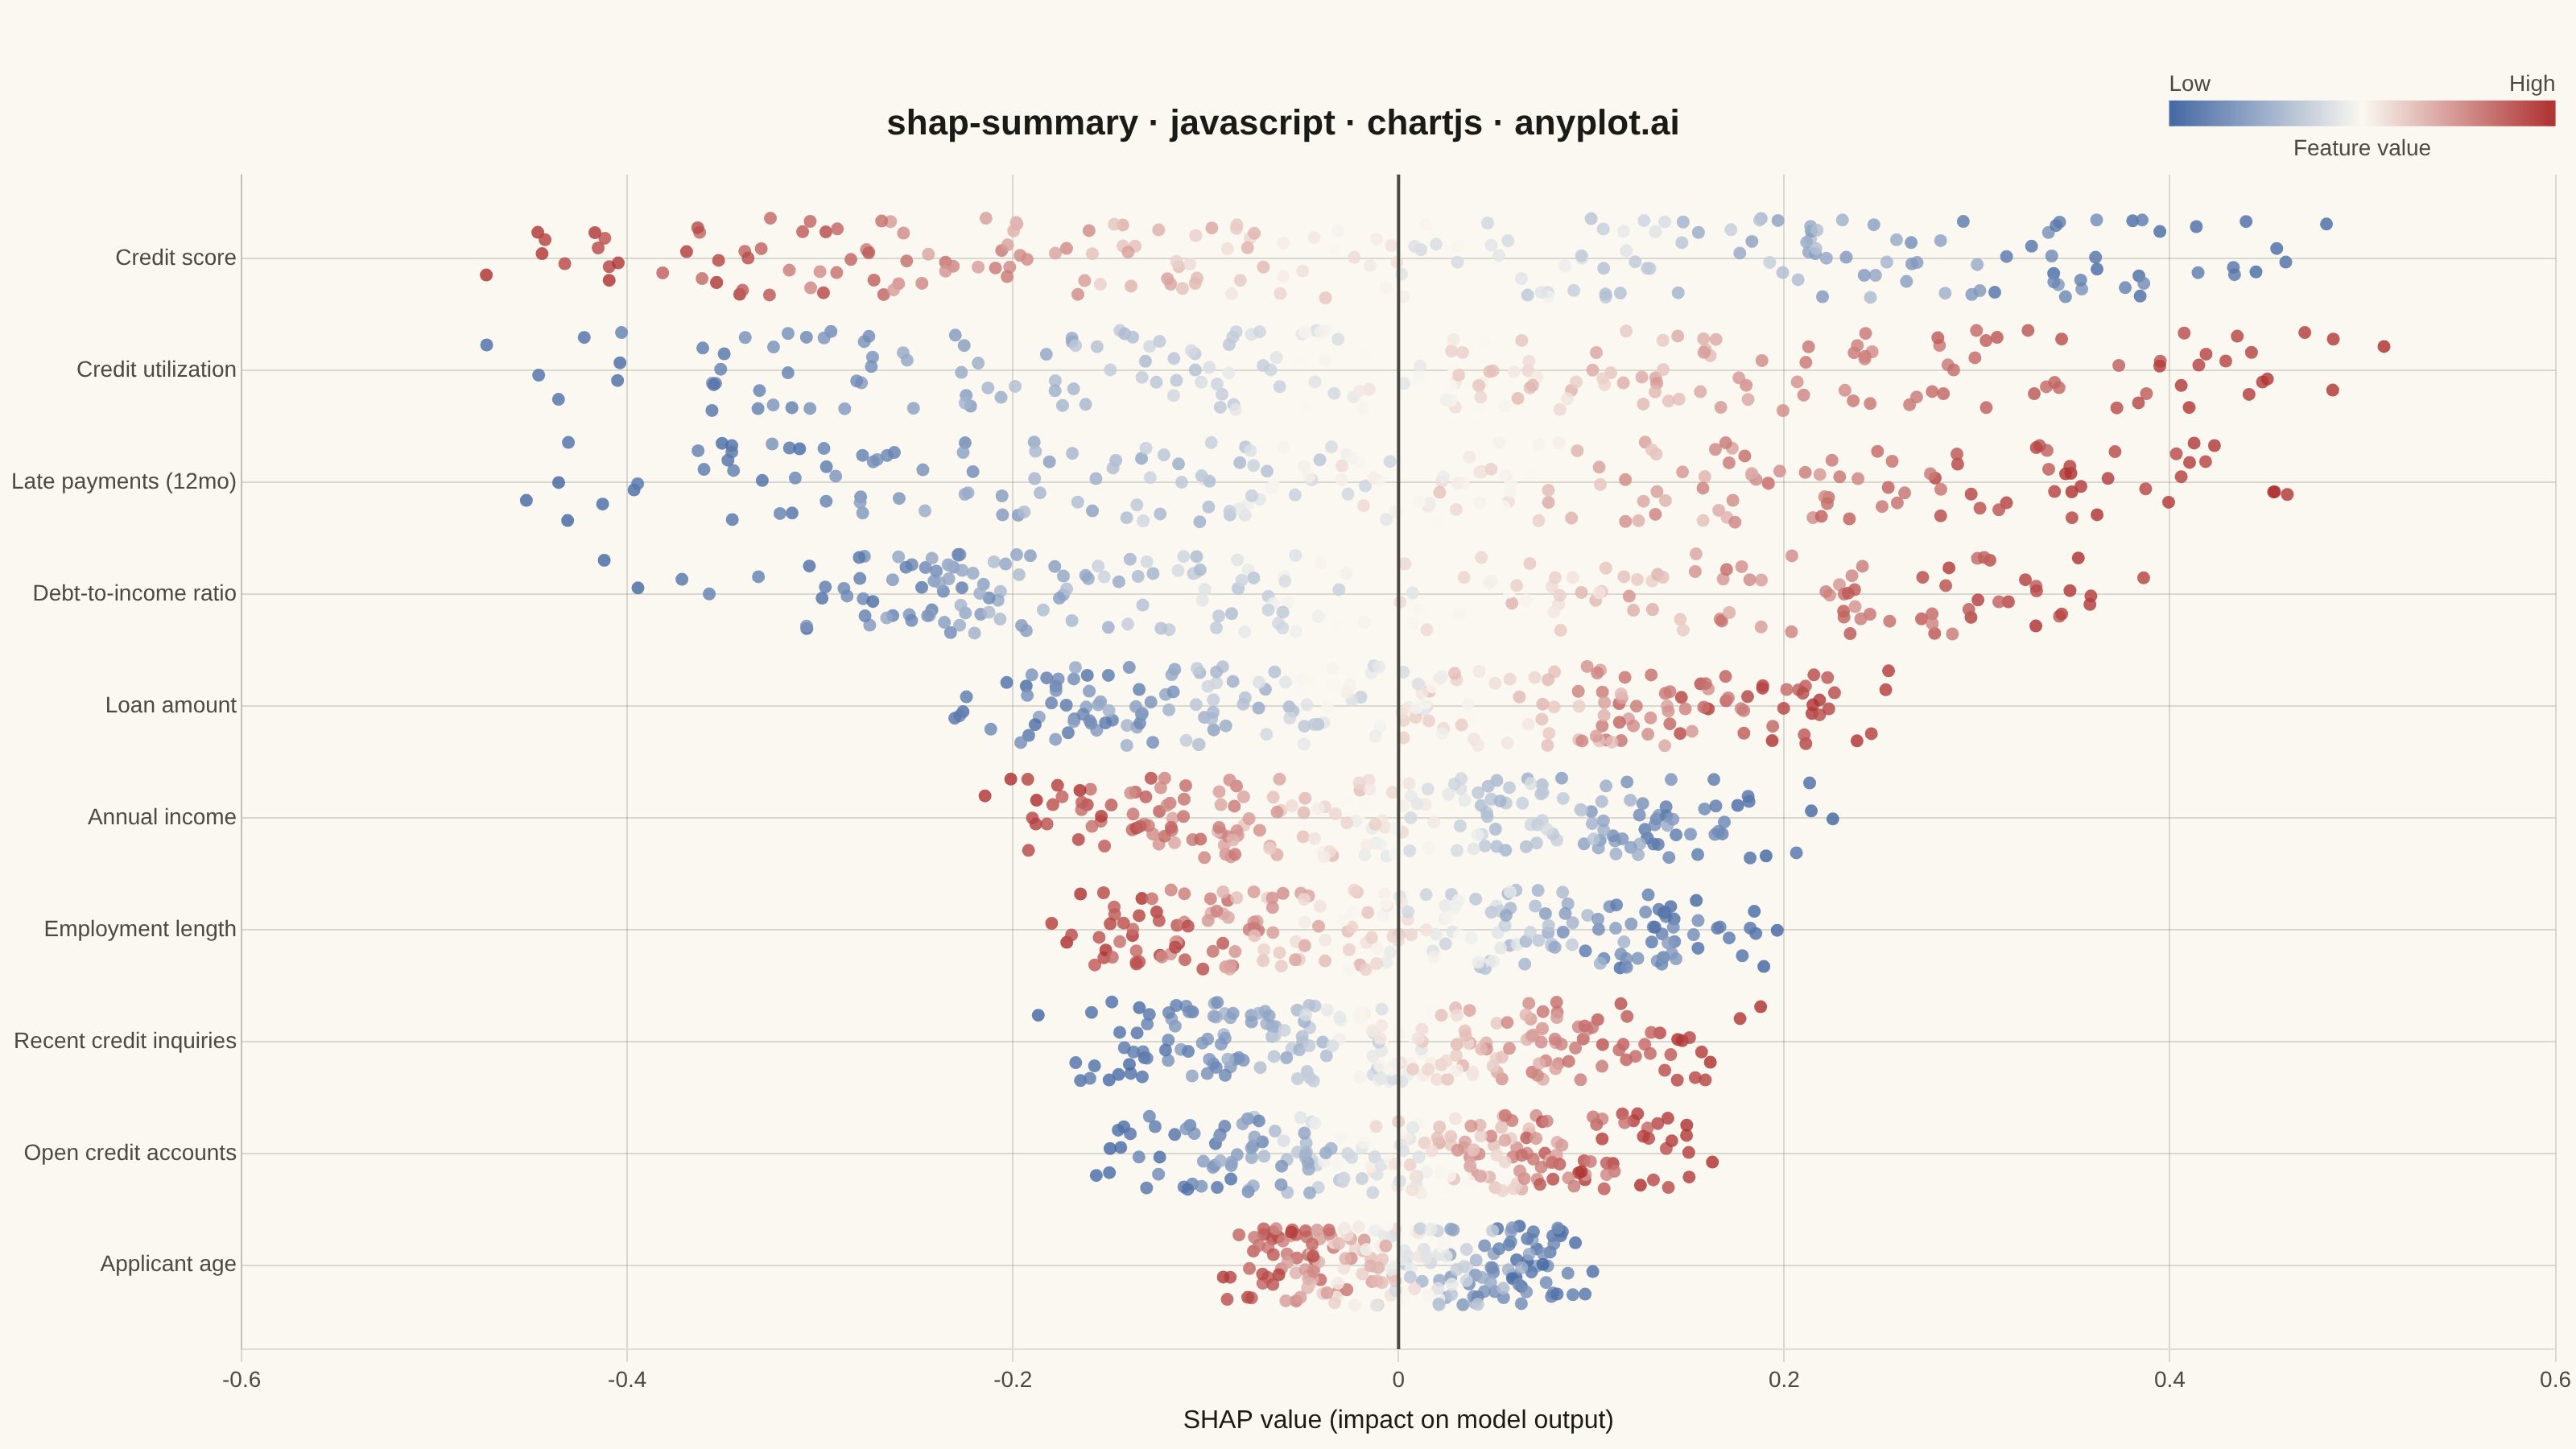
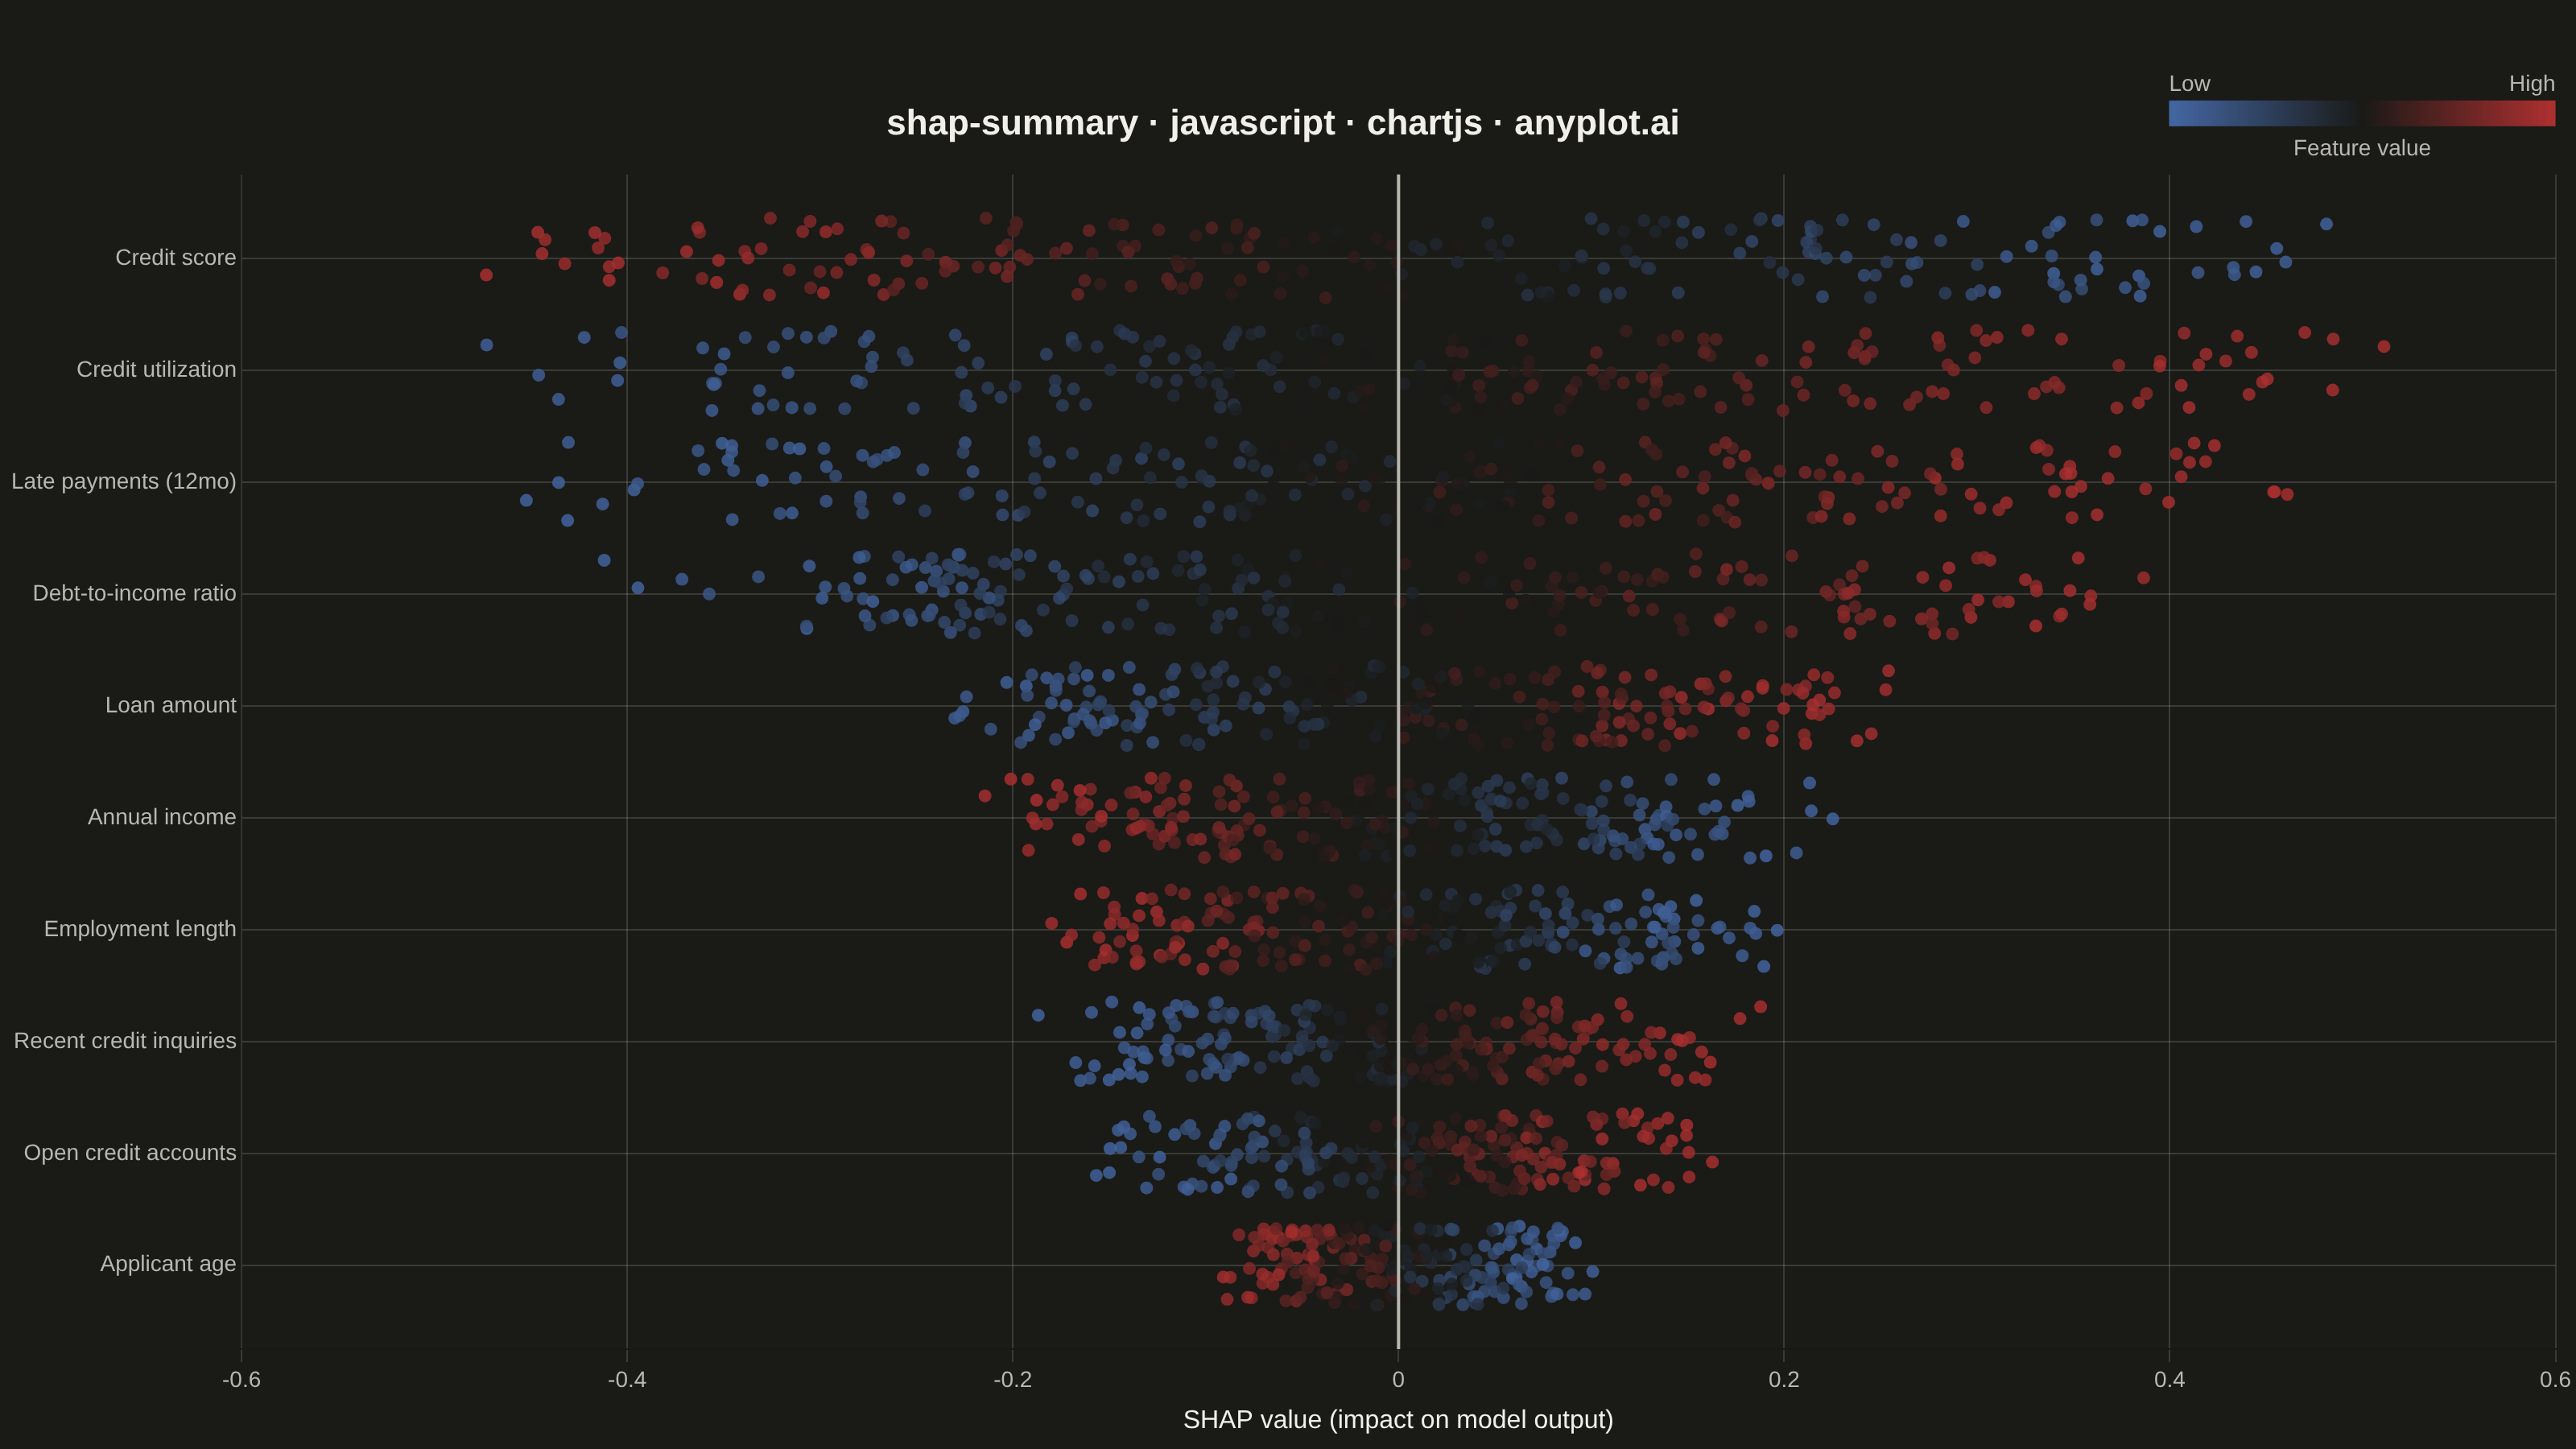
A SHAP (SHapley Additive exPlanations) summary plot displaying the distribution of SHAP values for each feature, ordered by mean absolute SHAP value (importance). Each dot represents a sample, positioned horizontally by its SHAP value and colored by the feature's value (typically low=blue to high=red). This visualization is essential for machine learning interpretability, showing both feature importance and the direction and magnitude of feature effects on model predictions.
// anyplot.ai
// shap-summary: SHAP Summary Plot
// Library: chartjs 4.4.7 | JavaScript 22.23.2
// Quality: 90/100 | Created: 2026-09-09
//# anyplot-orientation: landscape

const t = window.ANYPLOT_TOKENS;

// --- Deterministic PRNG (no seeded RNG in the browser) ----------------------
function makeLcg(seed) {
  let state = seed >>> 0;
  return function lcg() {
    state = (state * 1664525 + 1013904223) >>> 0;
    return state / 4294967296;
  };
}
const rng = makeLcg(20260909);

// --- Data: synthetic SHAP output from a gradient-boosted loan-default model -
// One feature carries `direction` (does a HIGH raw value push risk up or down)
// and `nonlinear` (a mild non-linear kink, per the spec's "detect non-linear
// relationships" application). `scale` sets the typical |SHAP value| magnitude
// before mean-abs importance is computed and used to rank + trim to top 10.
const FEATURE_DEFS = [
  { name: "Credit score", scale: 0.42, direction: -1, nonlinear: false, noise: 0.35 },
  { name: "Debt-to-income ratio", scale: 0.35, direction: 1, nonlinear: false, noise: 0.4 },
  { name: "Credit utilization", scale: 0.31, direction: 1, nonlinear: true, noise: 0.35 },
  { name: "Late payments (12mo)", scale: 0.27, direction: 1, nonlinear: true, noise: 0.55 },
  { name: "Loan amount", scale: 0.22, direction: 1, nonlinear: false, noise: 0.45 },
  { name: "Annual income", scale: 0.19, direction: -1, nonlinear: false, noise: 0.4 },
  { name: "Employment length", scale: 0.16, direction: -1, nonlinear: false, noise: 0.5 },
  { name: "Open credit accounts", scale: 0.13, direction: 1, nonlinear: false, noise: 0.55 },
  { name: "Recent credit inquiries", scale: 0.11, direction: 1, nonlinear: true, noise: 0.5 },
  { name: "Applicant age", scale: 0.08, direction: -1, nonlinear: false, noise: 0.65 },
  { name: "Loan term (months)", scale: 0.06, direction: 1, nonlinear: false, noise: 0.7 },
  { name: "Home ownership score", scale: 0.05, direction: -1, nonlinear: false, noise: 0.7 },
];

const N_SAMPLES = 220;

const featurePoints = FEATURE_DEFS.map((f) => {
  const shapValues = [];
  for (let s = 0; s < N_SAMPLES; s++) {
    const fv = rng(); // normalized raw feature value in [0, 1], colors the dot
    const centered = (fv - 0.5) * 2; // [-1, 1]
    let effect = f.direction * centered * f.scale;
    if (f.nonlinear) {
      // Kink near the extremes so high/low both push the same direction —
      // the "non-linear relationship" case called out in the specification.
      effect += f.direction * Math.sign(centered) * Math.pow(Math.abs(centered), 2) * f.scale * 0.5;
    }
    const noise = (rng() - 0.5) * f.scale * f.noise;
    shapValues.push({ x: effect + noise, v: fv });
  }
  const meanAbsShap = shapValues.reduce((sum, p) => sum + Math.abs(p.x), 0) / shapValues.length;
  return { name: f.name, meanAbsShap, shapValues };
});

// Rank by mean |SHAP value| (most important first) and keep the top 10.
const topFeatures = featurePoints.sort((a, b) => b.meanAbsShap - a.meanAbsShap).slice(0, 10);
const numFeatures = topFeatures.length;

// Row 0 (bottom) = least important, row numFeatures-1 (top) = most important,
// matching the linear y-scale's natural bottom-to-top ordering. Points are
// jittered vertically around their row to reduce overlap (beeswarm-style).
const points = [];
topFeatures.forEach((feature, rank) => {
  const baseY = numFeatures - 1 - rank;
  feature.shapValues.forEach((p) => {
    const jitter = (rng() - 0.5) * 0.72;
    points.push({ x: p.x, y: baseY + jitter, v: p.v });
  });
});

// --- Color: Imprint diverging scale (blue = low feature value, red = high) --
function hexToRgb(hex) {
  const n = parseInt(hex.slice(1), 16);
  return [(n >> 16) & 255, (n >> 8) & 255, n & 255];
}
function mixHex(hexA, hexB, frac) {
  const [r1, g1, b1] = hexToRgb(hexA);
  const [r2, g2, b2] = hexToRgb(hexB);
  const r = Math.round(r1 + (r2 - r1) * frac);
  const g = Math.round(g1 + (g2 - g1) * frac);
  const b = Math.round(b1 + (b2 - b1) * frac);
  return `rgba(${r}, ${g}, ${b}, 0.82)`;
}
// t.div = [red, midpoint, blue]; low feature value -> blue, high -> red.
function valueToColor(v) {
  return v <= 0.5 ? mixHex(t.div[2], t.div[1], v / 0.5) : mixHex(t.div[1], t.div[0], (v - 0.5) / 0.5);
}

// --- Mount -------------------------------------------------------------------
const canvas = document.createElement("canvas");
document.getElementById("container").appendChild(canvas);

// --- Plugins: zero-impact reference line + feature-value color legend -------
const zeroLinePlugin = {
  id: "zeroLine",
  afterDatasetsDraw(chart) {
    const { ctx, chartArea, scales } = chart;
    const xPix = scales.x.getPixelForValue(0);
    ctx.save();
    ctx.strokeStyle = t.inkSoft;
    ctx.lineWidth = 2;
    ctx.beginPath();
    ctx.moveTo(xPix, chartArea.top);
    ctx.lineTo(xPix, chartArea.bottom);
    ctx.stroke();
    ctx.restore();
  },
};

const colorLegendPlugin = {
  id: "colorLegend",
  afterDraw(chart) {
    const { ctx, chartArea } = chart;
    const barW = 240;
    const barH = 16;
    const x0 = chartArea.right - barW;
    const y0 = chartArea.top - 46;
    const grad = ctx.createLinearGradient(x0, 0, x0 + barW, 0);
    grad.addColorStop(0, t.div[2]);
    grad.addColorStop(0.5, t.div[1]);
    grad.addColorStop(1, t.div[0]);
    ctx.save();
    ctx.fillStyle = grad;
    ctx.fillRect(x0, y0, barW, barH);
    ctx.font = "14px -apple-system, BlinkMacSystemFont, sans-serif";
    ctx.fillStyle = t.inkSoft;
    ctx.textBaseline = "alphabetic";
    ctx.textAlign = "left";
    ctx.fillText("Low", x0, y0 - 6);
    ctx.textAlign = "right";
    ctx.fillText("High", x0 + barW, y0 - 6);
    ctx.textAlign = "center";
    ctx.fillText("Feature value", x0 + barW / 2, y0 + barH + 18);
    ctx.restore();
  },
};

// --- Chart -------------------------------------------------------------------
new Chart(canvas, {
  type: "scatter",
  data: {
    datasets: [
      {
        label: "SHAP value",
        data: points,
        pointBackgroundColor: (ctx) => (ctx.raw ? valueToColor(ctx.raw.v) : t.palette[0]),
        pointBorderWidth: 0,
        pointRadius: 4,
        pointHoverRadius: 4,
      },
    ],
  },
  options: {
    responsive: true,
    maintainAspectRatio: false,
    animation: false,
    layout: { padding: { top: 64, right: 10, bottom: 4, left: 4 } },
    plugins: {
      title: {
        display: true,
        text: "shap-summary · javascript · chartjs · anyplot.ai",
        color: t.ink,
        font: { size: 22 },
        padding: { bottom: 18 },
      },
      legend: { display: false },
      tooltip: {
        callbacks: {
          label: (ctx) => `SHAP ${ctx.parsed.x.toFixed(3)} · feature value ${(ctx.raw.v * 100).toFixed(0)}%`,
        },
      },
    },
    scales: {
      x: {
        type: "linear",
        title: { display: true, text: "SHAP value (impact on model output)", color: t.ink, font: { size: 16 } },
        ticks: { color: t.inkSoft, font: { size: 14 } },
        grid: { color: t.grid },
      },
      y: {
        type: "linear",
        min: -0.75,
        max: numFeatures - 1 + 0.75,
        afterBuildTicks: (axis) => {
          axis.ticks = Array.from({ length: numFeatures }, (_, i) => ({ value: i }));
        },
        ticks: {
          color: t.inkSoft,
          font: { size: 14 },
          callback: (value) => {
            const row = Math.round(value);
            const feature = topFeatures[numFeatures - 1 - row];
            return feature ? feature.name : "";
          },
        },
        grid: { color: t.grid, drawTicks: false },
      },
    },
  },
  plugins: [zeroLinePlugin, colorLegendPlugin],
});
Runnable source as JSON, for any HTTP client: https://api.anyplot.ai/specs/shap-summary/chartjs/code. Any spec id and library id listed in llms-full.txt fit the same URL shape; every URL below is complete and callable.
{
  "spec_id": "shap-summary",
  "language": "javascript",
  "library": "chartjs",
  "page": "https://anyplot.ai/shap-summary/javascript/chartjs",
  "hub": "https://anyplot.ai/shap-summary",
  "code_json": "https://api.anyplot.ai/specs/shap-summary/chartjs/code",
  "spec_json": "https://api.anyplot.ai/specs/shap-summary",
  "render_light_png": "https://storage.googleapis.com/anyplot-images/plots/shap-summary/javascript/chartjs/plot-light.png",
  "render_dark_png": "https://storage.googleapis.com/anyplot-images/plots/shap-summary/javascript/chartjs/plot-dark.png",
  "interactive_light_html": "https://storage.googleapis.com/anyplot-images/plots/shap-summary/javascript/chartjs/plot-light.html",
  "interactive_dark_html": "https://storage.googleapis.com/anyplot-images/plots/shap-summary/javascript/chartjs/plot-dark.html",
  "quality_score": 90.0,
  "license": "MIT",
  "guide": "https://anyplot.ai/llms.txt"
}
Part of SHAP Summary Plot on anyplot.ai.