The same plot in 14 other libraries — JavaScript: Chart.js, D3.js, Highcharts, MUI X Charts; Python: Altair, Bokeh, lets-plot, Matplotlib, Plotly, plotnine, Pygal, Seaborn; R: ggplot2; Julia: Makie.jl. Compare all 15 side by side: SHAP Summary Plot in Python, R, Julia and JavaScript.
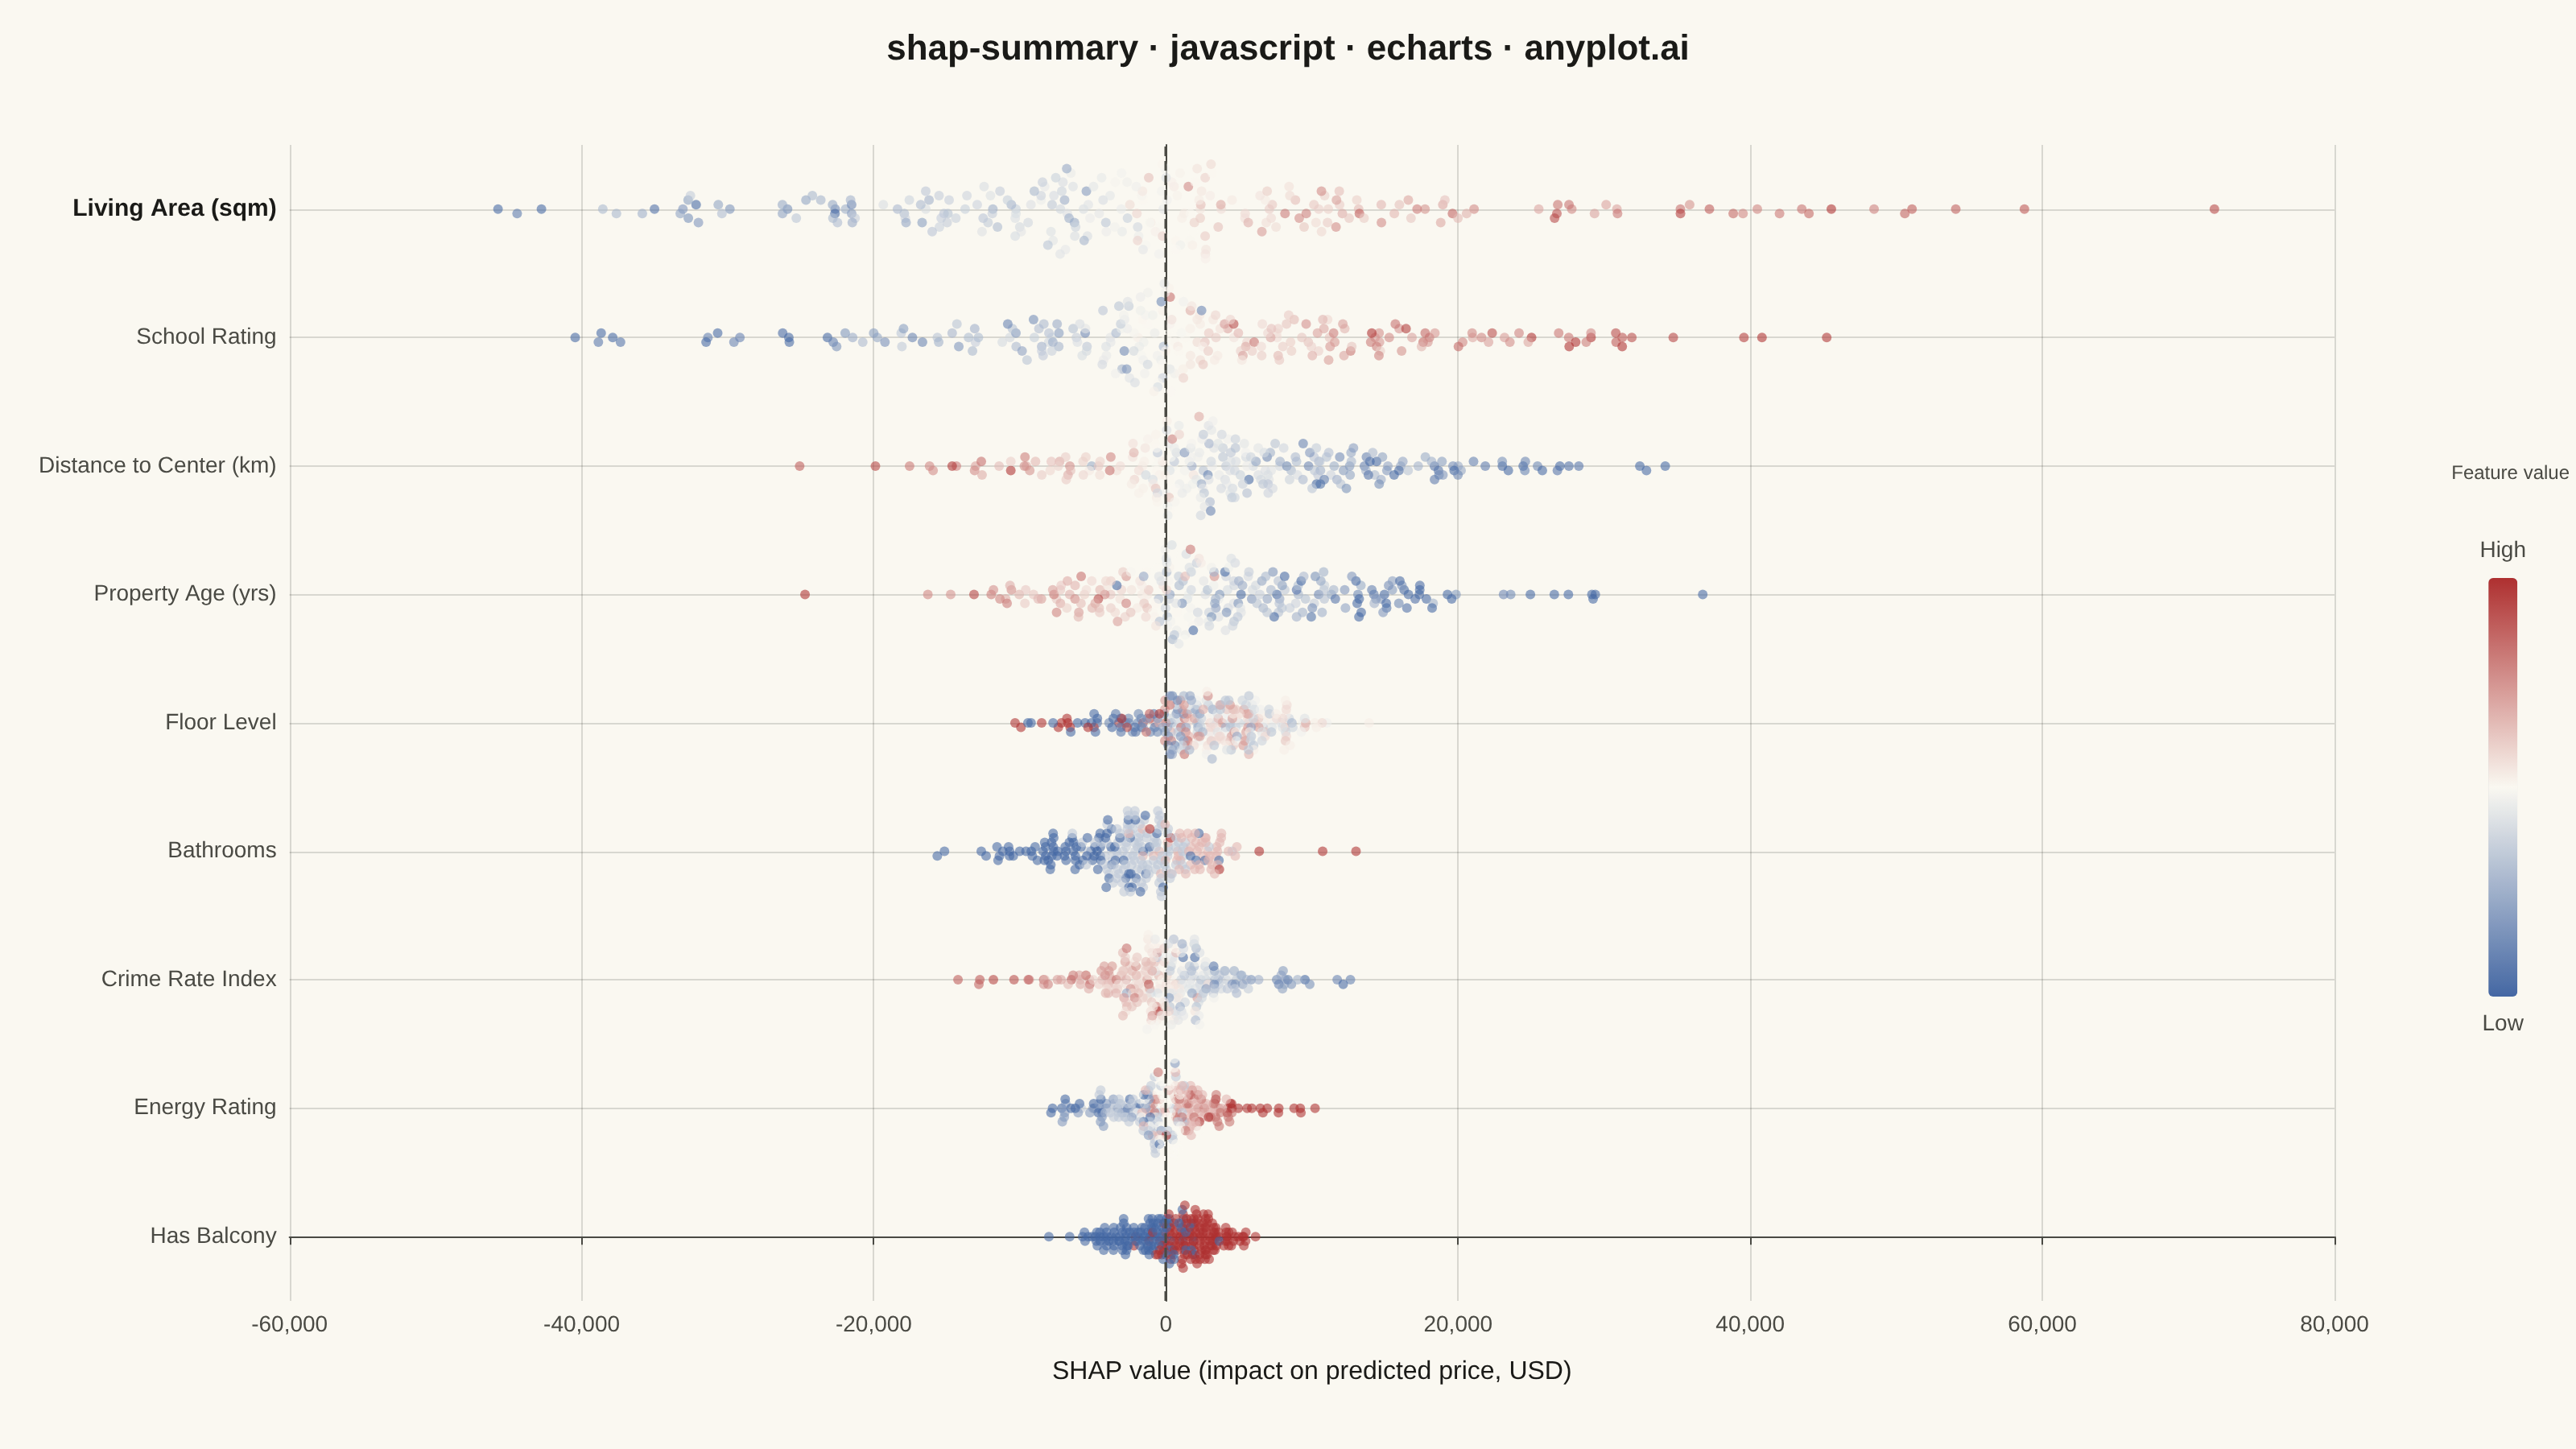
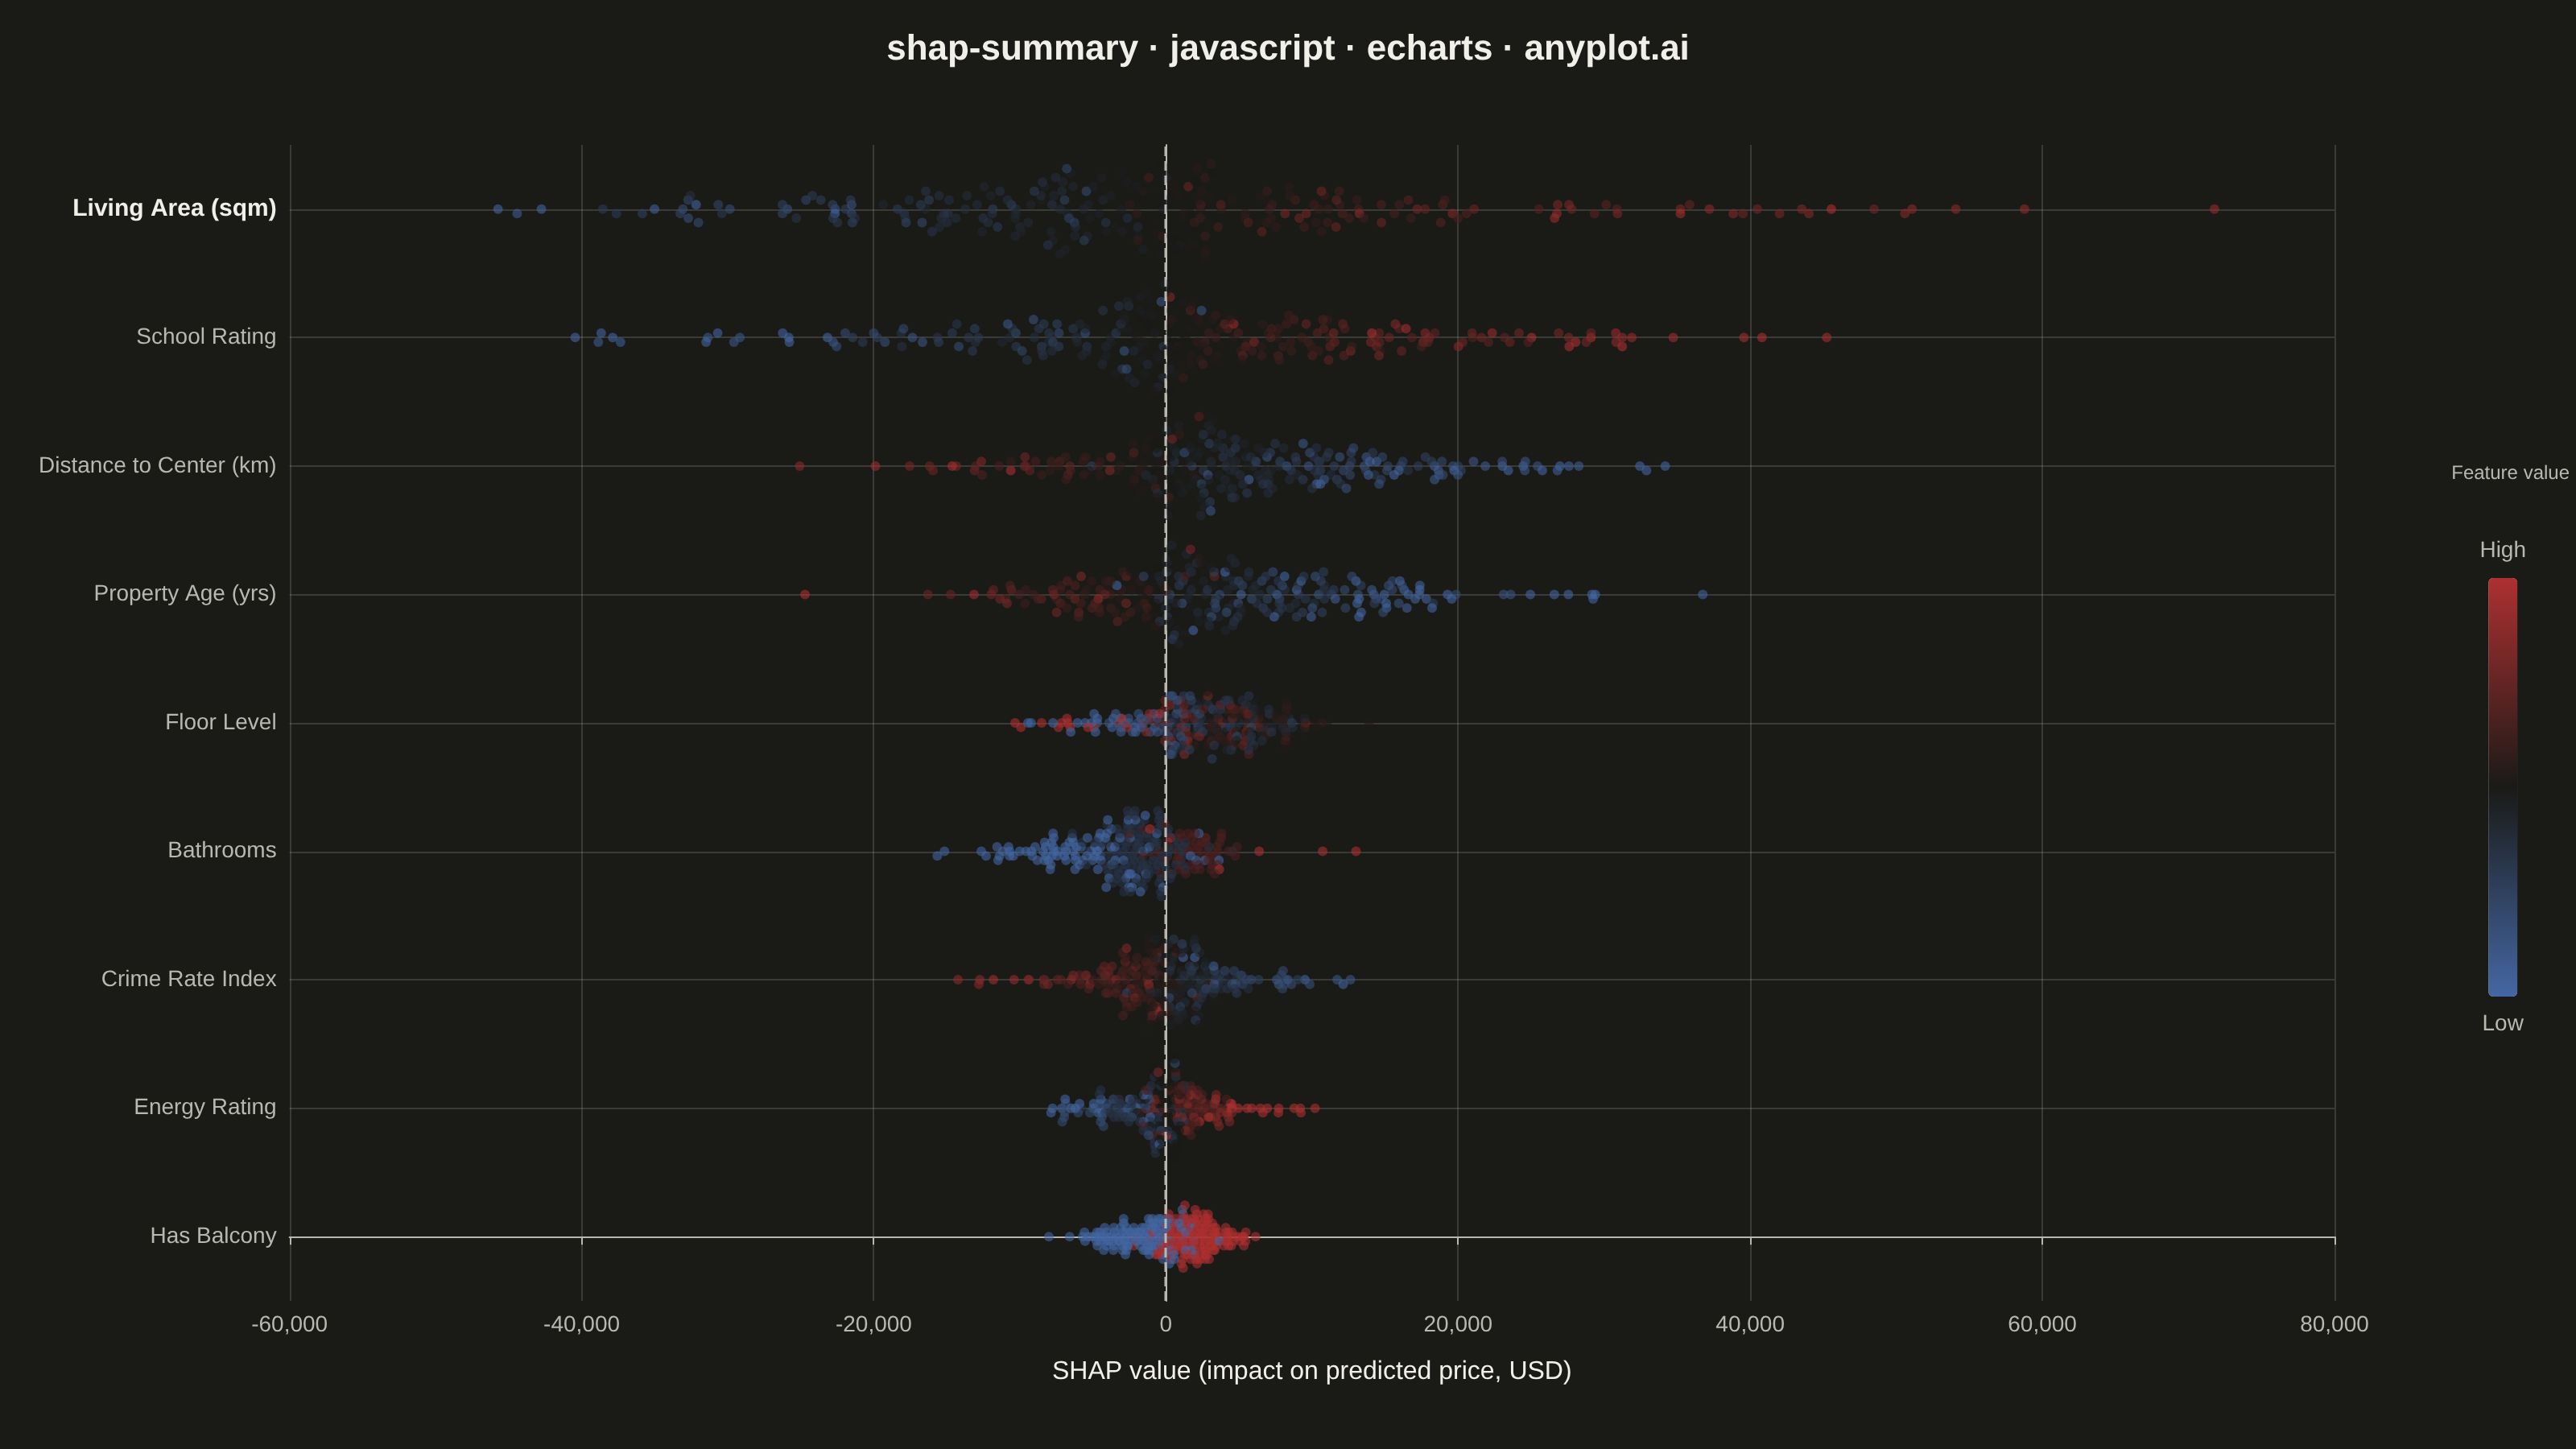
A SHAP (SHapley Additive exPlanations) summary plot displaying the distribution of SHAP values for each feature, ordered by mean absolute SHAP value (importance). Each dot represents a sample, positioned horizontally by its SHAP value and colored by the feature's value (typically low=blue to high=red). This visualization is essential for machine learning interpretability, showing both feature importance and the direction and magnitude of feature effects on model predictions.
// anyplot.ai
// shap-summary: SHAP Summary Plot
// Library: echarts 6.1.0 | JavaScript 22.23.2
// Quality: 93/100 | Created: 2026-09-09

//# anyplot-orientation: landscape
const t = window.ANYPLOT_TOKENS;

// --- Deterministic PRNG (LCG + Box-Muller) ----------------------------------
let seed = 42;
const rand = () => {
  seed = (seed * 1103515245 + 12345) & 0x7fffffff;
  return seed / 0x7fffffff;
};
const randNormal = () => {
  const u1 = Math.max(rand(), 1e-9);
  const u2 = rand();
  return Math.sqrt(-2 * Math.log(u1)) * Math.cos(2 * Math.PI * u2);
};
const clip = (v, lo, hi) => Math.min(hi, Math.max(lo, v));

// --- Data: SHAP explanations for a house-price model ------------------------
// Each feature has a raw generator and a shap() function of its own
// min-max-normalized value (0=low, 1=high) that defines its effect on the
// predicted price. Floor Level is deliberately non-linear: both very low and
// very high floors hurt the price, mid floors help it.
const N_SAMPLES = 260;

const featureDefs = [
  { label: "Living Area (sqm)", gen: () => clip(100 + randNormal() * 32, 32, 210), shap: (n) => 42000 * (n - 0.5) * 2 },
  { label: "School Rating", gen: () => clip(5.5 + randNormal() * 2.2, 1, 10), shap: (n) => 27000 * (n - 0.5) * 2 },
  { label: "Distance to Center (km)", gen: () => clip(8 + randNormal() * 4.5, 0.4, 26), shap: (n) => -22000 * (n - 0.5) * 2 },
  { label: "Property Age (yrs)", gen: () => clip(30 + randNormal() * 22, 0, 90), shap: (n) => -16000 * (n - 0.5) * 2 },
  { label: "Floor Level", gen: () => Math.round(clip(9 + randNormal() * 5.5, 0, 19)), shap: (n) => 11500 * (1 - 4 * (n - 0.5) * (n - 0.5)) - 5750 },
  { label: "Crime Rate Index", gen: () => clip(48 + randNormal() * 19, 2, 98), shap: (n) => -8800 * (n - 0.5) * 2 },
  { label: "Bathrooms", gen: () => Math.round(clip(1.8 + randNormal() * 0.9, 1, 4)), shap: (n) => 6200 * (n - 0.5) * 2 },
  { label: "Energy Rating", gen: () => Math.round(clip(4 + randNormal() * 1.8, 1, 7)), shap: (n) => 4600 * (n - 0.5) * 2 },
  { label: "Has Balcony", gen: () => (rand() < 0.55 ? 1 : 0), shap: (n) => 2100 * (n - 0.5) * 2 },
];

const rawValues = featureDefs.map((f) => Array.from({ length: N_SAMPLES }, f.gen));

const normValues = rawValues.map((vals) => {
  const lo = Math.min(...vals);
  const hi = Math.max(...vals);
  const span = hi - lo || 1;
  return vals.map((v) => (v - lo) / span);
});

const shapValues = featureDefs.map((f, fi) =>
  normValues[fi].map((n) => f.shap(n) + randNormal() * (Math.abs(f.shap(n)) * 0.4 + 900))
);

const meanAbsShap = shapValues.map((vals) => vals.reduce((a, v) => a + Math.abs(v), 0) / vals.length);

// Most important feature at the top: rank descending, then reverse so index 0
// (bottom of the value-axis) is the least important feature.
const displayOrder = featureDefs
  .map((_, i) => i)
  .sort((a, b) => meanAbsShap[b] - meanAbsShap[a])
  .reverse();

const featureLabels = displayOrder.map((i) => featureDefs[i].label);
const rowIndices = featureLabels.map((_, i) => i);

// --- Vertical jitter (binned beeswarm approximation) ------------------------
const jitter = (vals, rowHalfWidth) => {
  const nBins = 50;
  const lo = Math.min(...vals);
  const hi = Math.max(...vals);
  const binWidth = (hi - lo) / nBins || 1;
  const counts = new Array(nBins).fill(0);
  const step = 0.035;
  return vals.map((v) => {
    const b = clip(Math.floor((v - lo) / binWidth), 0, nBins - 1);
    const k = counts[b]++;
    const dir = k % 2 === 0 ? 1 : -1;
    const mag = Math.ceil(k / 2);
    return clip(dir * mag * step, -rowHalfWidth, rowHalfWidth);
  });
};

const points = [];
displayOrder.forEach((fi, row) => {
  const offsets = jitter(shapValues[fi], 0.42);
  shapValues[fi].forEach((x, si) => {
    points.push([x, row + offsets[si], normValues[fi][si]]);
  });
});

// --- Init --------------------------------------------------------------------
const chart = echarts.init(document.getElementById("container"));

// --- Option --------------------------------------------------------------------
chart.setOption({
  animation: false,
  backgroundColor: "transparent",
  title: {
    text: "shap-summary · javascript · echarts · anyplot.ai",
    left: "center",
    textStyle: { color: t.ink, fontSize: 22 },
  },
  grid: { left: 24, right: 150, top: 90, bottom: 70, containLabel: true },
  xAxis: {
    type: "value",
    name: "SHAP value (impact on predicted price, USD)",
    nameLocation: "middle",
    nameGap: 36,
    nameTextStyle: { color: t.ink, fontSize: 16 },
    axisLabel: { color: t.inkSoft, fontSize: 14 },
    axisLine: { lineStyle: { color: t.inkSoft } },
    splitLine: { lineStyle: { color: t.grid } },
  },
  yAxis: {
    type: "value",
    min: -0.5,
    max: featureLabels.length - 0.5,
    axisLabel: {
      color: t.inkSoft,
      fontSize: 14,
      customValues: rowIndices,
      // Bold + slightly larger label draws the eye to the single most impactful
      // feature (topmost row) to sharpen the importance-ordering story.
      formatter: (v) => (v === rowIndices.length - 1 ? `{top|${featureLabels[v]}}` : featureLabels[v]),
      rich: { top: { color: t.ink, fontWeight: "bold", fontSize: 15 } },
    },
    axisTick: { show: false, customValues: rowIndices },
    axisLine: { lineStyle: { color: t.inkSoft } },
    splitLine: { customValues: rowIndices, lineStyle: { color: t.grid } },
  },
  visualMap: {
    type: "continuous",
    dimension: 2,
    min: 0,
    max: 1,
    calculable: false,
    right: 16,
    top: 320,
    itemWidth: 18,
    itemHeight: 260,
    text: ["High", "Low"],
    textGap: 10,
    textStyle: { color: t.inkSoft, fontSize: 14 },
    inRange: { color: ["#4467A3", t.pageBg, "#AE3030"] },
  },
  graphic: {
    elements: [
      {
        type: "text",
        right: 4,
        top: 288,
        style: { text: "Feature value", fill: t.inkSoft, fontSize: 12, fontWeight: 500, align: "right" },
      },
    ],
  },
  series: [
    {
      type: "scatter",
      data: points,
      symbolSize: 6,
      itemStyle: { opacity: 0.58 },
      markLine: {
        silent: true,
        symbol: "none",
        label: { show: false },
        lineStyle: { color: t.inkSoft, type: "dashed", width: 1.5 },
        data: [{ xAxis: 0 }],
      },
    },
  ],
});
Runnable source as JSON, for any HTTP client: https://api.anyplot.ai/specs/shap-summary/echarts/code. Any spec id and library id listed in llms-full.txt fit the same URL shape; every URL below is complete and callable.
{
  "spec_id": "shap-summary",
  "language": "javascript",
  "library": "echarts",
  "page": "https://anyplot.ai/shap-summary/javascript/echarts",
  "hub": "https://anyplot.ai/shap-summary",
  "code_json": "https://api.anyplot.ai/specs/shap-summary/echarts/code",
  "spec_json": "https://api.anyplot.ai/specs/shap-summary",
  "render_light_png": "https://storage.googleapis.com/anyplot-images/plots/shap-summary/javascript/echarts/plot-light.png",
  "render_dark_png": "https://storage.googleapis.com/anyplot-images/plots/shap-summary/javascript/echarts/plot-dark.png",
  "interactive_light_html": "https://storage.googleapis.com/anyplot-images/plots/shap-summary/javascript/echarts/plot-light.html",
  "interactive_dark_html": "https://storage.googleapis.com/anyplot-images/plots/shap-summary/javascript/echarts/plot-dark.html",
  "quality_score": 93.0,
  "license": "MIT",
  "guide": "https://anyplot.ai/llms.txt"
}
Part of SHAP Summary Plot on anyplot.ai.