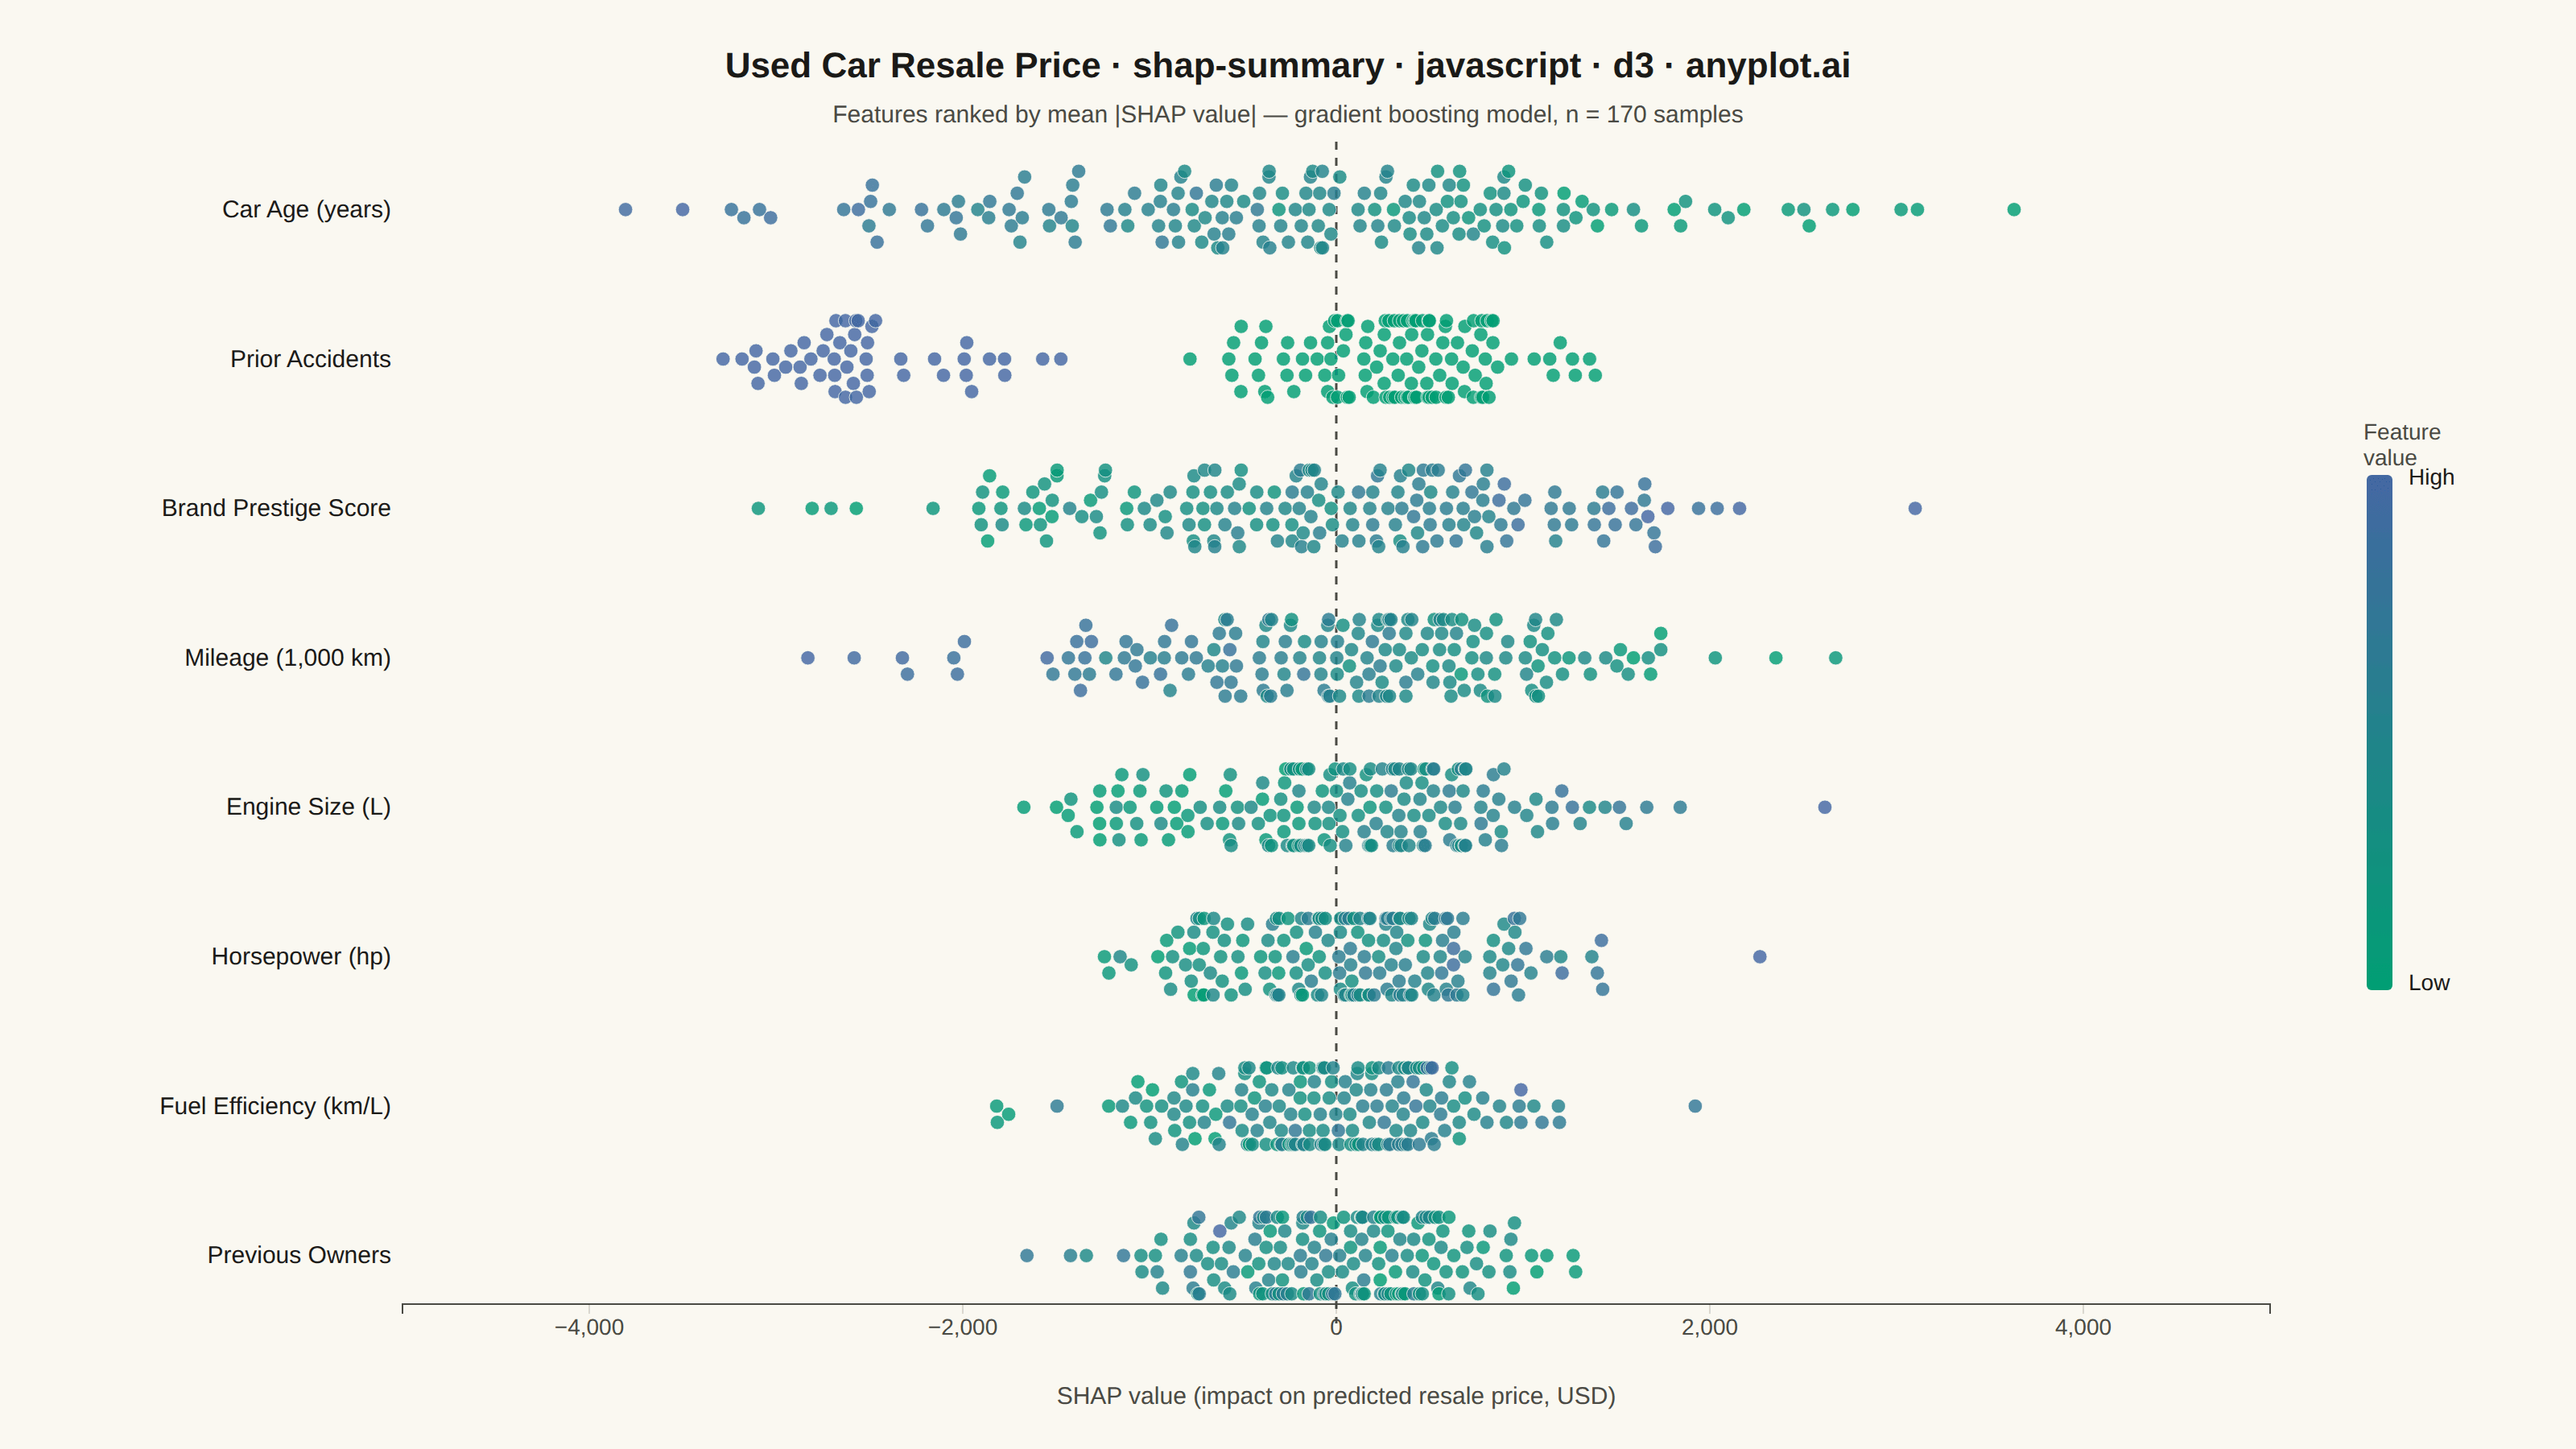
The same plot in 14 other libraries — JavaScript: Chart.js, Apache ECharts, Highcharts, MUI X Charts; Python: Altair, Bokeh, lets-plot, Matplotlib, Plotly, plotnine, Pygal, Seaborn; R: ggplot2; Julia: Makie.jl. Compare all 15 side by side: SHAP Summary Plot in Python, R, Julia and JavaScript.
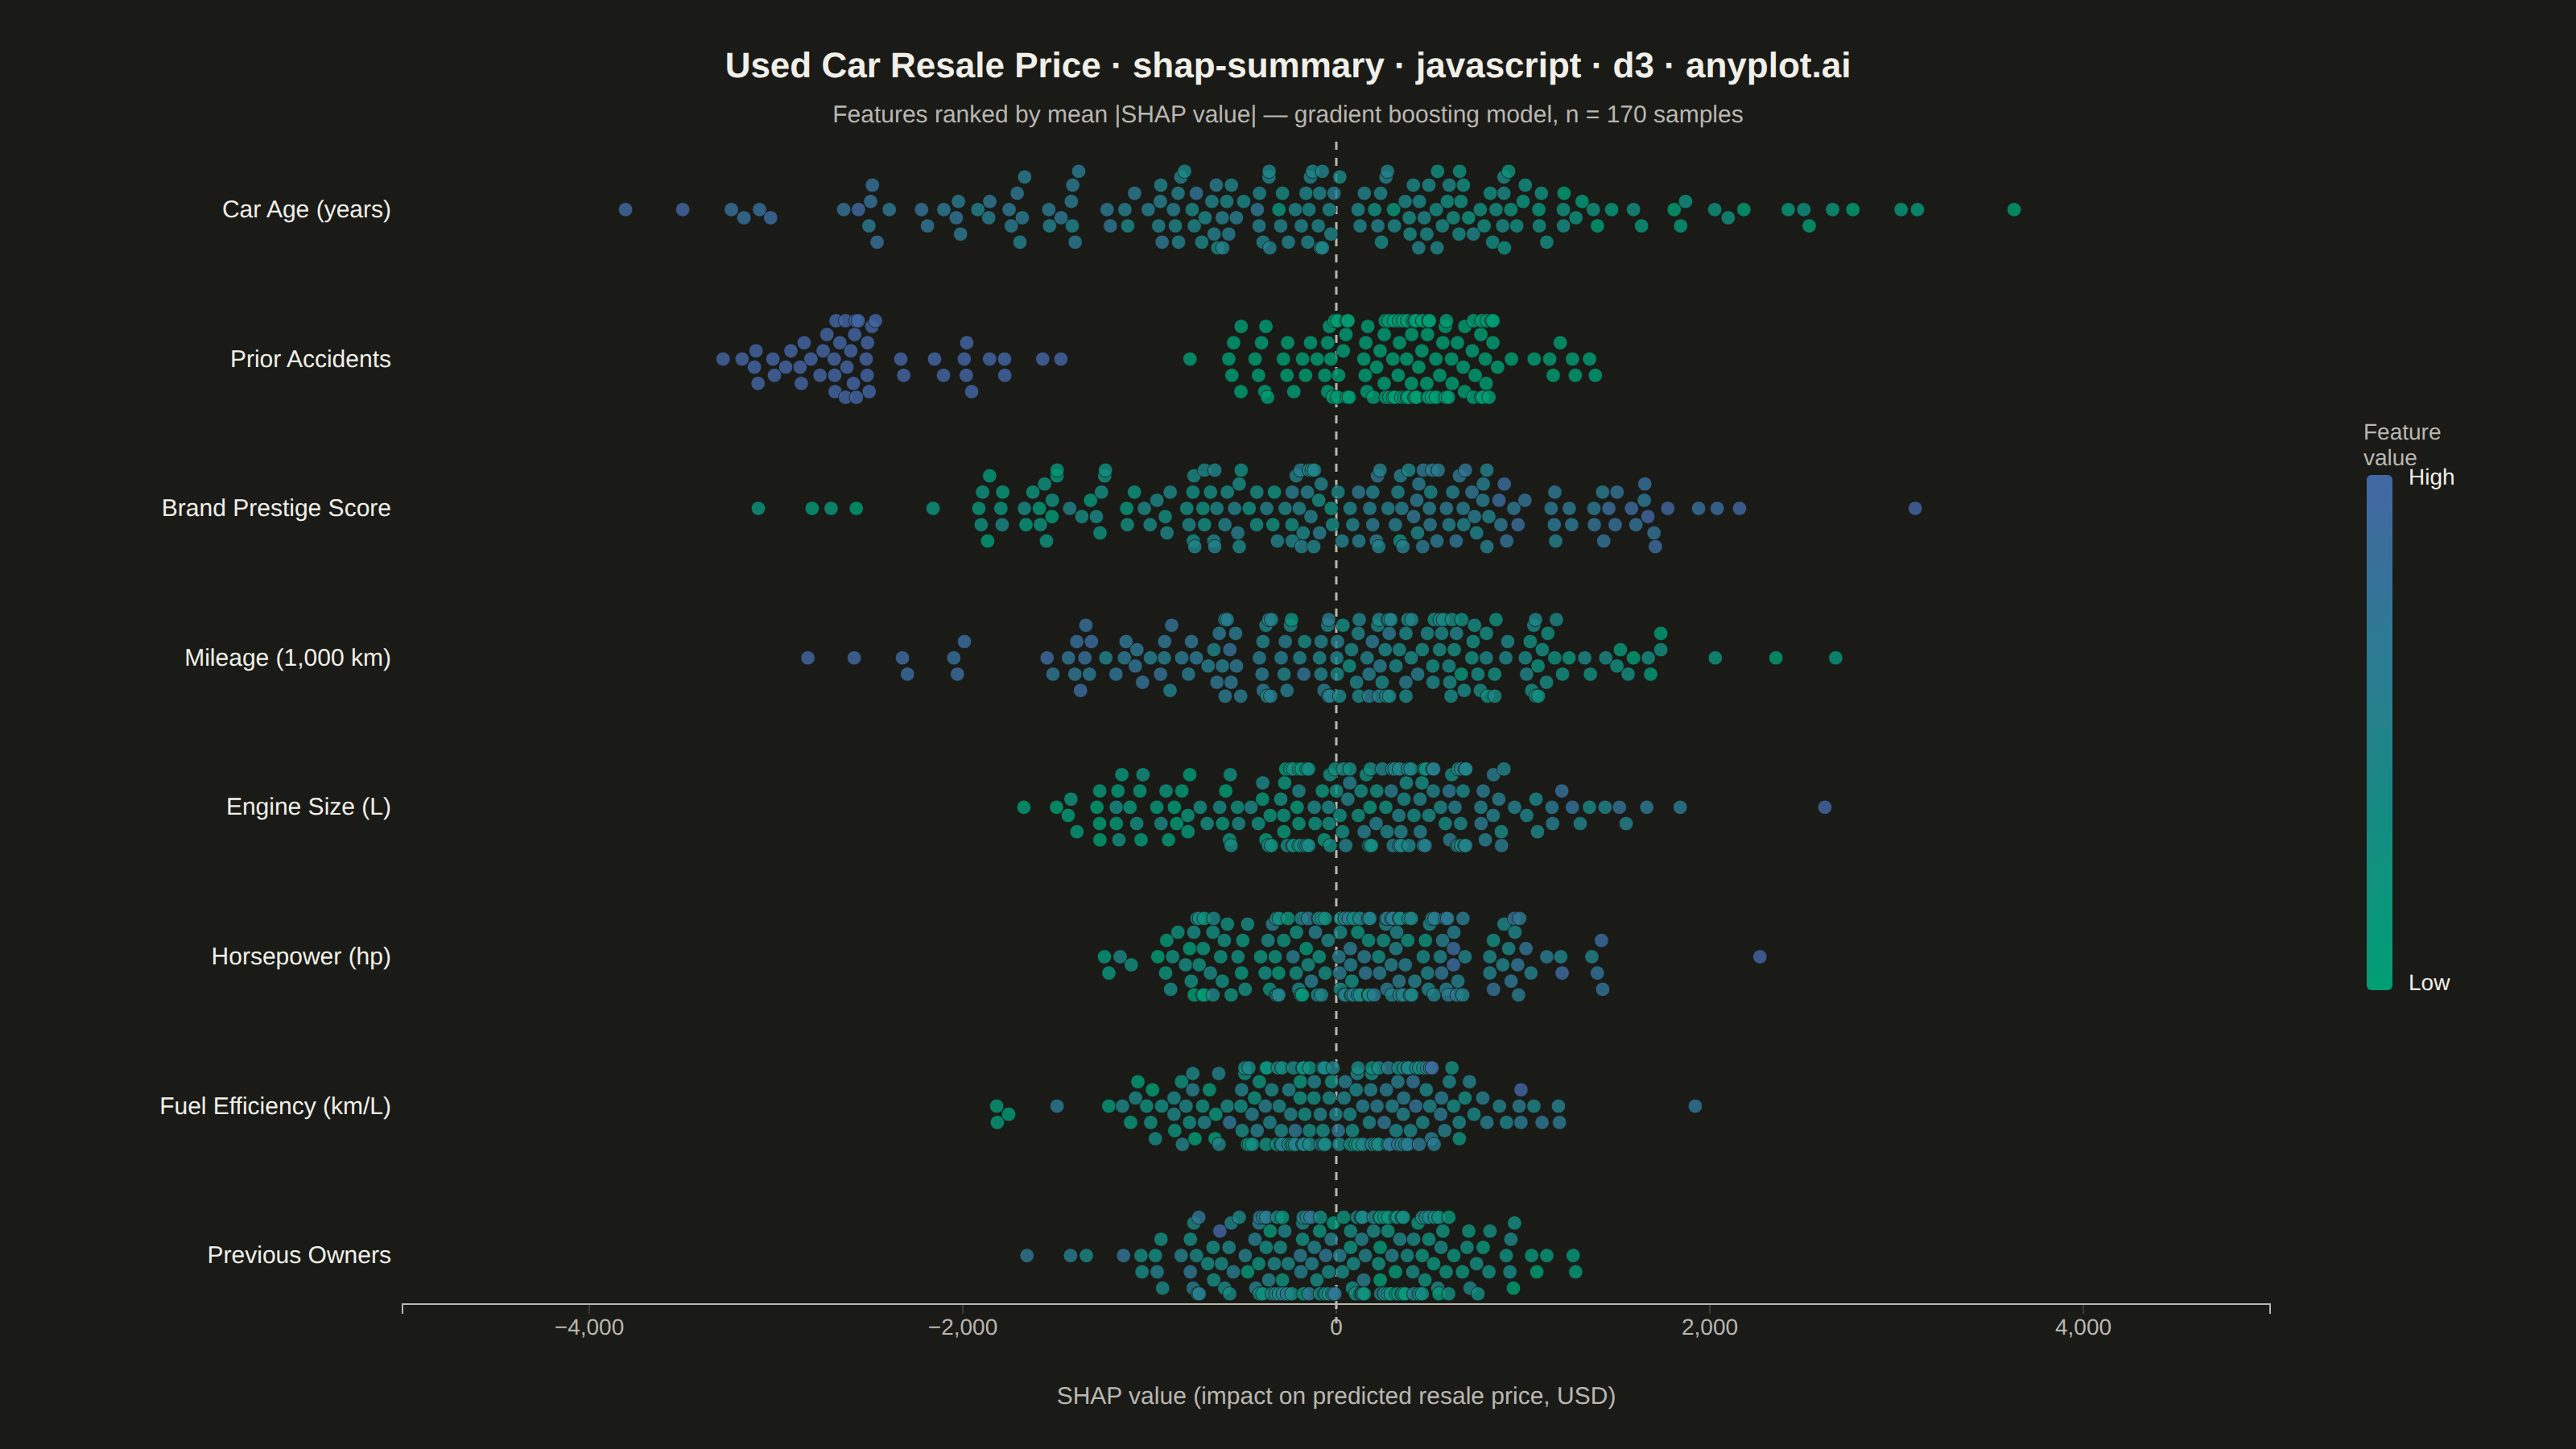
A SHAP (SHapley Additive exPlanations) summary plot displaying the distribution of SHAP values for each feature, ordered by mean absolute SHAP value (importance). Each dot represents a sample, positioned horizontally by its SHAP value and colored by the feature's value (typically low=blue to high=red). This visualization is essential for machine learning interpretability, showing both feature importance and the direction and magnitude of feature effects on model predictions.
// anyplot.ai
// shap-summary: SHAP Summary Plot
// Library: d3 7.9.0 | JavaScript 22.23.2
// Quality: 92/100 | Created: 2026-09-09

const t = window.ANYPLOT_TOKENS;
const { width, height } = window.ANYPLOT_SIZE;
const margin = { top: 100, right: 190, bottom: 90, left: 250 };
const iw = width - margin.left - margin.right;
const ih = height - margin.top - margin.bottom;

// --- Deterministic PRNG (LCG + Box-Muller) -----------------------------------
let seed = 42;
function rand() {
  seed = (seed * 1103515245 + 12345) & 0x7fffffff;
  return seed / 0x7fffffff;
}
function randNorm() {
  const u1 = Math.max(rand(), 1e-9);
  const u2 = rand();
  return Math.sqrt(-2 * Math.log(u1)) * Math.cos(2 * Math.PI * u2);
}

// --- Data: SHAP values explaining a used-car resale-price model -------------
// Each feature has a raw value distribution and a linear-ish relationship to
// its SHAP contribution (impact on predicted price, USD), plus noise so the
// swarm shows realistic spread rather than a clean line.
const N_SAMPLES = 170;

const featureSpecs = [
  { label: "Mileage (1,000 km)", mean: 65, sd: 26, min: 5, slope: -34, noiseSd: 480 },
  { label: "Car Age (years)", mean: 6, sd: 3.2, min: 0, slope: -410, noiseSd: 560 },
  { label: "Prior Accidents", mean: 0.28, sd: 0.45, min: 0, max: 1, binary: true, effectTrue: -2550, effectFalse: 380, noiseSd: 430 },
  { label: "Engine Size (L)", mean: 2.2, sd: 0.7, min: 1.0, slope: 940, noiseSd: 470 },
  { label: "Brand Prestige Score", mean: 5.5, sd: 2.0, min: 1, max: 10, slope: 470, noiseSd: 510 },
  { label: "Horsepower (hp)", mean: 180, sd: 55, min: 70, slope: 8.6, noiseSd: 460 },
  { label: "Fuel Efficiency (km/L)", mean: 14, sd: 3.4, min: 5, slope: 90, noiseSd: 520 },
  { label: "Previous Owners", mean: 2.1, sd: 1.1, min: 0, max: 6, slope: -240, noiseSd: 480 },
];

const features = featureSpecs.map((spec) => {
  const values = [];
  const shaps = [];
  for (let i = 0; i < N_SAMPLES; i++) {
    let value;
    let shap;
    if (spec.binary) {
      value = rand() < spec.mean ? 1 : 0;
      shap = (value ? spec.effectTrue : spec.effectFalse) + randNorm() * spec.noiseSd;
    } else {
      value = spec.mean + randNorm() * spec.sd;
      if (spec.min !== undefined) value = Math.max(spec.min, value);
      if (spec.max !== undefined) value = Math.min(spec.max, value);
      shap = spec.slope * (value - spec.mean) + randNorm() * spec.noiseSd;
    }
    values.push(value);
    shaps.push(shap);
  }
  const vMin = d3.min(values);
  const vMax = d3.max(values);
  const meanAbsShap = d3.mean(shaps, (s) => Math.abs(s));
  return {
    label: spec.label,
    samples: values.map((value, i) => ({
      value,
      shap: shaps[i],
      norm: vMax > vMin ? (value - vMin) / (vMax - vMin) : 0.5,
    })),
    meanAbsShap,
  };
});

// Most important feature first (top row).
features.sort((a, b) => b.meanAbsShap - a.meanAbsShap);

// --- Scales -------------------------------------------------------------------
const allShaps = features.flatMap((f) => f.samples.map((s) => s.shap));
const shapExtent = d3.extent(allShaps);
const shapPad = (shapExtent[1] - shapExtent[0]) * 0.06;
const x = d3.scaleLinear()
  .domain([shapExtent[0] - shapPad, shapExtent[1] + shapPad])
  .nice()
  .range([0, iw]);

const y = d3.scaleBand()
  .domain(features.map((f) => f.label))
  .range([0, ih])
  .paddingInner(0.35);

const colorFor = d3.interpolateRgbBasis(t.seq); // low = brand green, high = blue

// --- SVG mount ------------------------------------------------------------
const svg = d3.select("#container").append("svg").attr("width", width).attr("height", height);

// Feature-value color legend gradient (defined once, used by the legend bar).
const grad = svg.append("defs").append("linearGradient")
  .attr("id", "shap-value-gradient")
  .attr("x1", "0%").attr("y1", "100%").attr("x2", "0%").attr("y2", "0%");
d3.range(0, 1.0001, 0.1).forEach((p) => {
  grad.append("stop").attr("offset", `${p * 100}%`).attr("stop-color", colorFor(p));
});

const g = svg.append("g").attr("transform", `translate(${margin.left},${margin.top})`);

// --- Zero reference line -----------------------------------------------------
g.append("line")
  .attr("x1", x(0)).attr("x2", x(0))
  .attr("y1", -12).attr("y2", ih + 12)
  .attr("stroke", t.inkSoft)
  .attr("stroke-width", 1.5)
  .attr("stroke-dasharray", "5,5");

// --- Beeswarm rows ------------------------------------------------------------
const rowH = y.bandwidth();
const radius = 4.4;
const halfSpan = rowH / 2 - radius - 2;
const step = radius * 1.15;
const maxSteps = Math.max(1, Math.floor(halfSpan / step));

function layoutSwarm(samples) {
  // Greedy 1-D beeswarm: place points ordered by x, nudging each vertically
  // away from the row centerline until it clears every already-placed point.
  const withX = samples.map((s) => ({ ...s, px: x(s.shap) })).sort((a, b) => a.px - b.px);
  const placed = [];
  for (const p of withX) {
    let chosen = 0;
    let found = false;
    for (let k = 0; k <= maxSteps && !found; k++) {
      const candidates = k === 0 ? [0] : [k * step, -k * step];
      for (const dy of candidates) {
        const clash = placed.some((q) => {
          const dx = q.px - p.px;
          const ddy = q.dy - dy;
          return Math.sqrt(dx * dx + ddy * ddy) < radius * 2 - 0.4;
        });
        if (!clash) {
          chosen = dy;
          found = true;
          break;
        }
      }
    }
    p.dy = found ? chosen : (halfSpan * (placed.length % 2 === 0 ? 1 : -1));
    placed.push(p);
  }
  return placed;
}

const rows = g.selectAll(".feature-row")
  .data(features)
  .join("g")
  .attr("class", "feature-row")
  .attr("transform", (f) => `translate(0,${y(f.label) + rowH / 2})`);

rows.each(function (f) {
  const points = layoutSwarm(f.samples);
  d3.select(this)
    .selectAll("circle")
    .data(points)
    .join("circle")
    .attr("cx", (p) => p.px)
    .attr("cy", (p) => p.dy)
    .attr("r", radius)
    .attr("fill", (p) => colorFor(p.norm))
    .attr("fill-opacity", 0.82)
    .attr("stroke", t.pageBg)
    .attr("stroke-width", 0.4);
});

// --- Axes ---------------------------------------------------------------------
const xAxis = g.append("g")
  .attr("transform", `translate(0,${ih})`)
  .call(d3.axisBottom(x).ticks(7).tickSize(6));
xAxis.selectAll("text").attr("fill", t.inkSoft).style("font-size", "14px");
xAxis.selectAll("line").attr("stroke", t.grid);
xAxis.select(".domain").attr("stroke", t.inkSoft);

const yAxis = g.append("g").call(d3.axisLeft(y).tickSize(0));
yAxis.select(".domain").remove();
yAxis.selectAll("text")
  .attr("fill", t.ink)
  .style("font-size", "15px")
  .attr("dx", "-4px");

g.append("text")
  .attr("x", iw / 2)
  .attr("y", ih + 62)
  .attr("text-anchor", "middle")
  .attr("fill", t.inkSoft)
  .style("font-size", "15px")
  .text("SHAP value (impact on predicted resale price, USD)");

// --- Color legend (feature value: low -> high) --------------------------------
const legendX = iw + 60;
const legendH = Math.min(ih * 0.55, 320);
const legendY = (ih - legendH) / 2;

g.append("rect")
  .attr("x", legendX).attr("y", legendY)
  .attr("width", 16).attr("height", legendH)
  .attr("fill", "url(#shap-value-gradient)")
  .attr("rx", 3);

g.append("text")
  .attr("x", legendX + 26).attr("y", legendY + 6)
  .attr("fill", t.ink)
  .style("font-size", "14px")
  .text("High");

g.append("text")
  .attr("x", legendX + 26).attr("y", legendY + legendH)
  .attr("fill", t.ink)
  .style("font-size", "14px")
  .text("Low");

g.append("text")
  .attr("x", legendX - 2).attr("y", legendY - 22)
  .attr("fill", t.inkSoft)
  .style("font-size", "14px")
  .text("Feature");
g.append("text")
  .attr("x", legendX - 2).attr("y", legendY - 6)
  .attr("fill", t.inkSoft)
  .style("font-size", "14px")
  .text("value");

// --- Title ----------------------------------------------------------------
svg.append("text")
  .attr("x", width / 2).attr("y", 48)
  .attr("text-anchor", "middle")
  .attr("fill", t.ink)
  .style("font-size", "22px")
  .style("font-weight", "600")
  .text("Used Car Resale Price · shap-summary · javascript · d3 · anyplot.ai");

svg.append("text")
  .attr("x", width / 2).attr("y", 76)
  .attr("text-anchor", "middle")
  .attr("fill", t.inkSoft)
  .style("font-size", "15px")
  .text("Features ranked by mean |SHAP value| — gradient boosting model, n = " + N_SAMPLES + " samples");
Runnable source as JSON, for any HTTP client: https://api.anyplot.ai/specs/shap-summary/d3/code. Any spec id and library id listed in llms-full.txt fit the same URL shape; every URL below is complete and callable.
{
  "spec_id": "shap-summary",
  "language": "javascript",
  "library": "d3",
  "page": "https://anyplot.ai/shap-summary/javascript/d3",
  "hub": "https://anyplot.ai/shap-summary",
  "code_json": "https://api.anyplot.ai/specs/shap-summary/d3/code",
  "spec_json": "https://api.anyplot.ai/specs/shap-summary",
  "render_light_png": "https://storage.googleapis.com/anyplot-images/plots/shap-summary/javascript/d3/plot-light.png",
  "render_dark_png": "https://storage.googleapis.com/anyplot-images/plots/shap-summary/javascript/d3/plot-dark.png",
  "interactive_light_html": "https://storage.googleapis.com/anyplot-images/plots/shap-summary/javascript/d3/plot-light.html",
  "interactive_dark_html": "https://storage.googleapis.com/anyplot-images/plots/shap-summary/javascript/d3/plot-dark.html",
  "quality_score": 92.0,
  "license": "MIT",
  "guide": "https://anyplot.ai/llms.txt"
}
Part of SHAP Summary Plot on anyplot.ai.