The same plot in 14 other libraries — JavaScript: Chart.js, D3.js, Apache ECharts, Highcharts; Python: Altair, Bokeh, lets-plot, Matplotlib, Plotly, plotnine, Pygal, Seaborn; R: ggplot2; Julia: Makie.jl. Compare all 15 side by side: SHAP Summary Plot in Python, R, Julia and JavaScript.
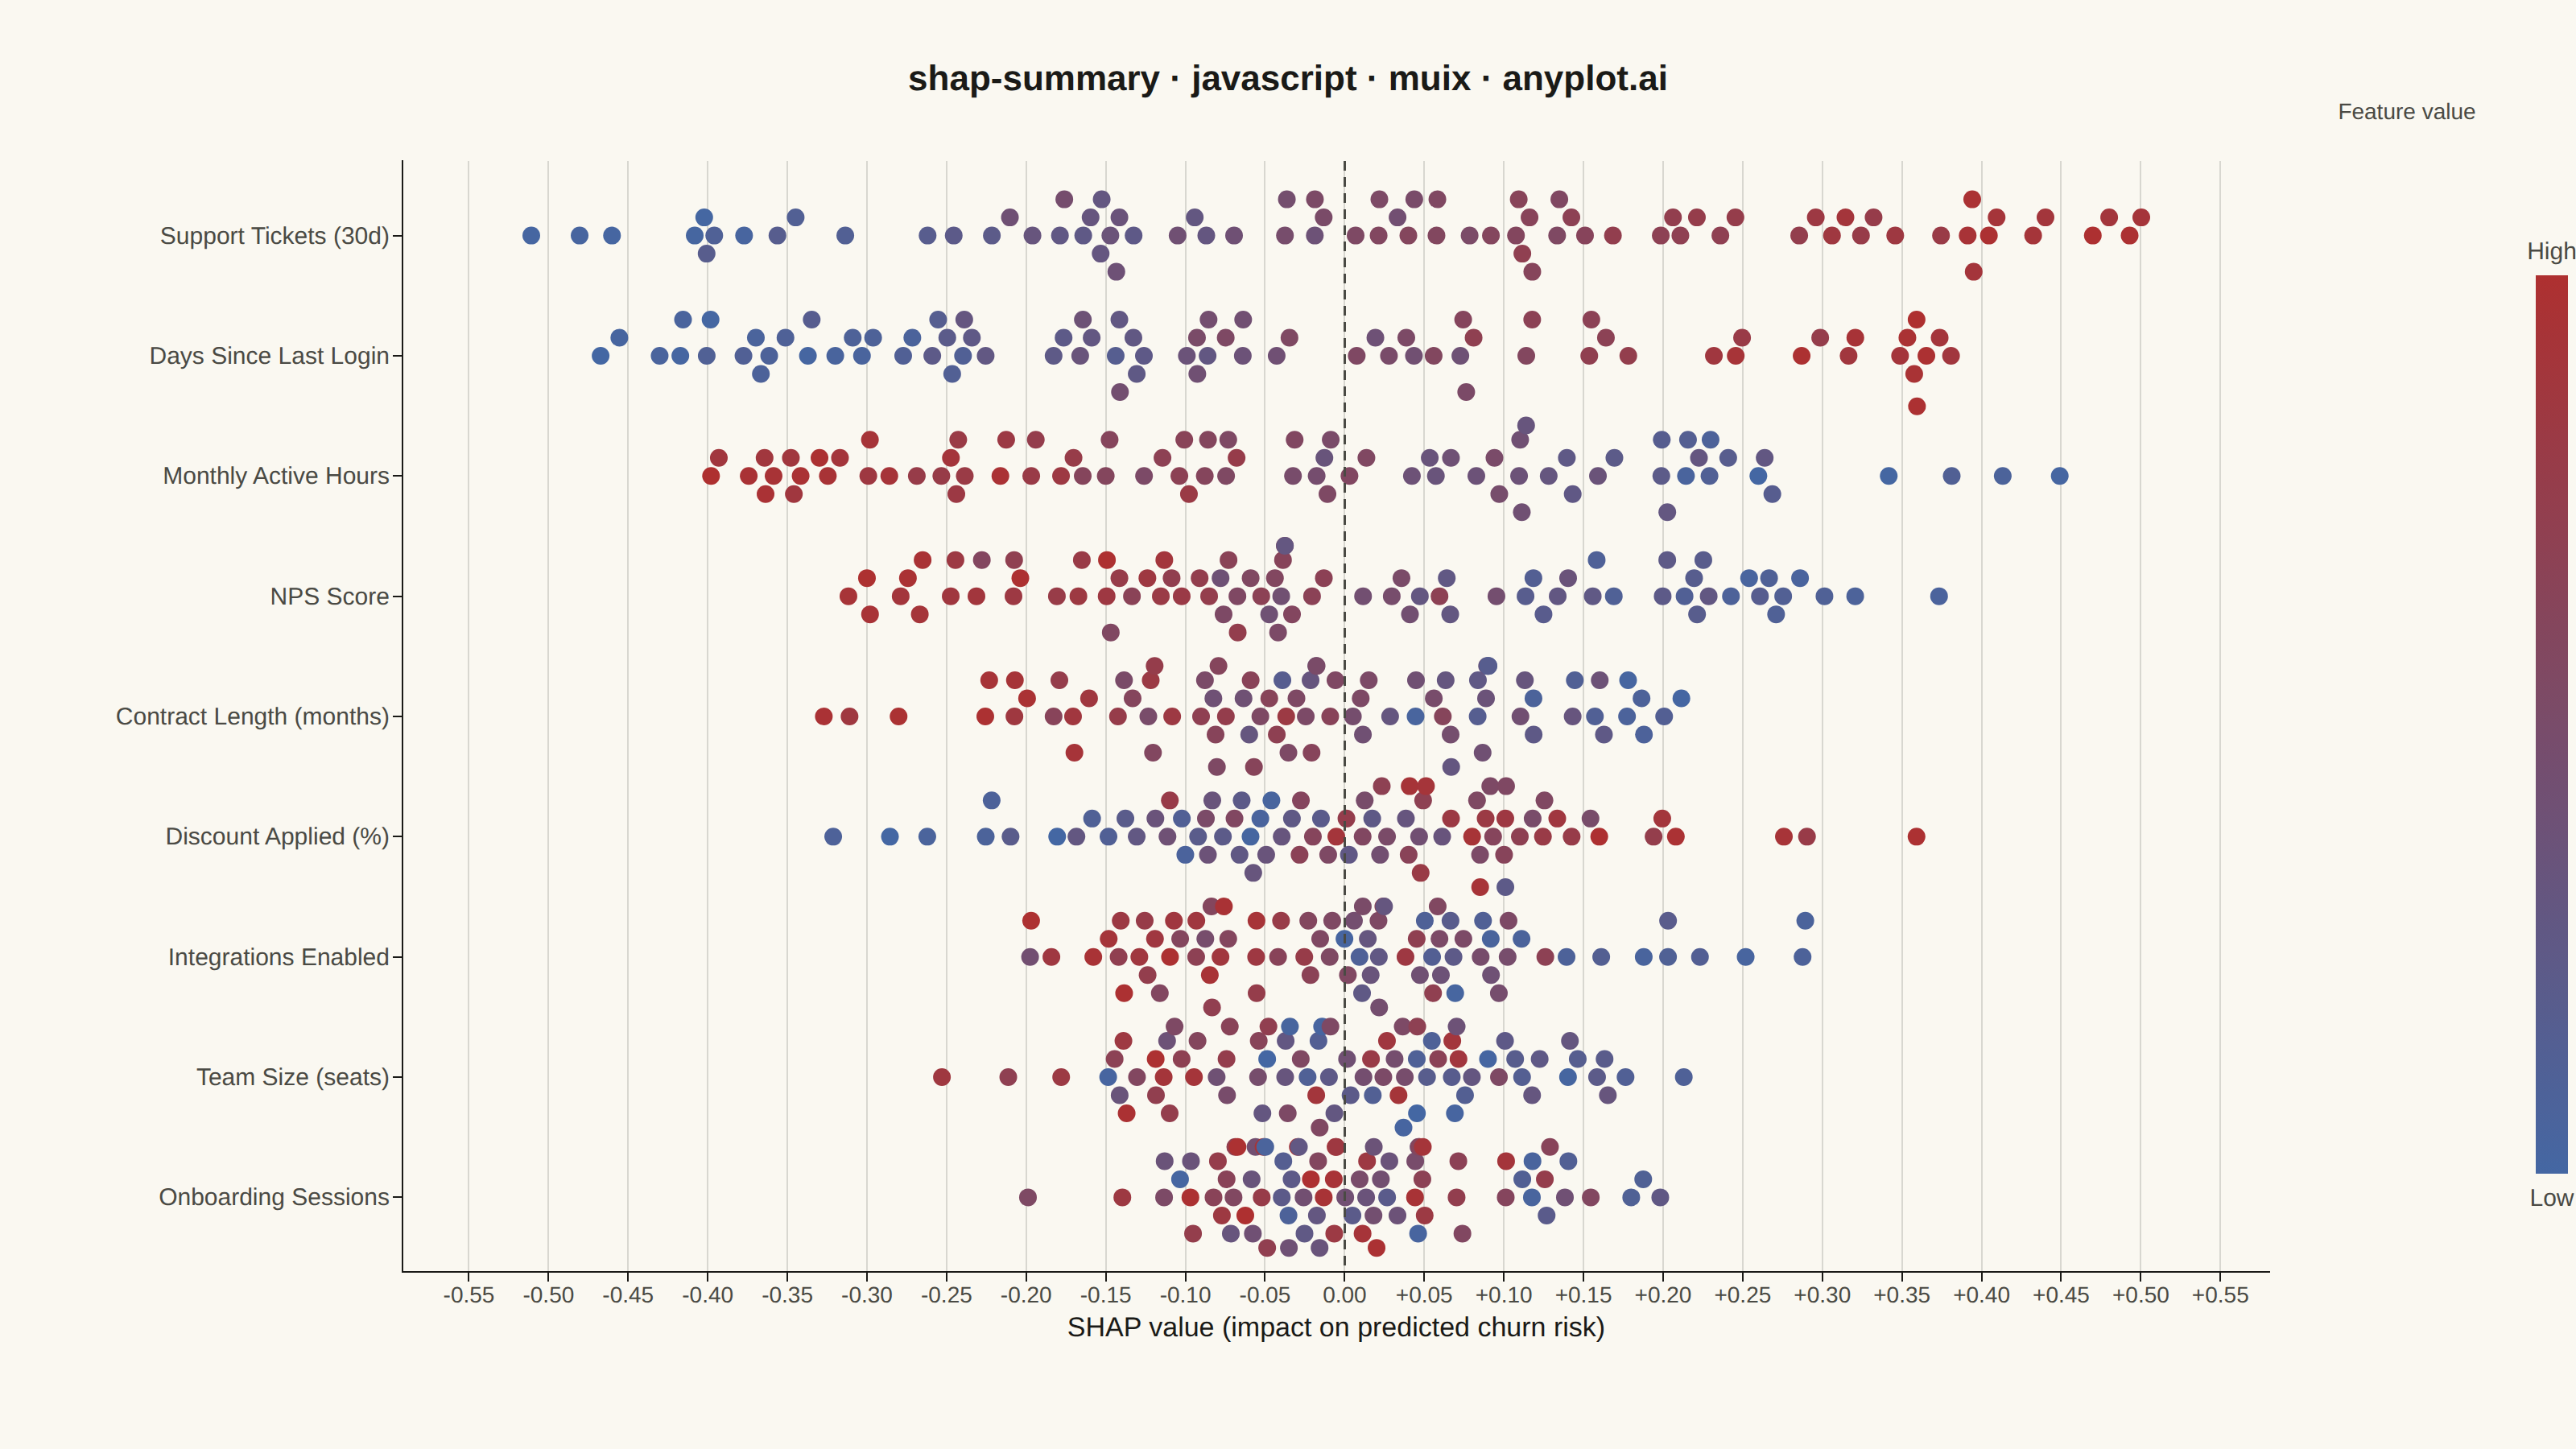
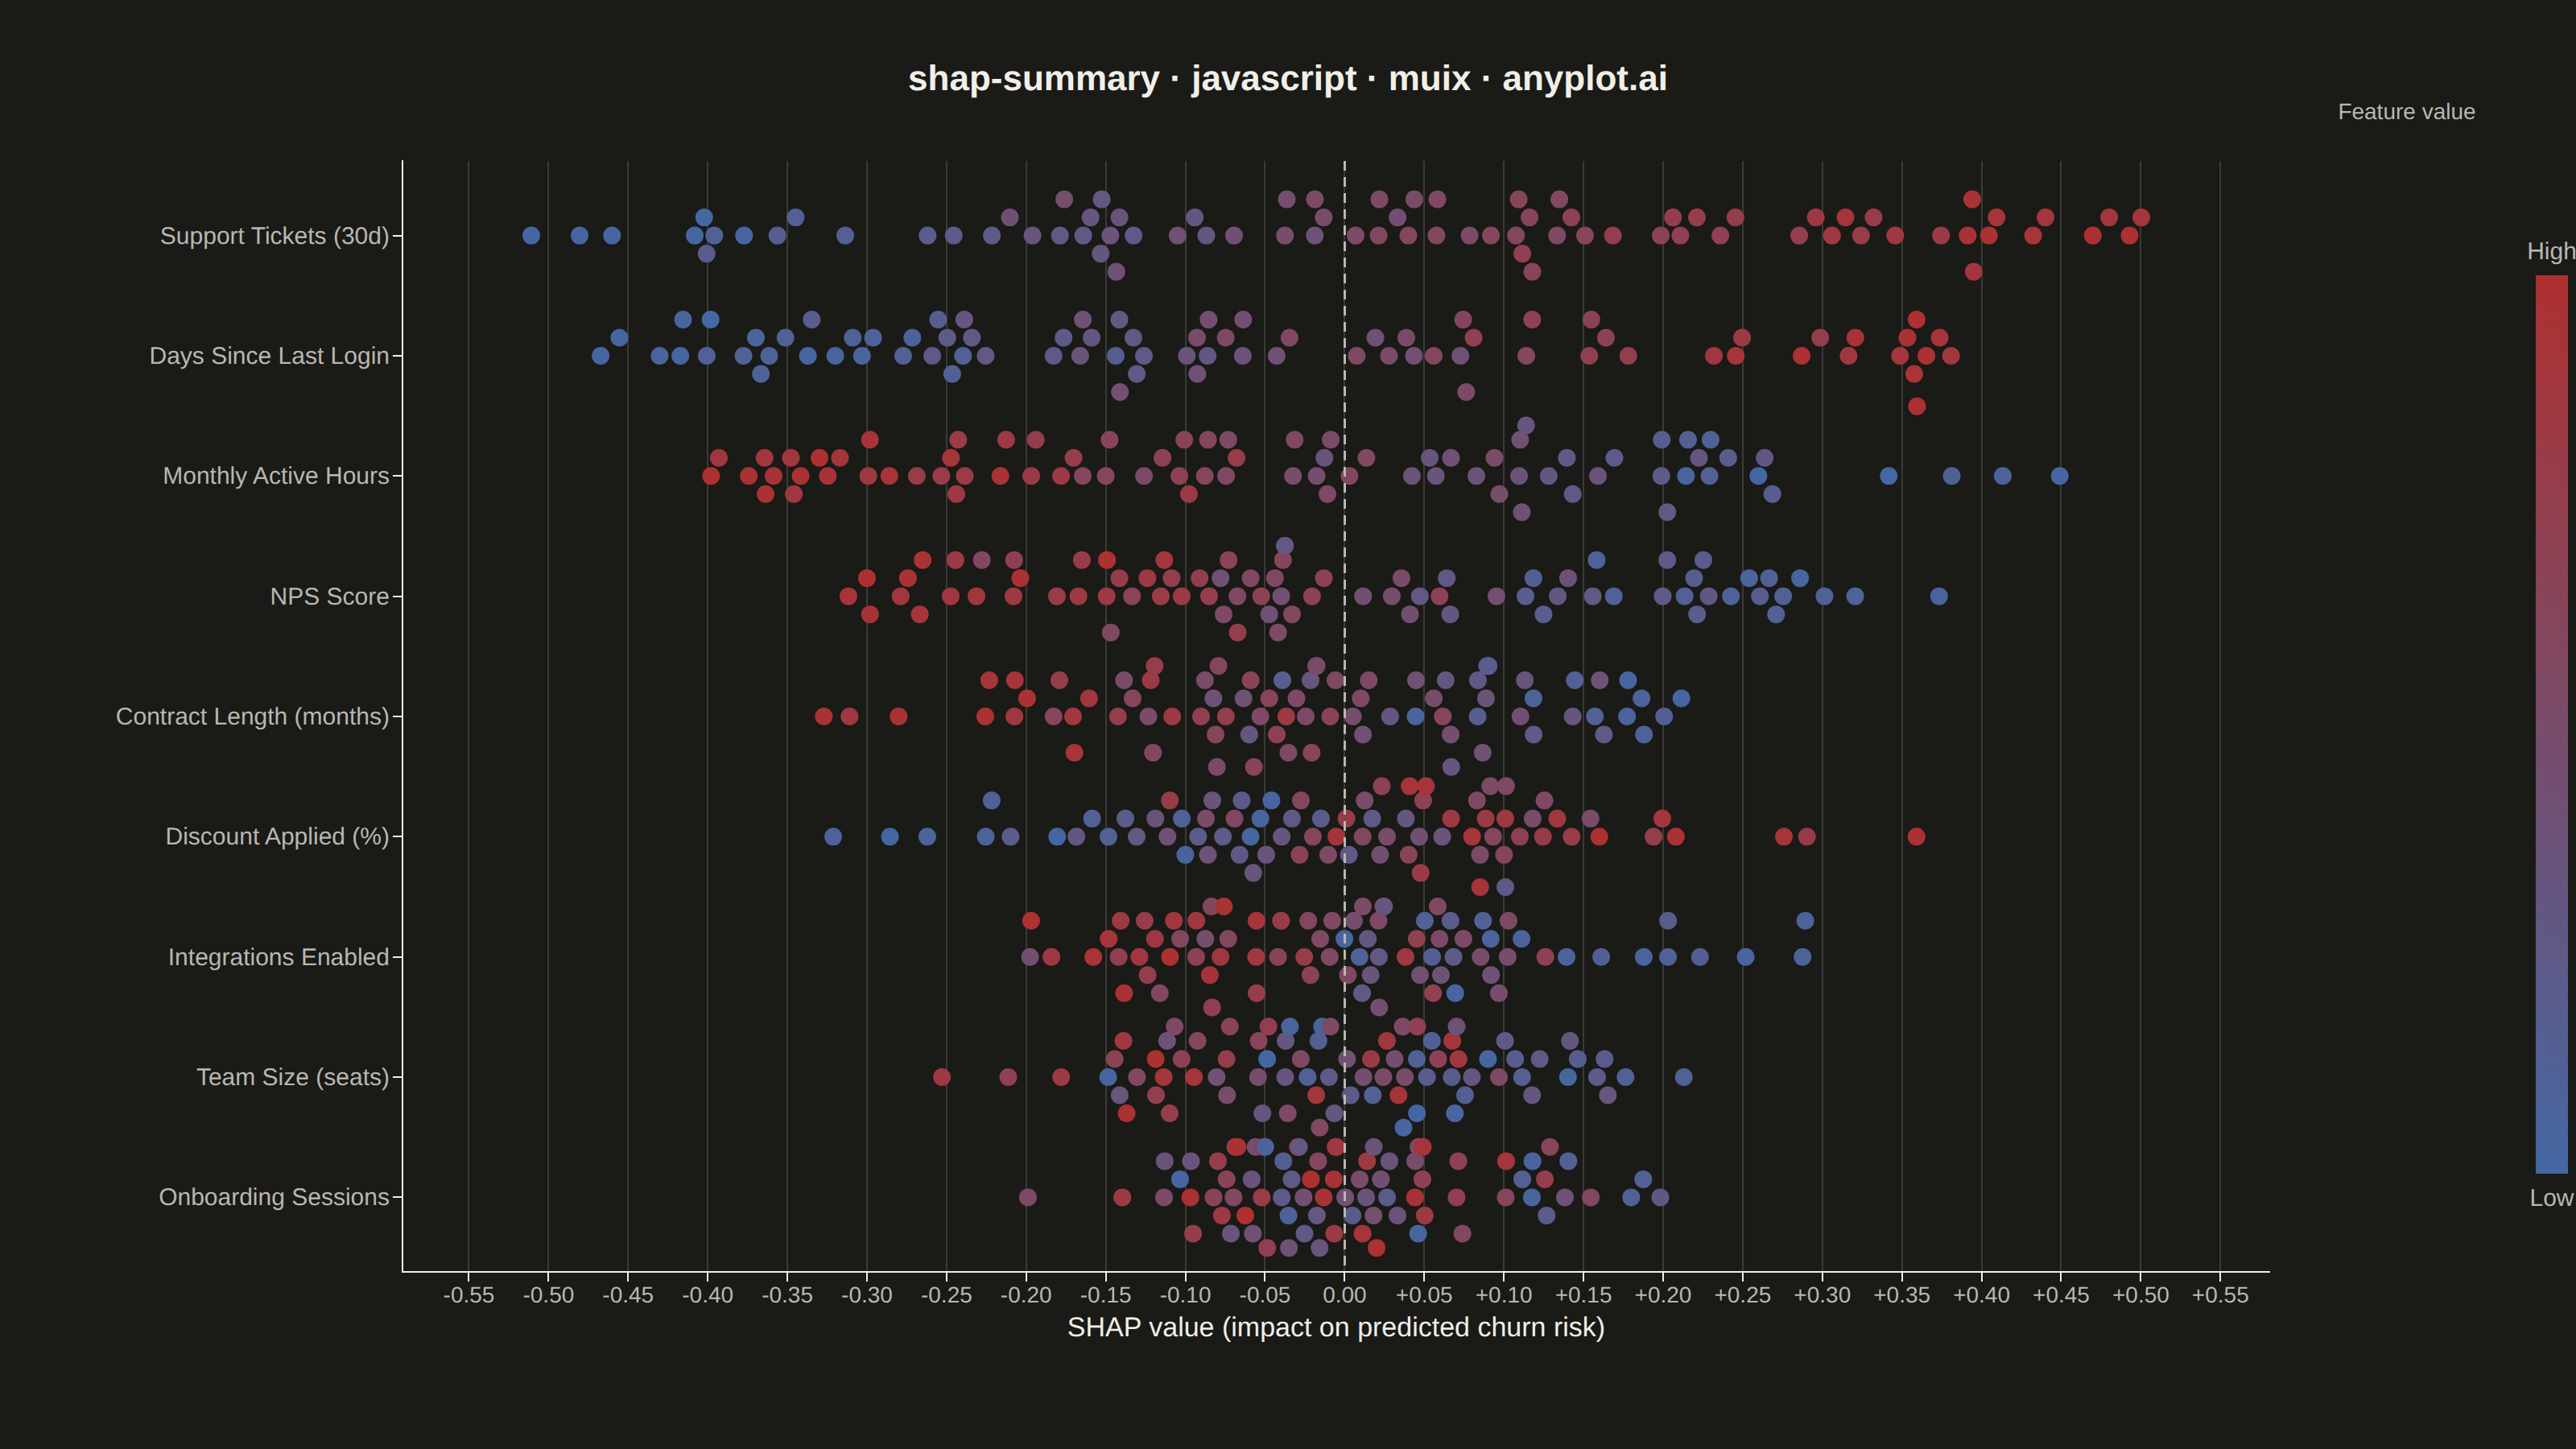
A SHAP (SHapley Additive exPlanations) summary plot displaying the distribution of SHAP values for each feature, ordered by mean absolute SHAP value (importance). Each dot represents a sample, positioned horizontally by its SHAP value and colored by the feature's value (typically low=blue to high=red). This visualization is essential for machine learning interpretability, showing both feature importance and the direction and magnitude of feature effects on model predictions.
// anyplot.ai
// shap-summary: SHAP Summary Plot
// Library: muix 7.29.1 | JavaScript 22.23.2
// Quality: 87/100 | Created: 2026-09-09
import { ScatterChart } from "@mui/x-charts/ScatterChart";
import { ChartsReferenceLine } from "@mui/x-charts/ChartsReferenceLine";
import { ContinuousColorLegend } from "@mui/x-charts/ChartsLegend";
import { ChartsText } from "@mui/x-charts/ChartsText";

const t = window.ANYPLOT_TOKENS;
const { width, height } = window.ANYPLOT_SIZE;

// --- Deterministic PRNG (LCG) + Box-Muller for approx-normal noise ----------
let seed = 42;
function nextUniform() {
  seed = (Math.imul(seed, 1103515245) + 12345) & 0x7fffffff;
  return seed / 0x7fffffff;
}
function nextNormal(mean, stdDev) {
  const u1 = Math.max(nextUniform(), 1e-9);
  const u2 = nextUniform();
  const z = Math.sqrt(-2 * Math.log(u1)) * Math.cos(2 * Math.PI * u2);
  return mean + z * stdDev;
}

// --- Data: XGBoost churn-risk model explained via SHAP (TreeExplainer) -----
// Each feature's SHAP values are driven by its own (normalized) feature value
// plus noise, so a feature with real signal shows a clean color split — e.g.
// red (high feature value) clustered on the side that increases churn risk.
const FEATURE_DEFS = [
  { name: "Support Tickets (30d)", amplitude: 0.48, direction: 1 },
  { name: "Days Since Last Login", amplitude: 0.4, direction: 1 },
  { name: "Monthly Active Hours", amplitude: 0.34, direction: -1 },
  { name: "NPS Score", amplitude: 0.27, direction: -1 },
  { name: "Contract Length (months)", amplitude: 0.22, direction: -1 },
  { name: "Discount Applied (%)", amplitude: 0.17, direction: 1 },
  { name: "Integrations Enabled", amplitude: 0.13, direction: -1 },
  { name: "Team Size (seats)", amplitude: 0.09, direction: -1 },
  { name: "Onboarding Sessions", amplitude: 0.06, direction: -1 },
];

const SAMPLES_PER_FEATURE = 80;

const rawFeatures = FEATURE_DEFS.map((feature) => {
  const points = [];
  for (let s = 0; s < SAMPLES_PER_FEATURE; s += 1) {
    const featureValue = nextUniform(); // normalized 0 (low) - 1 (high)
    const noiseScale = Math.max(0.05 + (0.5 - feature.amplitude) * 0.08, 0.02);
    const shapValue =
      feature.direction * feature.amplitude * (featureValue - 0.5) * 2 + nextNormal(0, noiseScale);
    points.push({ featureValue, shapValue });
  }
  return { name: feature.name, points };
});

// Sort by mean |SHAP value| — most influential feature first (top row).
const meanAbsShap = (points) => points.reduce((sum, p) => sum + Math.abs(p.shapValue), 0) / points.length;
const rankedFeatures = [...rawFeatures].sort((a, b) => meanAbsShap(b.points) - meanAbsShap(a.points));

const FEATURE_COUNT = rankedFeatures.length;
// Row 0 sits at the bottom of the y-axis; the most important feature gets the
// highest row index so it renders at the top.
const NAMES_BOTTOM_TO_TOP = [...rankedFeatures].reverse().map((f) => f.name);

const allShapValues = rankedFeatures.flatMap((f) => f.points.map((p) => p.shapValue));
const dataMin = Math.min(...allShapValues);
const dataMax = Math.max(...allShapValues);
const X_PAD = (dataMax - dataMin) * 0.08;
const X_MIN = dataMin - X_PAD;
const X_MAX = dataMax + X_PAD;
const ROW_MIN = -0.62;
const ROW_MAX = FEATURE_COUNT - 1 + 0.62;

const MARGIN = { top: 100, right: 190, bottom: 110, left: 250 };
const MARKER_SIZE = 5.5;
const MARKER_DIAMETER_PX = MARKER_SIZE * 2 + 1.5;

// --- Beeswarm packing: each point keeps its exact SHAP value on the x-axis;
// only its y-offset within the feature's row is adjusted so overlapping
// samples fan out instead of stacking. Collisions are resolved in on-screen
// pixels so the spread looks even regardless of the x-axis range.
function layoutBeeswarm(plotWidthPx, plotHeightPx) {
  const pxPerX = plotWidthPx / (X_MAX - X_MIN);
  const pxPerRow = plotHeightPx / (ROW_MAX - ROW_MIN);
  const maxOffsetPx = pxPerRow * 0.42;

  return rankedFeatures.flatMap((feature, idx) => {
    const rowPosition = FEATURE_COUNT - 1 - idx;
    const sorted = [...feature.points].sort((a, b) => a.shapValue - b.shapValue);

    const placed = [];
    sorted.forEach((point) => {
      const nearby = placed.filter(
        (p) => Math.abs((point.shapValue - p.shapValue) * pxPerX) < MARKER_DIAMETER_PX,
      );
      let offsetPx = 0;
      if (nearby.length > 0) {
        const step = MARKER_DIAMETER_PX * 0.9;
        let k = 0;
        let candidate = 0;
        let resolved = false;
        while (!resolved && k < 200) {
          const raw = k === 0 ? 0 : (k % 2 === 1 ? Math.ceil(k / 2) : -Math.ceil(k / 2)) * step;
          candidate = Math.max(-maxOffsetPx, Math.min(maxOffsetPx, raw));
          resolved = nearby.every(
            (p) =>
              Math.hypot(candidate - p.offsetPx, (point.shapValue - p.shapValue) * pxPerX) >=
              MARKER_DIAMETER_PX * 0.95,
          );
          k += 1;
        }
        offsetPx = candidate;
      }
      placed.push({ ...point, offsetPx });
    });

    return placed.map((p, i) => ({
      id: `${feature.name}-${i}`,
      x: p.shapValue,
      y: rowPosition + p.offsetPx / pxPerRow,
      z: p.featureValue,
    }));
  });
}

// --- Title (fontsize scales with title length, see plot-generator.md) -------
const TITLE = "shap-summary · javascript · muix · anyplot.ai";
const TITLE_FONTSIZE = Math.round(22 * (TITLE.length > 67 ? 67 / TITLE.length : 1));

// --- Chart (default-exported component — the harness mounts it) ------------
export default function Chart() {
  const plotWidthPx = width - MARGIN.left - MARGIN.right;
  const plotHeightPx = height - MARGIN.top - MARGIN.bottom;
  const points = layoutBeeswarm(plotWidthPx, plotHeightPx);

  return (
    <ScatterChart
      width={width}
      height={height}
      skipAnimation
      legend={{ hidden: true }}
      grid={{ vertical: true }}
      margin={MARGIN}
      xAxis={[
        {
          id: "shapValue",
          min: X_MIN,
          max: X_MAX,
          label: "SHAP value (impact on predicted churn risk)",
          labelStyle: { fontSize: 17, fill: t.ink },
          tickLabelStyle: { fontSize: 14, fill: t.inkSoft },
          valueFormatter: (value) => `${value > 0 ? "+" : ""}${value.toFixed(2)}`,
        },
      ]}
      yAxis={[
        {
          id: "features",
          min: ROW_MIN,
          max: ROW_MAX,
          tickMinStep: 1,
          valueFormatter: (value) => NAMES_BOTTOM_TO_TOP[Math.round(value)] ?? "",
          tickLabelStyle: { fontSize: 15, fill: t.inkSoft },
        },
      ]}
      zAxis={[
        {
          id: "featureValue",
          min: 0,
          max: 1,
          colorMap: {
            type: "continuous",
            min: 0,
            max: 1,
            color: [t.div[2], t.div[0]],
          },
          valueFormatter: (value) => `${Math.round(value * 100)}th pct`,
        },
      ]}
      series={[
        {
          id: "shapSamples",
          label: "Sample SHAP values",
          data: points,
          markerSize: MARKER_SIZE,
          color: t.palette[0],
        },
      ]}
    >
      <ChartsReferenceLine
        x={0}
        lineStyle={{ stroke: t.inkSoft, strokeDasharray: "6 4", strokeWidth: 1.5 }}
      />
      <ChartsText
        text={TITLE}
        x={width / 2}
        y={40}
        style={{
          fontSize: TITLE_FONTSIZE,
          fontWeight: 600,
          fill: t.ink,
          textAnchor: "middle",
          dominantBaseline: "hanging",
        }}
      />
      <ChartsText
        text="Feature value"
        x={width - 105}
        y={64}
        style={{
          fontSize: 14,
          fill: t.inkSoft,
          textAnchor: "middle",
          dominantBaseline: "hanging",
        }}
      />
      <ContinuousColorLegend
        axisDirection="z"
        direction="column"
        position={{ horizontal: "right", vertical: "middle" }}
        length="62%"
        thickness={20}
        spacing={10}
        align="middle"
        minLabel="Low"
        maxLabel="High"
        labelStyle={{ fontSize: 15, fill: t.inkSoft }}
      />
    </ScatterChart>
  );
}
Runnable source as JSON, for any HTTP client: https://api.anyplot.ai/specs/shap-summary/muix/code. Any spec id and library id listed in llms-full.txt fit the same URL shape; every URL below is complete and callable.
{
  "spec_id": "shap-summary",
  "language": "javascript",
  "library": "muix",
  "page": "https://anyplot.ai/shap-summary/javascript/muix",
  "hub": "https://anyplot.ai/shap-summary",
  "code_json": "https://api.anyplot.ai/specs/shap-summary/muix/code",
  "spec_json": "https://api.anyplot.ai/specs/shap-summary",
  "render_light_png": "https://storage.googleapis.com/anyplot-images/plots/shap-summary/javascript/muix/plot-light.png",
  "render_dark_png": "https://storage.googleapis.com/anyplot-images/plots/shap-summary/javascript/muix/plot-dark.png",
  "interactive_light_html": "https://storage.googleapis.com/anyplot-images/plots/shap-summary/javascript/muix/plot-light.html",
  "interactive_dark_html": "https://storage.googleapis.com/anyplot-images/plots/shap-summary/javascript/muix/plot-dark.html",
  "quality_score": 87.0,
  "license": "MIT",
  "guide": "https://anyplot.ai/llms.txt"
}
Part of SHAP Summary Plot on anyplot.ai.