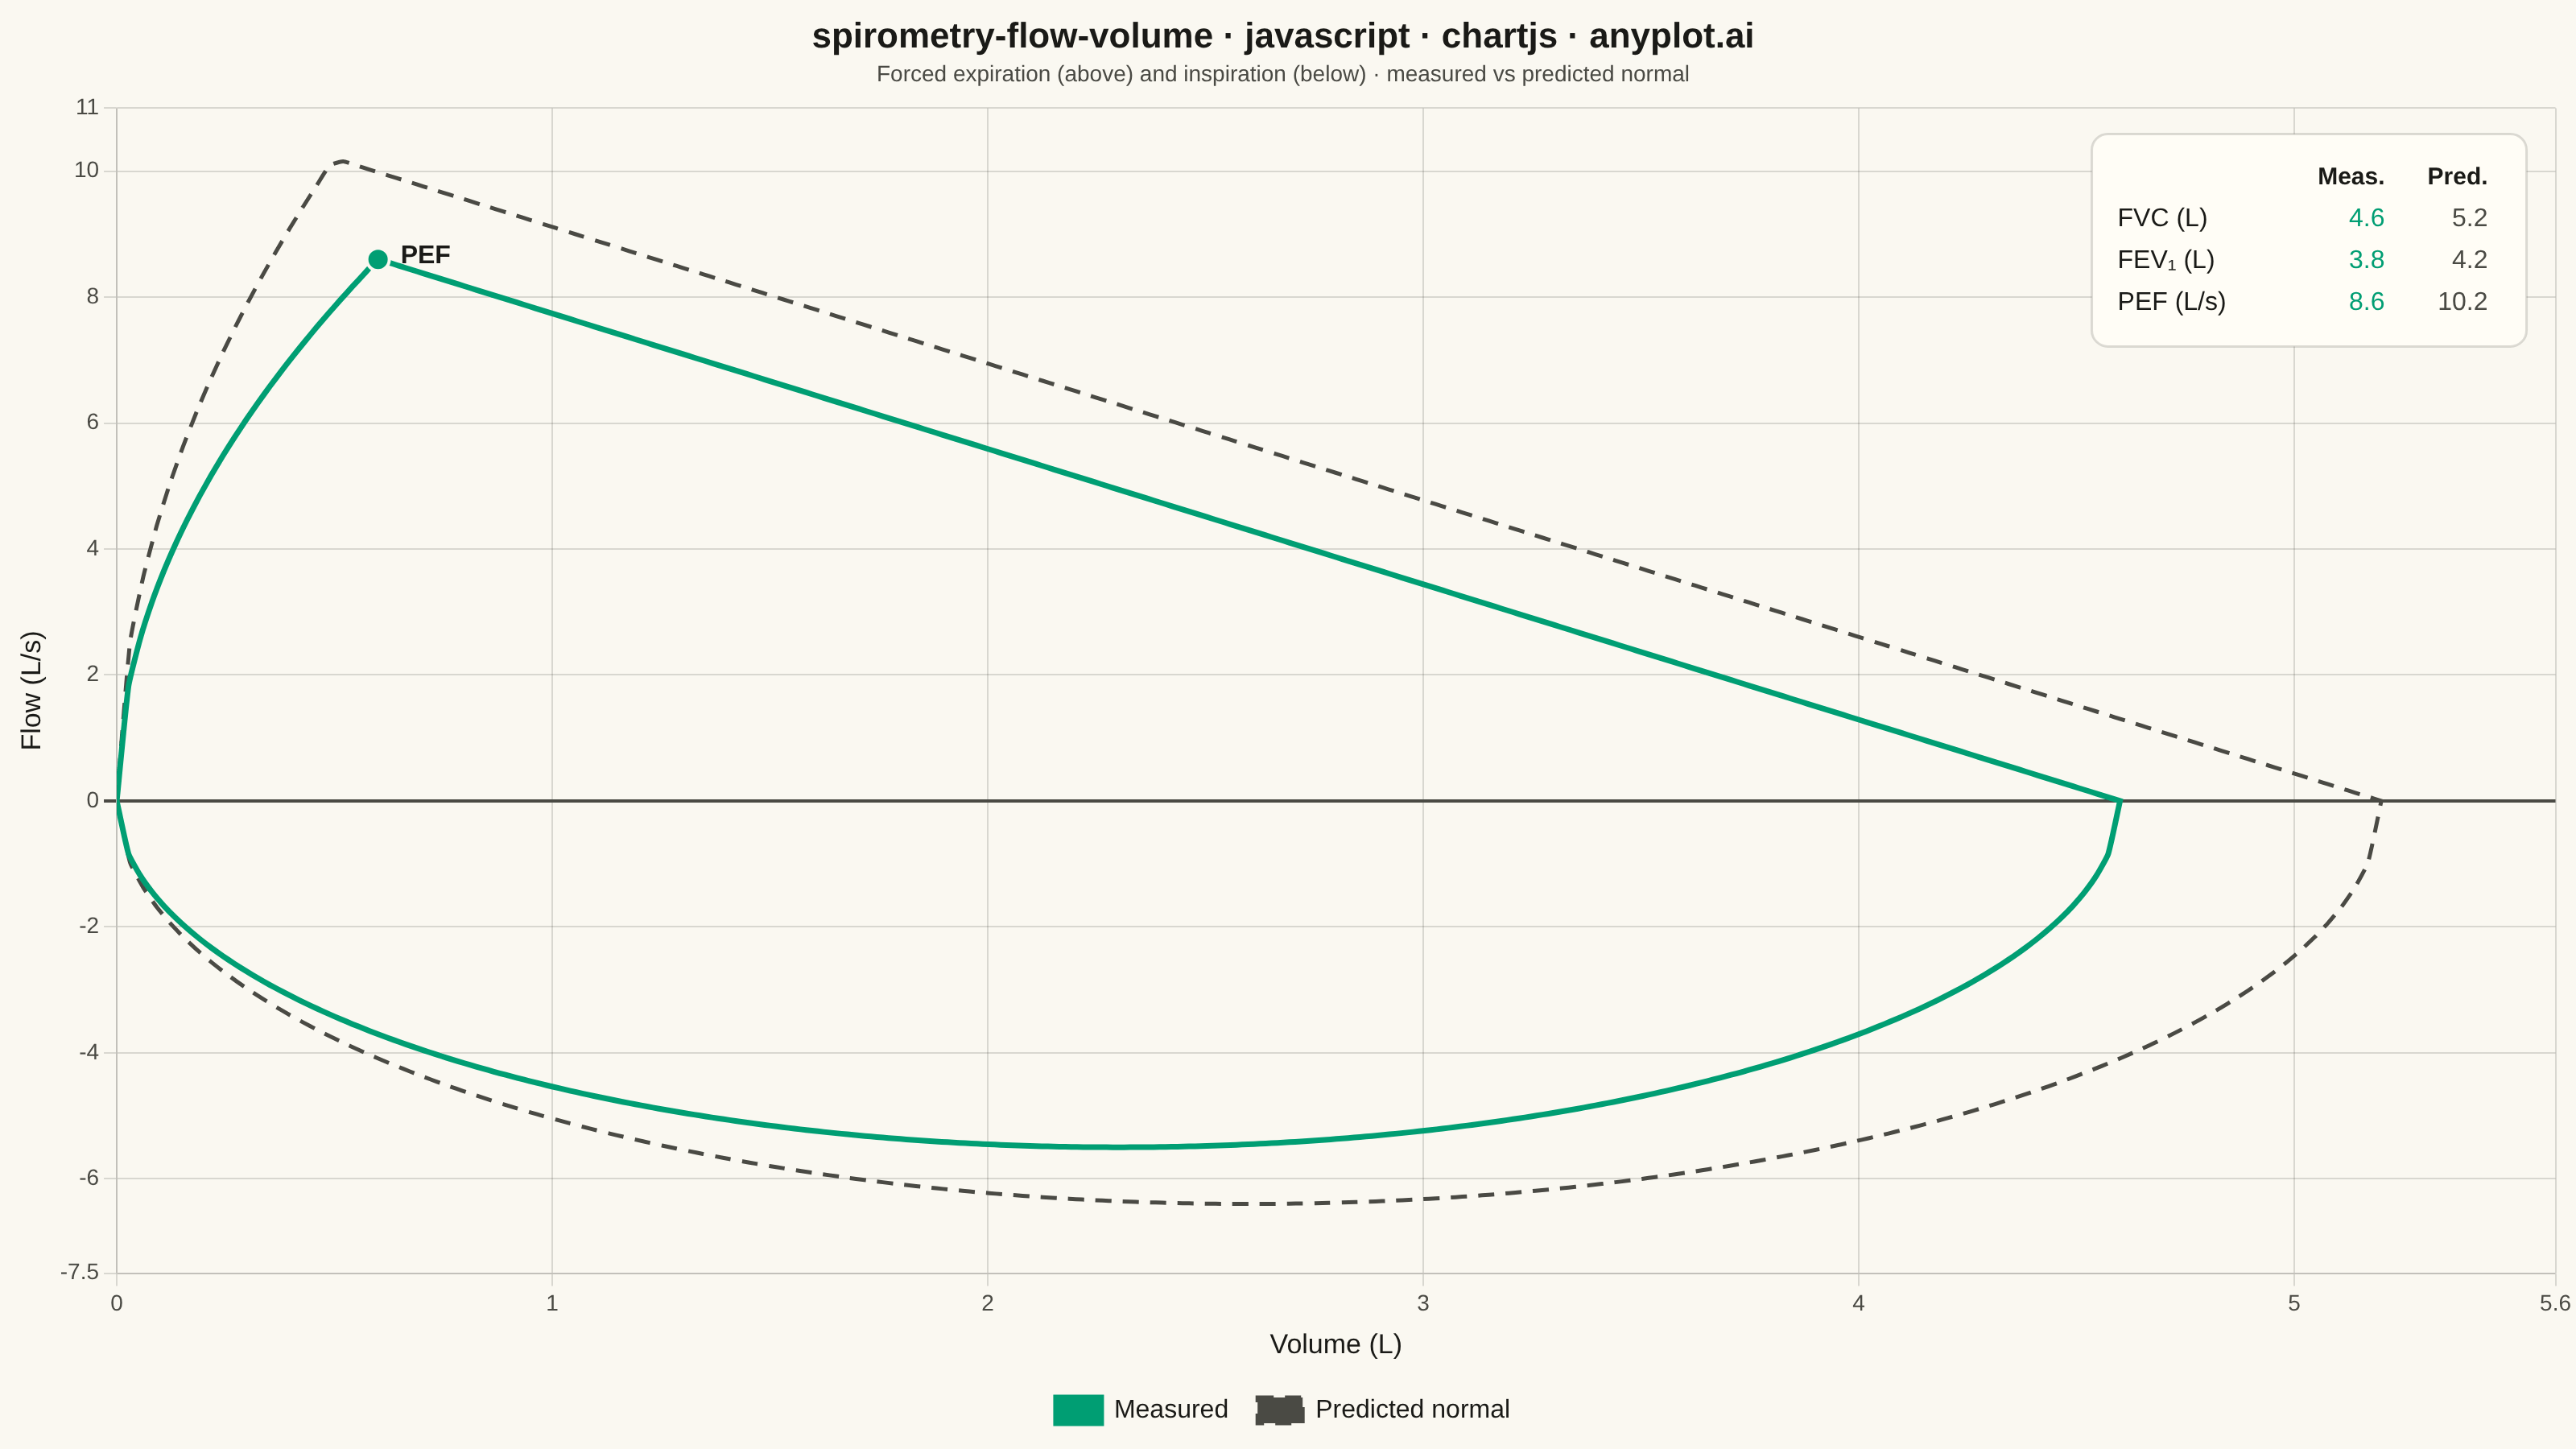
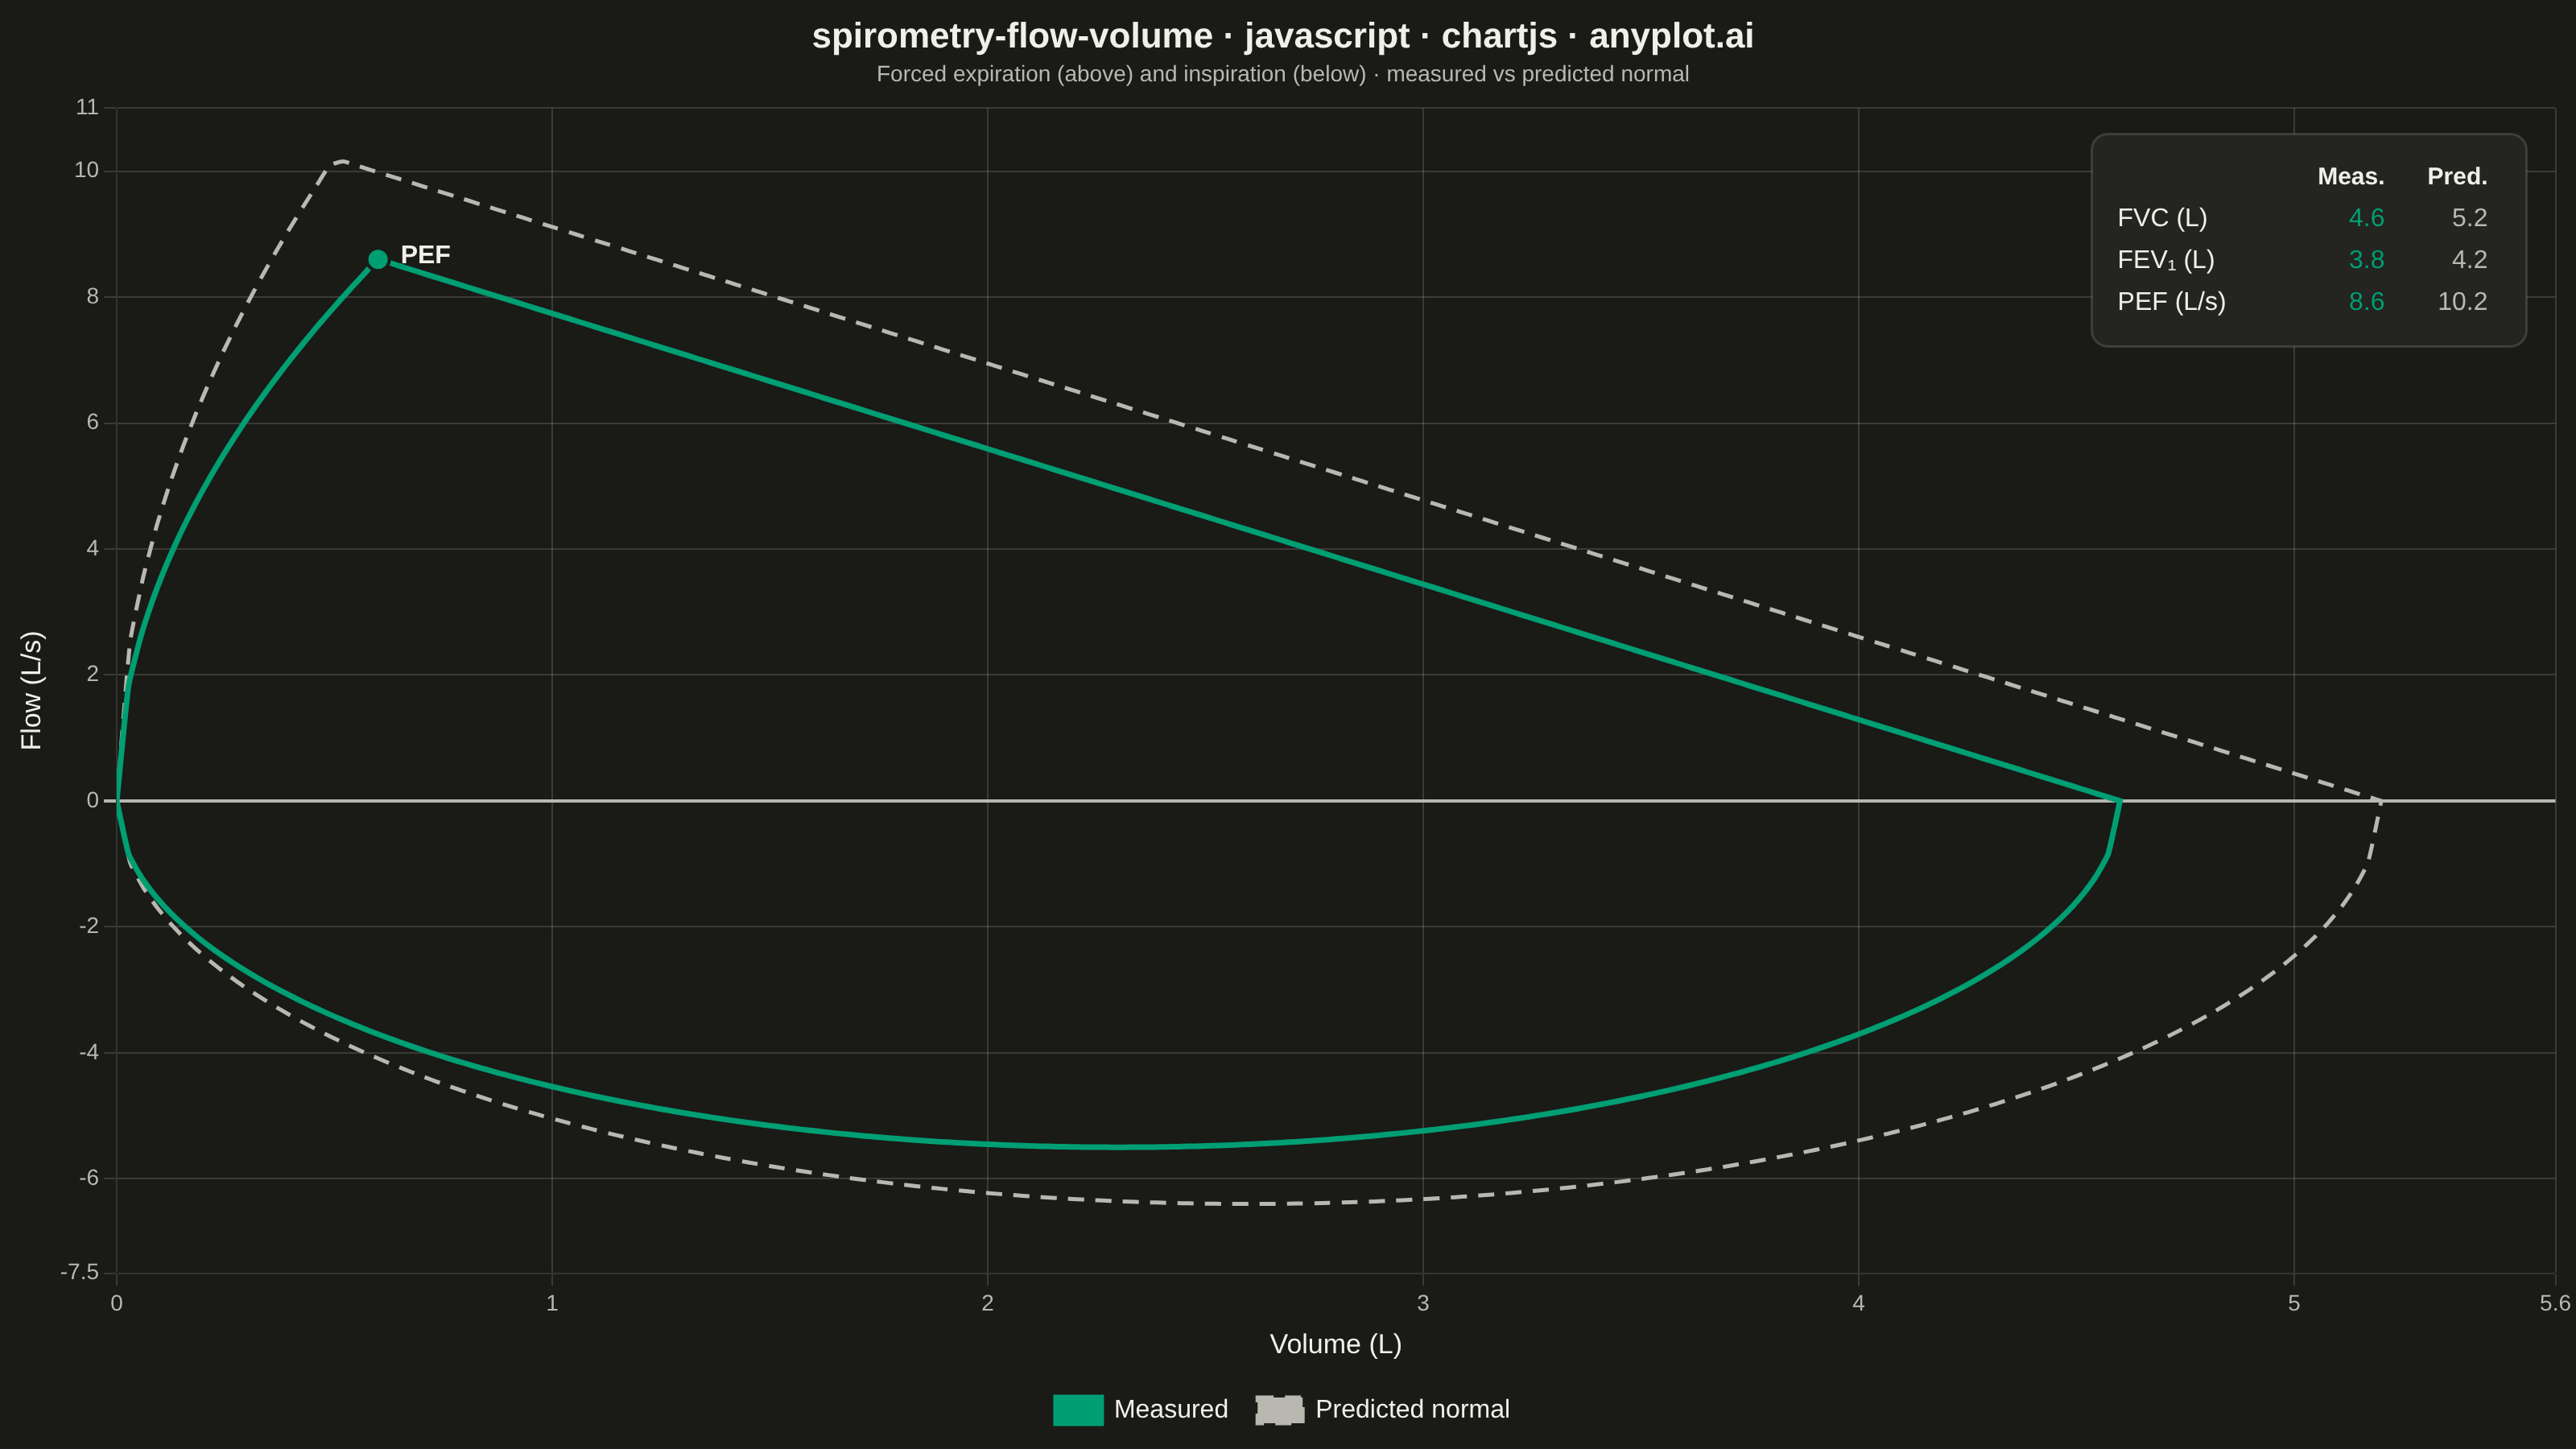
A pulmonary function test visualization that plots airflow rate (L/s) against lung volume (L) during forced expiration and inspiration, forming a characteristic loop shape. The expiratory limb rises sharply to Peak Expiratory Flow (PEF) then declines, while the inspiratory limb forms a more symmetric curve below the x-axis. This plot is essential for diagnosing obstructive and restrictive lung diseases by comparing measured loops against predicted normal values.
// anyplot.ai
// spirometry-flow-volume: Spirometry Flow-Volume Loop
// Library: chartjs 4.4.7 | JavaScript 22.22.3
// Quality: 90/100 | Created: 2026-06-17
//# anyplot-orientation: landscape

const t = window.ANYPLOT_TOKENS;

// Theme-adaptive chrome (data colours stay constant; only chrome flips)
const PAGE = t.pageBg;
const ELEV = t.elevatedBg;
const INK = t.ink;
const INK_SOFT = t.inkSoft;
const GRID = t.grid;

// Imprint palette — measured loop = brand green (first series)
const MEASURED = t.palette[0]; // #009E73
const PREDICTED = INK_SOFT; // dashed neutral reference overlay

// --- Data (in-memory, deterministic) ---------------------------------------
// A forced-expiration/inspiration flow-volume loop. Volume (L) on x, flow (L/s)
// on y: the expiratory limb rises sharply to Peak Expiratory Flow then declines
// roughly linearly; the inspiratory limb is a symmetric half-ellipse below zero.
const buildLoop = ({ fvc, pef, vPef, pif, n = 170 }) => {
  const expiratory = [];
  for (let i = 0; i <= n; i++) {
    const v = (fvc * i) / n;
    // Sharp rise to PEF (sqrt edge), then near-linear effort-independent decline
    const flow =
      v < vPef ? pef * Math.sqrt(v / vPef) : (pef * (fvc - v)) / (fvc - vPef);
    expiratory.push({ x: v, y: Math.max(0, flow) });
  }
  const inspiratory = [];
  for (let i = 0; i <= n; i++) {
    const v = fvc * (1 - i / n); // return from FVC back to 0
    const half = fvc / 2;
    const flow = -pif * Math.sqrt(Math.max(0, 1 - ((v - half) / half) ** 2));
    inspiratory.push({ x: v, y: flow });
  }
  return expiratory.concat(inspiratory); // closed loop in draw order
};

// Predicted normal reference and a measured patient with mildly reduced flows.
const predicted = { fvc: 5.2, pef: 10.2, vPef: 0.5, pif: 6.4, fev1: 4.2 };
const measured = { fvc: 4.6, pef: 8.6, vPef: 0.6, pif: 5.5, fev1: 3.8 };

const measuredLoop = buildLoop(measured);
const predictedLoop = buildLoop(predicted);
const pefPoint = [{ x: measured.vPef, y: measured.pef }];

// --- Mount -----------------------------------------------------------------
const canvas = document.createElement("canvas");
document.getElementById("container").appendChild(canvas);

// --- Annotation plugin: zero-flow rule, PEF marker label, clinical values ---
const annotate = {
  id: "annotate",
  afterDatasetsDraw(chart) {
    const { ctx, chartArea, scales } = chart;
    ctx.save();

    // PEF marker label
    const px = scales.x.getPixelForValue(measured.vPef);
    const py = scales.y.getPixelForValue(measured.pef);
    ctx.font = '700 16px -apple-system, "Segoe UI", Roboto, sans-serif';
    ctx.fillStyle = INK;
    ctx.textAlign = "left";
    ctx.textBaseline = "middle";
    ctx.fillText("PEF", px + 14, py - 2);

    // Clinical-values card (top-right corner of the plot area)
    const rows = [
      ["", "Meas.", "Pred."],
      ["FVC (L)", measured.fvc.toFixed(1), predicted.fvc.toFixed(1)],
      ["FEV₁ (L)", measured.fev1.toFixed(1), predicted.fev1.toFixed(1)],
      ["PEF (L/s)", measured.pef.toFixed(1), predicted.pef.toFixed(1)],
    ];
    const padX = 16;
    const padY = 14;
    const lineH = 26;
    const colW = [110, 64, 64];
    const cardW = padX * 2 + colW[0] + colW[1] + colW[2];
    const cardH = padY * 2 + lineH * rows.length;
    const cardX = chartArea.right - cardW - 18;
    const cardY = chartArea.top + 16;

    ctx.fillStyle = ELEV;
    ctx.strokeStyle = GRID;
    ctx.lineWidth = 1.5;
    ctx.beginPath();
    ctx.roundRect(cardX, cardY, cardW, cardH, 10);
    ctx.fill();
    ctx.stroke();

    ctx.textBaseline = "middle";
    rows.forEach((row, r) => {
      const ty = cardY + padY + lineH * r + lineH / 2;
      const header = r === 0;
      row.forEach((cell, c) => {
        ctx.font = header
          ? '700 15px -apple-system, "Segoe UI", Roboto, sans-serif'
          : '500 16px -apple-system, "Segoe UI", Roboto, sans-serif';
        ctx.fillStyle = header || c === 0 ? INK : c === 1 ? MEASURED : INK_SOFT;
        let tx = cardX + padX;
        for (let k = 0; k < c; k++) tx += colW[k];
        ctx.textAlign = c === 0 ? "left" : "right";
        const anchor = c === 0 ? tx : tx + colW[c] - 8;
        ctx.fillText(cell, anchor, ty);
      });
    });

    ctx.restore();
  },
};

// --- Chart -----------------------------------------------------------------
new Chart(canvas, {
  type: "scatter",
  data: {
    datasets: [
      {
        label: "Measured",
        data: measuredLoop,
        showLine: true,
        borderColor: MEASURED,
        backgroundColor: MEASURED,
        borderWidth: 3.5,
        pointRadius: 0,
        tension: 0.15,
        order: 1,
      },
      {
        label: "Predicted normal",
        data: predictedLoop,
        showLine: true,
        borderColor: PREDICTED,
        backgroundColor: PREDICTED,
        borderWidth: 2.5,
        borderDash: [10, 7],
        pointRadius: 0,
        tension: 0.15,
        order: 2,
      },
      {
        label: "PEF",
        data: pefPoint,
        showLine: false,
        backgroundColor: MEASURED,
        borderColor: PAGE,
        borderWidth: 2,
        pointRadius: 7,
        pointHoverRadius: 7,
      },
    ],
  },
  options: {
    responsive: true,
    maintainAspectRatio: false,
    animation: false,
    layout: { padding: { top: 6, right: 12, bottom: 6, left: 6 } },
    scales: {
      x: {
        type: "linear",
        min: 0,
        max: 5.6,
        title: {
          display: true,
          text: "Volume (L)",
          color: INK,
          font: { size: 17 },
        },
        ticks: { color: INK_SOFT, font: { size: 14 } },
        grid: { color: GRID },
      },
      y: {
        type: "linear",
        min: -7.5,
        max: 11,
        title: {
          display: true,
          text: "Flow (L/s)",
          color: INK,
          font: { size: 17 },
        },
        ticks: { color: INK_SOFT, font: { size: 14 } },
        grid: {
          color: (c) => (c.tick.value === 0 ? INK_SOFT : GRID),
          lineWidth: (c) => (c.tick.value === 0 ? 2 : 1),
        },
      },
    },
    plugins: {
      title: {
        display: true,
        text: "spirometry-flow-volume · javascript · chartjs · anyplot.ai",
        color: INK,
        font: { size: 22, weight: "600" },
        padding: { top: 4, bottom: 2 },
      },
      subtitle: {
        display: true,
        text: "Forced expiration (above) and inspiration (below) · measured vs predicted normal",
        color: INK_SOFT,
        font: { size: 14 },
        padding: { bottom: 12 },
      },
      legend: {
        position: "bottom",
        labels: {
          color: INK,
          font: { size: 16 },
          padding: 18,
          boxWidth: 28,
          usePointStyle: false,
          filter: (item) => item.text !== "PEF",
        },
      },
      tooltip: { enabled: false },
    },
  },
  plugins: [annotate],
});
Runnable source as JSON, for any HTTP client: https://api.anyplot.ai/specs/spirometry-flow-volume/chartjs/code. Any spec id and library id listed in llms-full.txt fit the same URL shape; every URL below is complete and callable.
{
  "spec_id": "spirometry-flow-volume",
  "language": "javascript",
  "library": "chartjs",
  "page": "https://anyplot.ai/spirometry-flow-volume/javascript/chartjs",
  "hub": "https://anyplot.ai/spirometry-flow-volume",
  "code_json": "https://api.anyplot.ai/specs/spirometry-flow-volume/chartjs/code",
  "spec_json": "https://api.anyplot.ai/specs/spirometry-flow-volume",
  "render_light_png": "https://storage.googleapis.com/anyplot-images/plots/spirometry-flow-volume/javascript/chartjs/plot-light.png",
  "render_dark_png": "https://storage.googleapis.com/anyplot-images/plots/spirometry-flow-volume/javascript/chartjs/plot-dark.png",
  "interactive_light_html": "https://storage.googleapis.com/anyplot-images/plots/spirometry-flow-volume/javascript/chartjs/plot-light.html",
  "interactive_dark_html": "https://storage.googleapis.com/anyplot-images/plots/spirometry-flow-volume/javascript/chartjs/plot-dark.html",
  "quality_score": 90.0,
  "license": "MIT",
  "guide": "https://anyplot.ai/llms.txt"
}
Part of Spirometry Flow-Volume Loop on anyplot.ai.