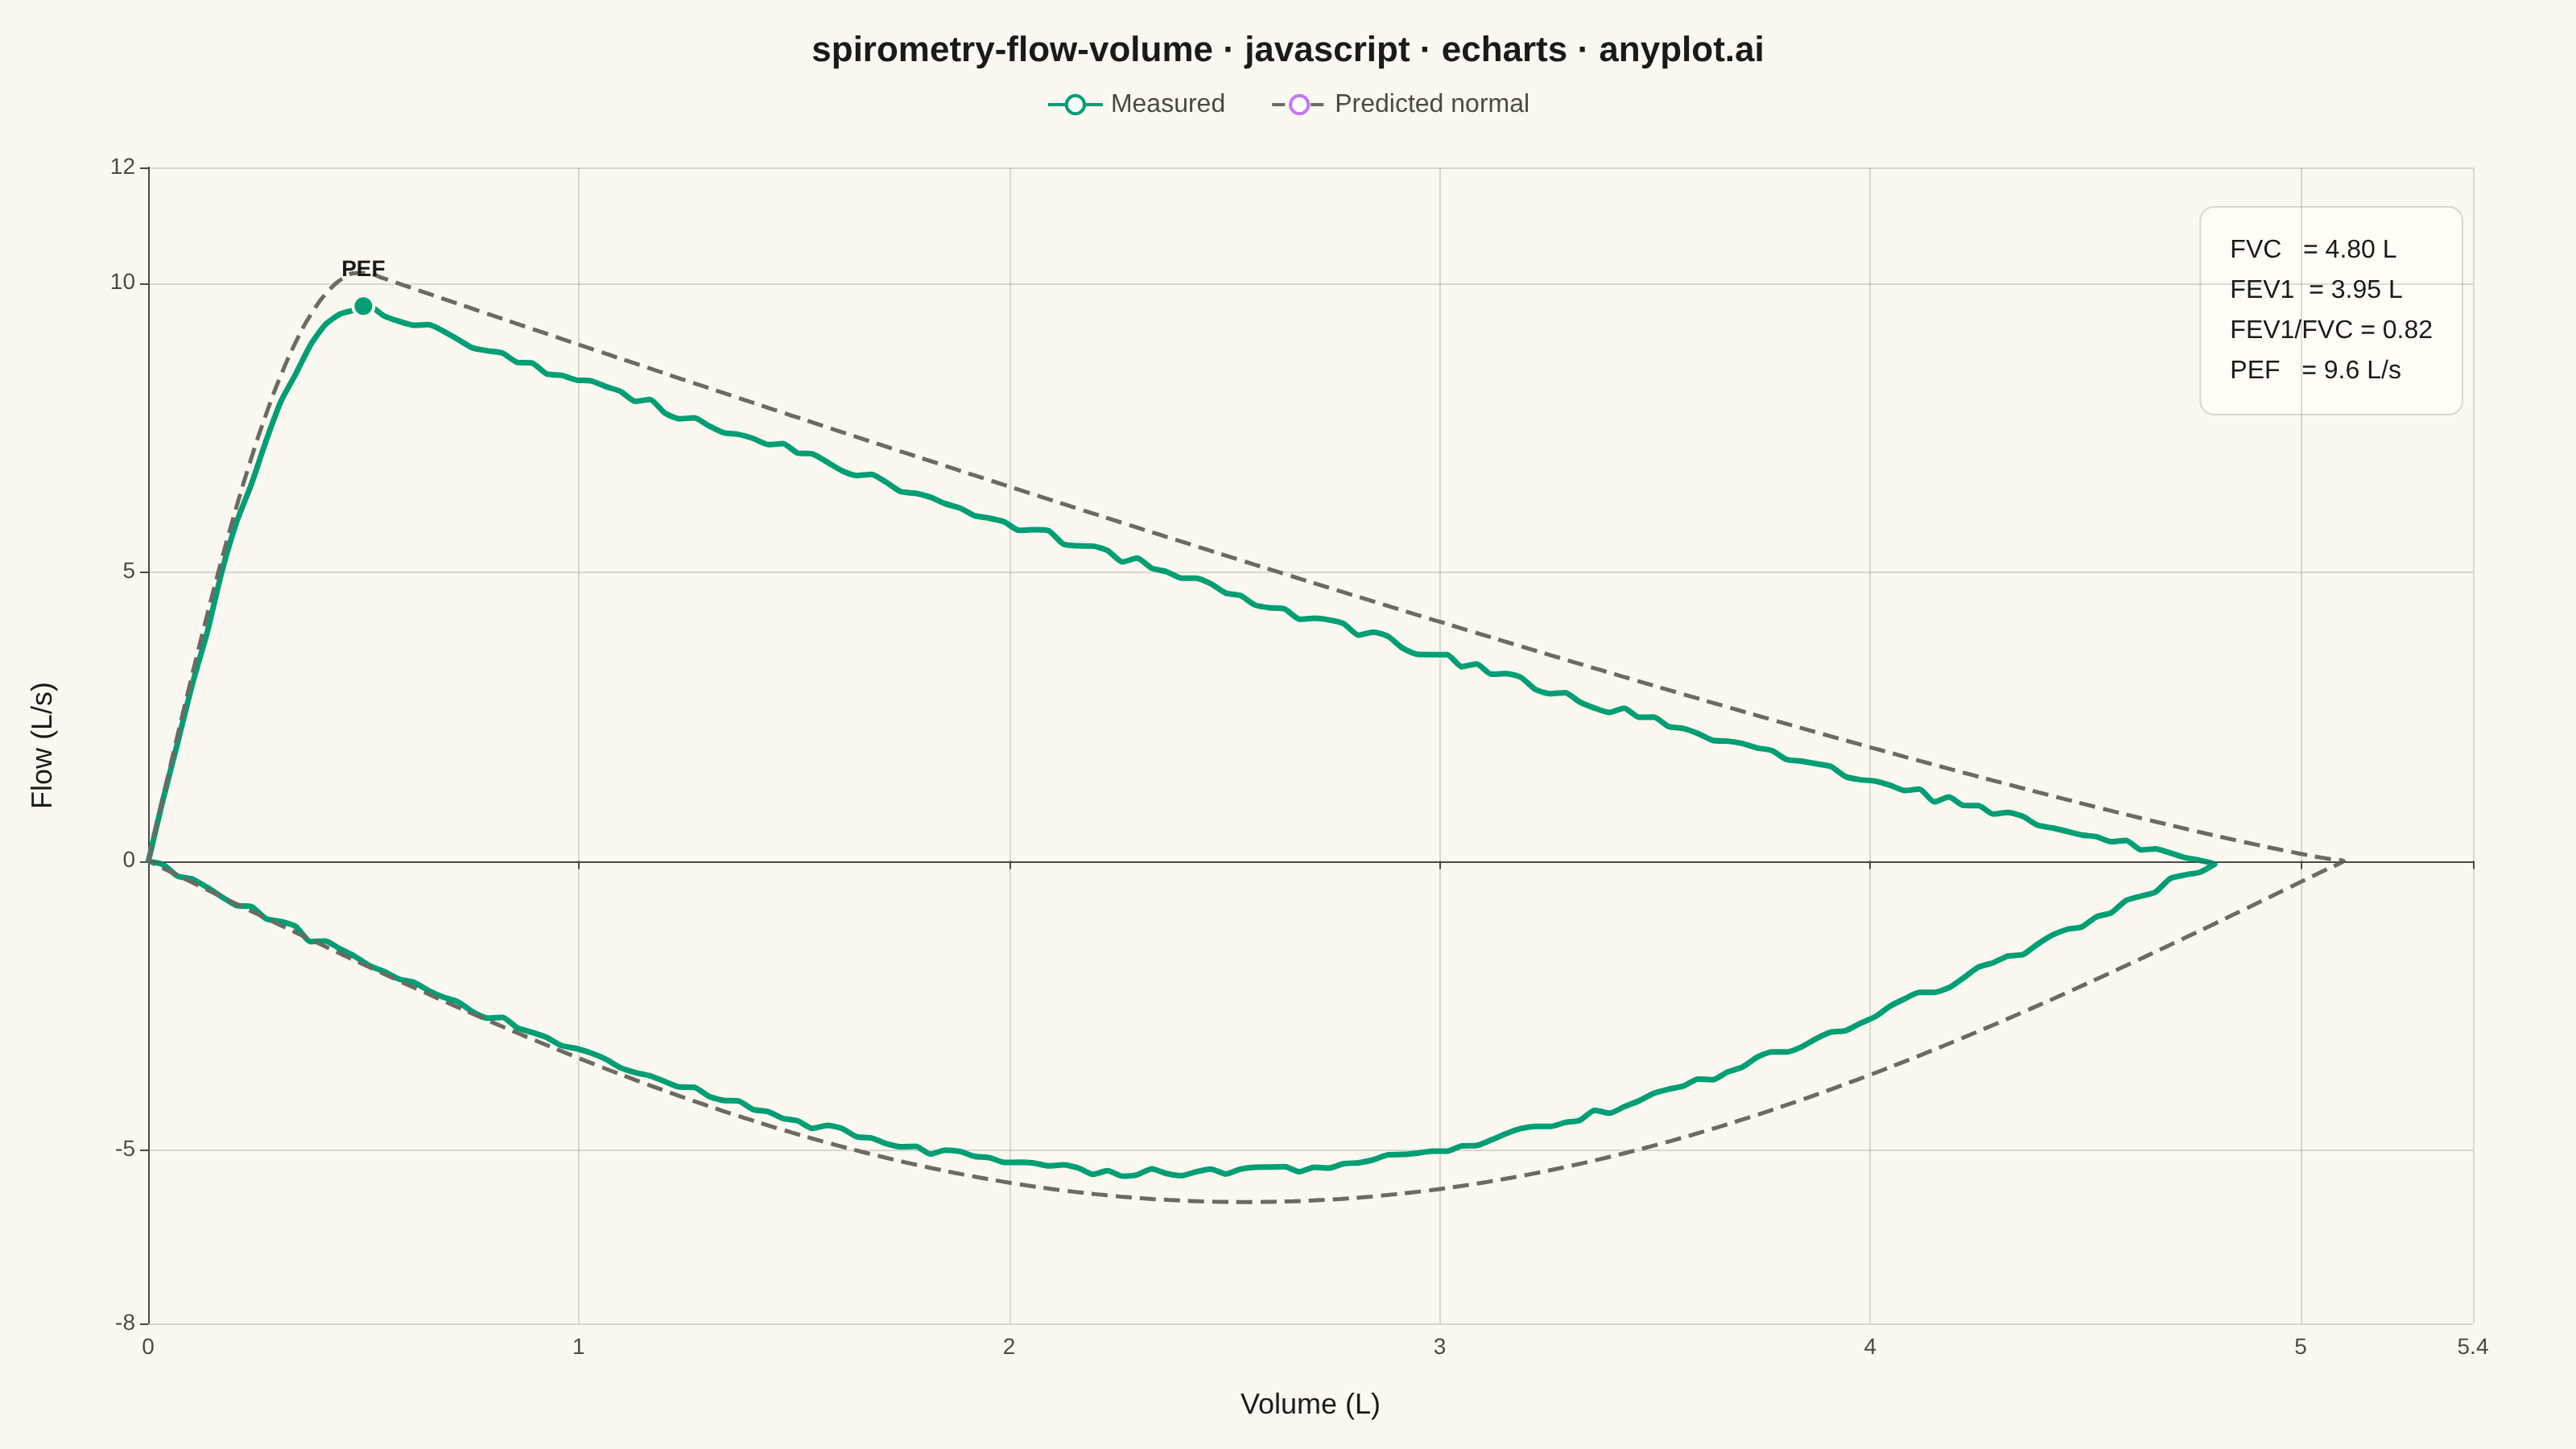
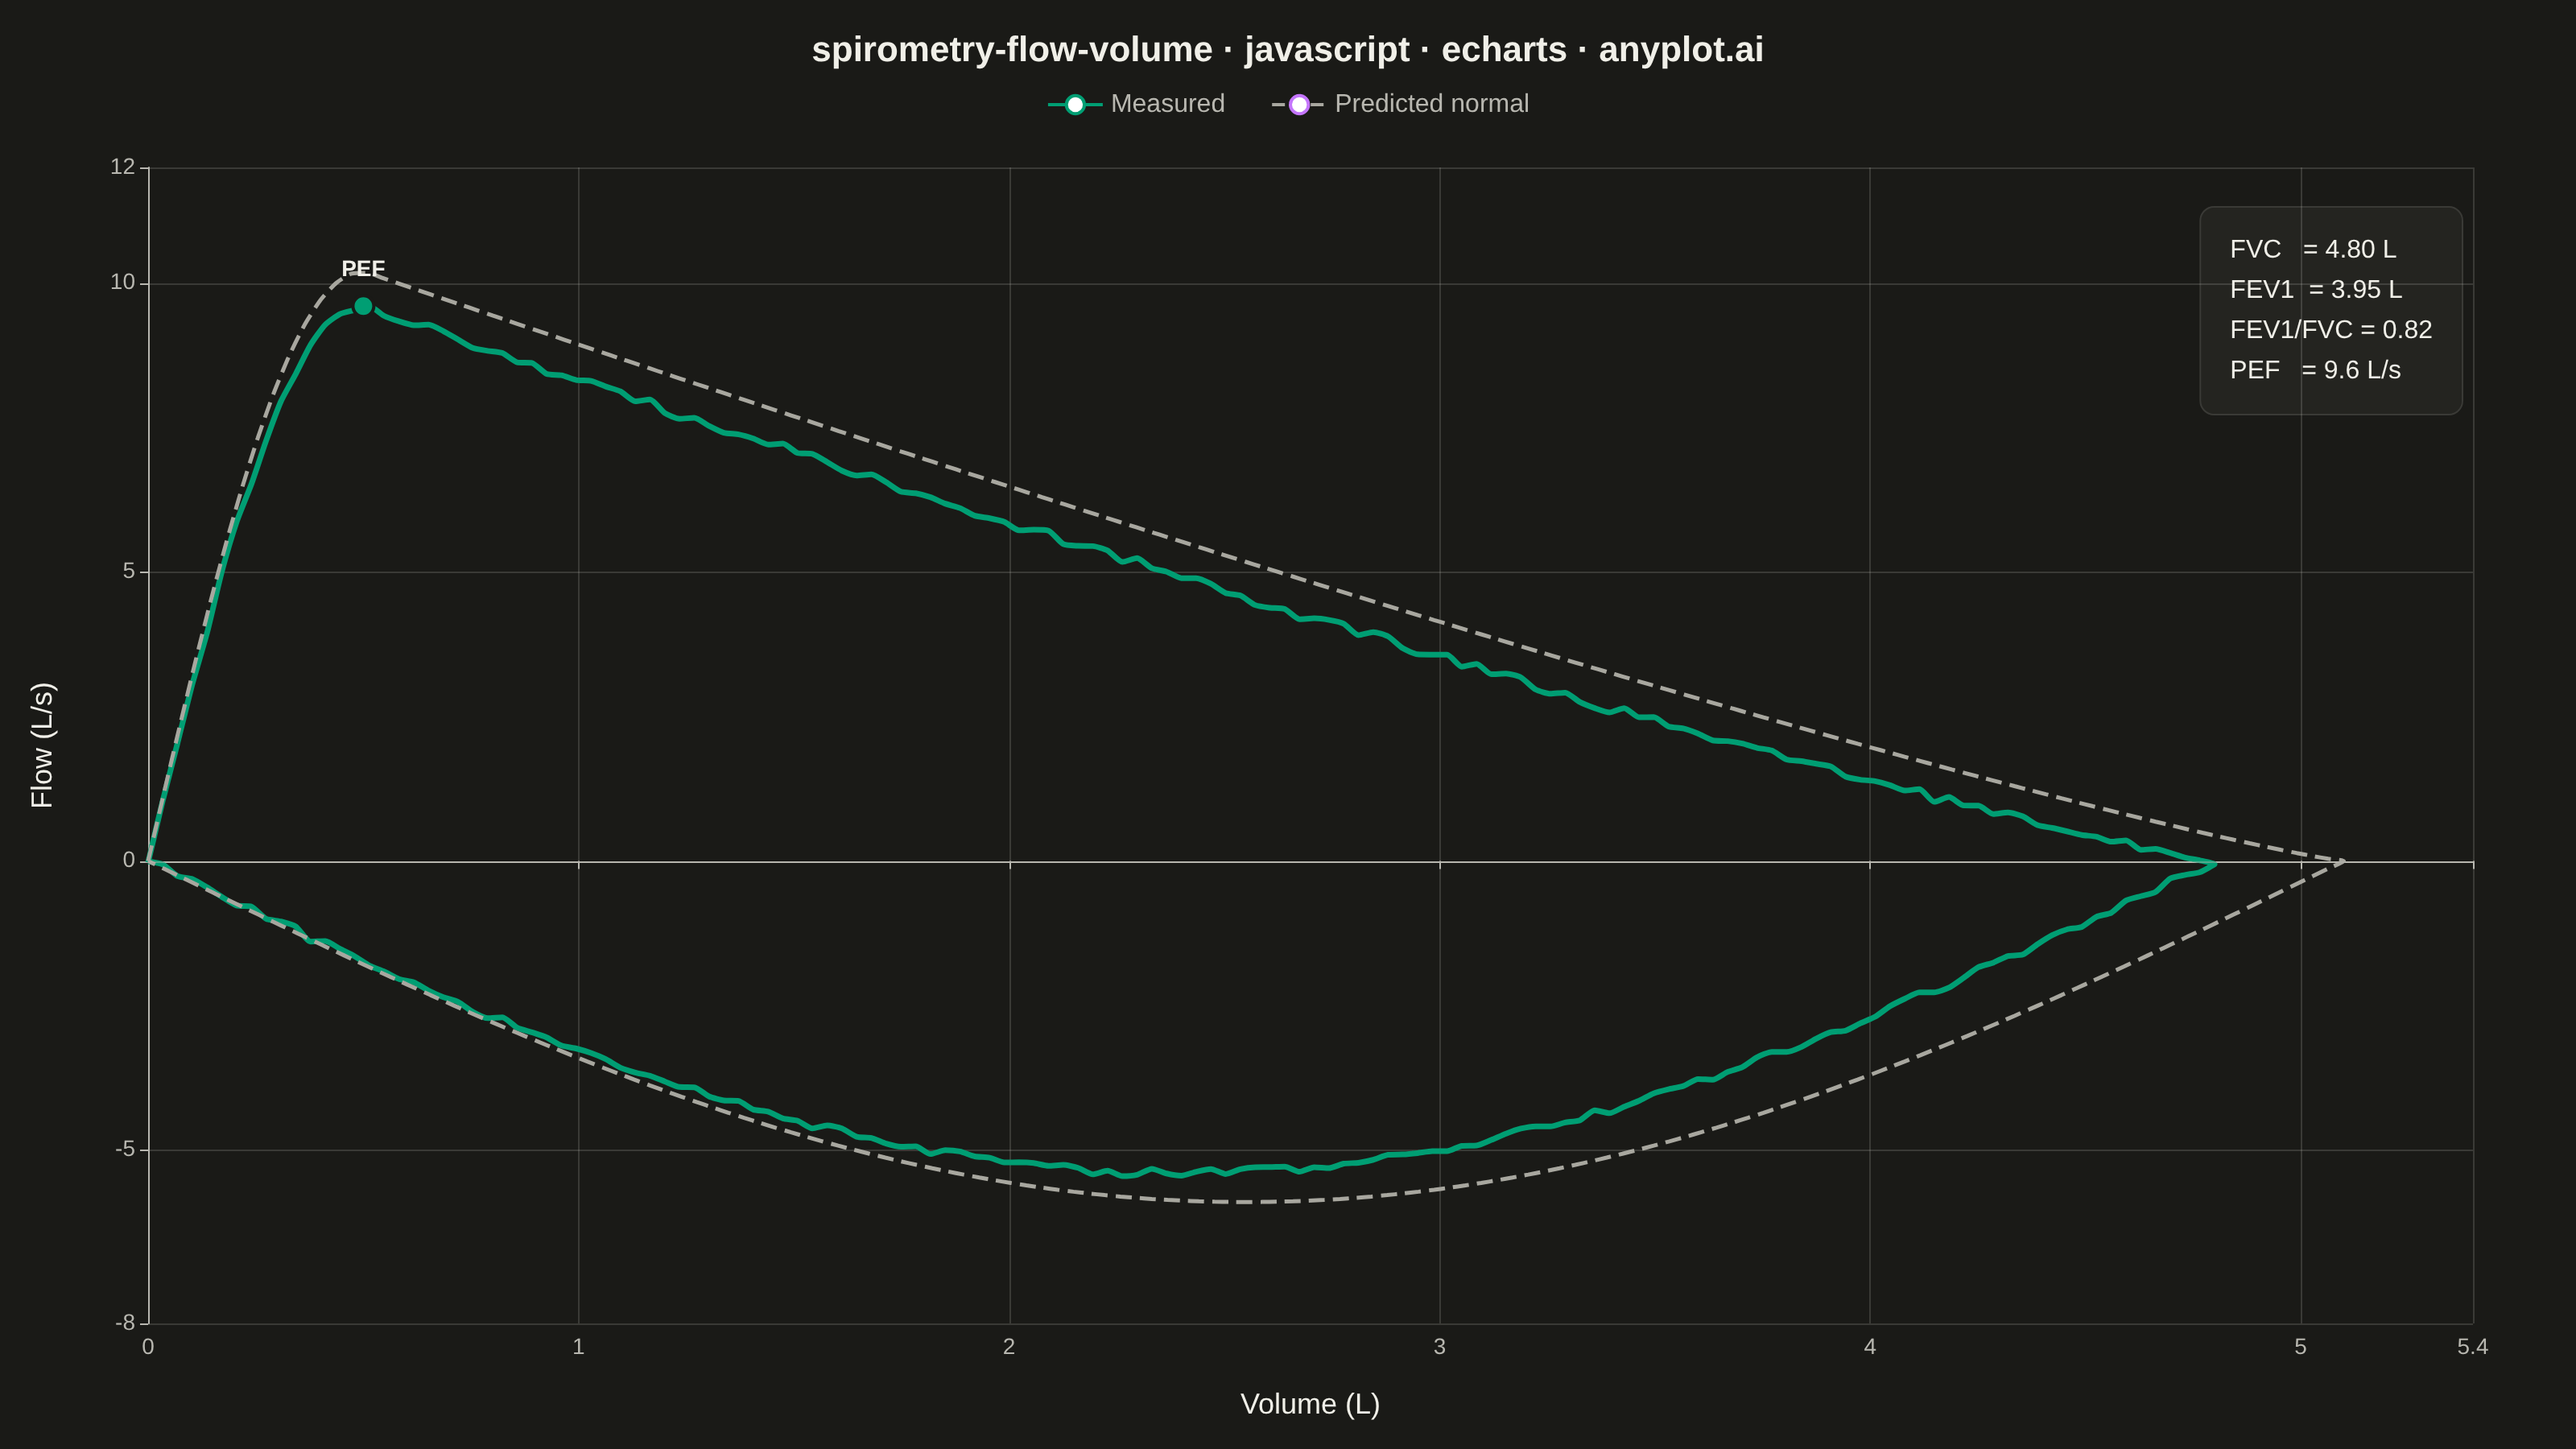
A pulmonary function test visualization that plots airflow rate (L/s) against lung volume (L) during forced expiration and inspiration, forming a characteristic loop shape. The expiratory limb rises sharply to Peak Expiratory Flow (PEF) then declines, while the inspiratory limb forms a more symmetric curve below the x-axis. This plot is essential for diagnosing obstructive and restrictive lung diseases by comparing measured loops against predicted normal values.
// anyplot.ai
// spirometry-flow-volume: Spirometry Flow-Volume Loop
// Library: echarts 5.5.1 | JavaScript 22.22.3
// Quality: 94/100 | Created: 2026-06-17
//# anyplot-orientation: landscape

const t = window.ANYPLOT_TOKENS;
const theme = window.ANYPLOT_THEME;

// Imprint palette + theme-adaptive chrome
const BRAND = t.palette[0]; // #009E73 — measured loop (first series)
const MUTED = theme === "dark" ? "#A8A79F" : "#6B6A63"; // predicted reference (muted anchor)

// --- Data: pulmonary function test, healthy adult ---------------------------
// Flow-volume loop = airflow (L/s) vs exhaled lung volume (L). The expiratory
// limb rises sharply to Peak Expiratory Flow (PEF) then declines; the
// inspiratory limb is a symmetric U below the zero-flow line. A tiny fixed-seed
// LCG adds breath-to-breath jitter so the measured trace reads as real data.
let seed = 20260617;
const rand = () => {
  seed = (seed * 1103515245 + 12345) & 0x7fffffff;
  return seed / 0x7fffffff - 0.5;
};

const N = 140;
const X_PEF = 0.5; // exhaled volume (L) at which PEF occurs

// Expiratory airflow as a function of exhaled volume (rise then linear-ish fall)
const expFlow = (x, fvc, pef) =>
  x <= X_PEF
    ? pef * Math.sin((Math.PI / 2) * (x / X_PEF))
    : pef * Math.pow(Math.max((fvc - x) / (fvc - X_PEF), 0), 1.15);

// Inspiratory airflow (negative, symmetric U) as a function of exhaled volume
const inspFlow = (x, fvc, pif) => -pif * Math.sin(Math.PI * (x / fvc));

// Measured (solid) — closed loop: expiratory 0→FVC, then inspiratory FVC→0
const FVC = 4.8,
  PEF = 9.6,
  PIF = 5.4,
  FEV1 = 3.95;
const measured = [];
for (let i = 0; i <= N; i++) {
  const x = (FVC * i) / N;
  measured.push([x, expFlow(x, FVC, PEF) + rand() * 0.18]);
}
for (let i = N; i >= 0; i--) {
  const x = (FVC * i) / N;
  measured.push([x, inspFlow(x, FVC, PIF) + rand() * 0.15]);
}

// Predicted normal (dashed) — smooth reference loop, slightly larger
const FVC_P = 5.1,
  PEF_P = 10.2,
  PIF_P = 5.9;
const predicted = [];
for (let i = 0; i <= N; i++) {
  const x = (FVC_P * i) / N;
  predicted.push([x, expFlow(x, FVC_P, PEF_P)]);
}
for (let i = N; i >= 0; i--) {
  const x = (FVC_P * i) / N;
  predicted.push([x, inspFlow(x, FVC_P, PIF_P)]);
}

// --- Init -------------------------------------------------------------------
const chart = echarts.init(document.getElementById("container"));

// --- Option -----------------------------------------------------------------
chart.setOption({
  animation: false,
  backgroundColor: "transparent",
  color: t.palette,
  title: {
    text: "spirometry-flow-volume · javascript · echarts · anyplot.ai",
    left: "center",
    top: 16,
    textStyle: { color: t.ink, fontSize: 22, fontWeight: 600 },
  },
  legend: {
    data: ["Measured", "Predicted normal"],
    top: 52,
    left: "center",
    textStyle: { color: t.inkSoft, fontSize: 16 },
    itemWidth: 34,
    itemGap: 28,
  },
  grid: { left: 92, right: 64, top: 104, bottom: 78 },
  xAxis: {
    type: "value",
    name: "Volume (L)",
    nameLocation: "center",
    nameGap: 42,
    nameTextStyle: { color: t.ink, fontSize: 18 },
    min: 0,
    max: 5.4,
    axisLabel: { color: t.inkSoft, fontSize: 14 },
    axisLine: { lineStyle: { color: t.inkSoft } },
    splitLine: { lineStyle: { color: t.grid } },
  },
  yAxis: {
    type: "value",
    name: "Flow (L/s)",
    nameLocation: "center",
    nameGap: 56,
    nameTextStyle: { color: t.ink, fontSize: 18 },
    min: -8,
    max: 12,
    axisLabel: { color: t.inkSoft, fontSize: 14 },
    axisLine: { lineStyle: { color: t.inkSoft } },
    splitLine: { lineStyle: { color: t.grid } },
  },
  series: [
    {
      name: "Measured",
      type: "line",
      data: measured,
      showSymbol: false,
      smooth: 0.2,
      lineStyle: { color: BRAND, width: 3.5 },
      // Zero-flow divider between expiratory (up) and inspiratory (down) limbs
      markLine: {
        silent: true,
        symbol: "none",
        lineStyle: { color: t.inkSoft, type: "solid", width: 1, opacity: 0.45 },
        label: { show: false },
        data: [{ yAxis: 0 }],
      },
      // Peak Expiratory Flow marker
      markPoint: {
        symbol: "circle",
        symbolSize: 13,
        data: [{ coord: [X_PEF, PEF], name: "PEF" }],
        itemStyle: { color: BRAND, borderColor: t.pageBg, borderWidth: 2 },
        label: {
          formatter: "PEF",
          color: t.ink,
          fontSize: 14,
          fontWeight: 600,
          position: "top",
          distance: 8,
        },
      },
    },
    {
      name: "Predicted normal",
      type: "line",
      data: predicted,
      showSymbol: false,
      smooth: 0.2,
      lineStyle: { color: MUTED, width: 2.5, type: "dashed" },
    },
  ],
  // Clinical values callout (text box, per spec)
  graphic: {
    type: "text",
    right: 70,
    top: 128,
    style: {
      text: `FVC   = ${FVC.toFixed(2)} L\nFEV1  = ${FEV1.toFixed(2)} L\nFEV1/FVC = ${(FEV1 / FVC).toFixed(2)}\nPEF   = ${PEF.toFixed(1)} L/s`,
      fill: t.ink,
      font: '500 16px sans-serif',
      lineHeight: 25,
      backgroundColor: t.elevatedBg,
      borderColor: t.grid,
      borderWidth: 1,
      borderRadius: 8,
      padding: [14, 18],
    },
  },
});
Runnable source as JSON, for any HTTP client: https://api.anyplot.ai/specs/spirometry-flow-volume/echarts/code. Any spec id and library id listed in llms-full.txt fit the same URL shape; every URL below is complete and callable.
{
  "spec_id": "spirometry-flow-volume",
  "language": "javascript",
  "library": "echarts",
  "page": "https://anyplot.ai/spirometry-flow-volume/javascript/echarts",
  "hub": "https://anyplot.ai/spirometry-flow-volume",
  "code_json": "https://api.anyplot.ai/specs/spirometry-flow-volume/echarts/code",
  "spec_json": "https://api.anyplot.ai/specs/spirometry-flow-volume",
  "render_light_png": "https://storage.googleapis.com/anyplot-images/plots/spirometry-flow-volume/javascript/echarts/plot-light.png",
  "render_dark_png": "https://storage.googleapis.com/anyplot-images/plots/spirometry-flow-volume/javascript/echarts/plot-dark.png",
  "interactive_light_html": "https://storage.googleapis.com/anyplot-images/plots/spirometry-flow-volume/javascript/echarts/plot-light.html",
  "interactive_dark_html": "https://storage.googleapis.com/anyplot-images/plots/spirometry-flow-volume/javascript/echarts/plot-dark.html",
  "quality_score": 94.0,
  "license": "MIT",
  "guide": "https://anyplot.ai/llms.txt"
}
Part of Spirometry Flow-Volume Loop on anyplot.ai.