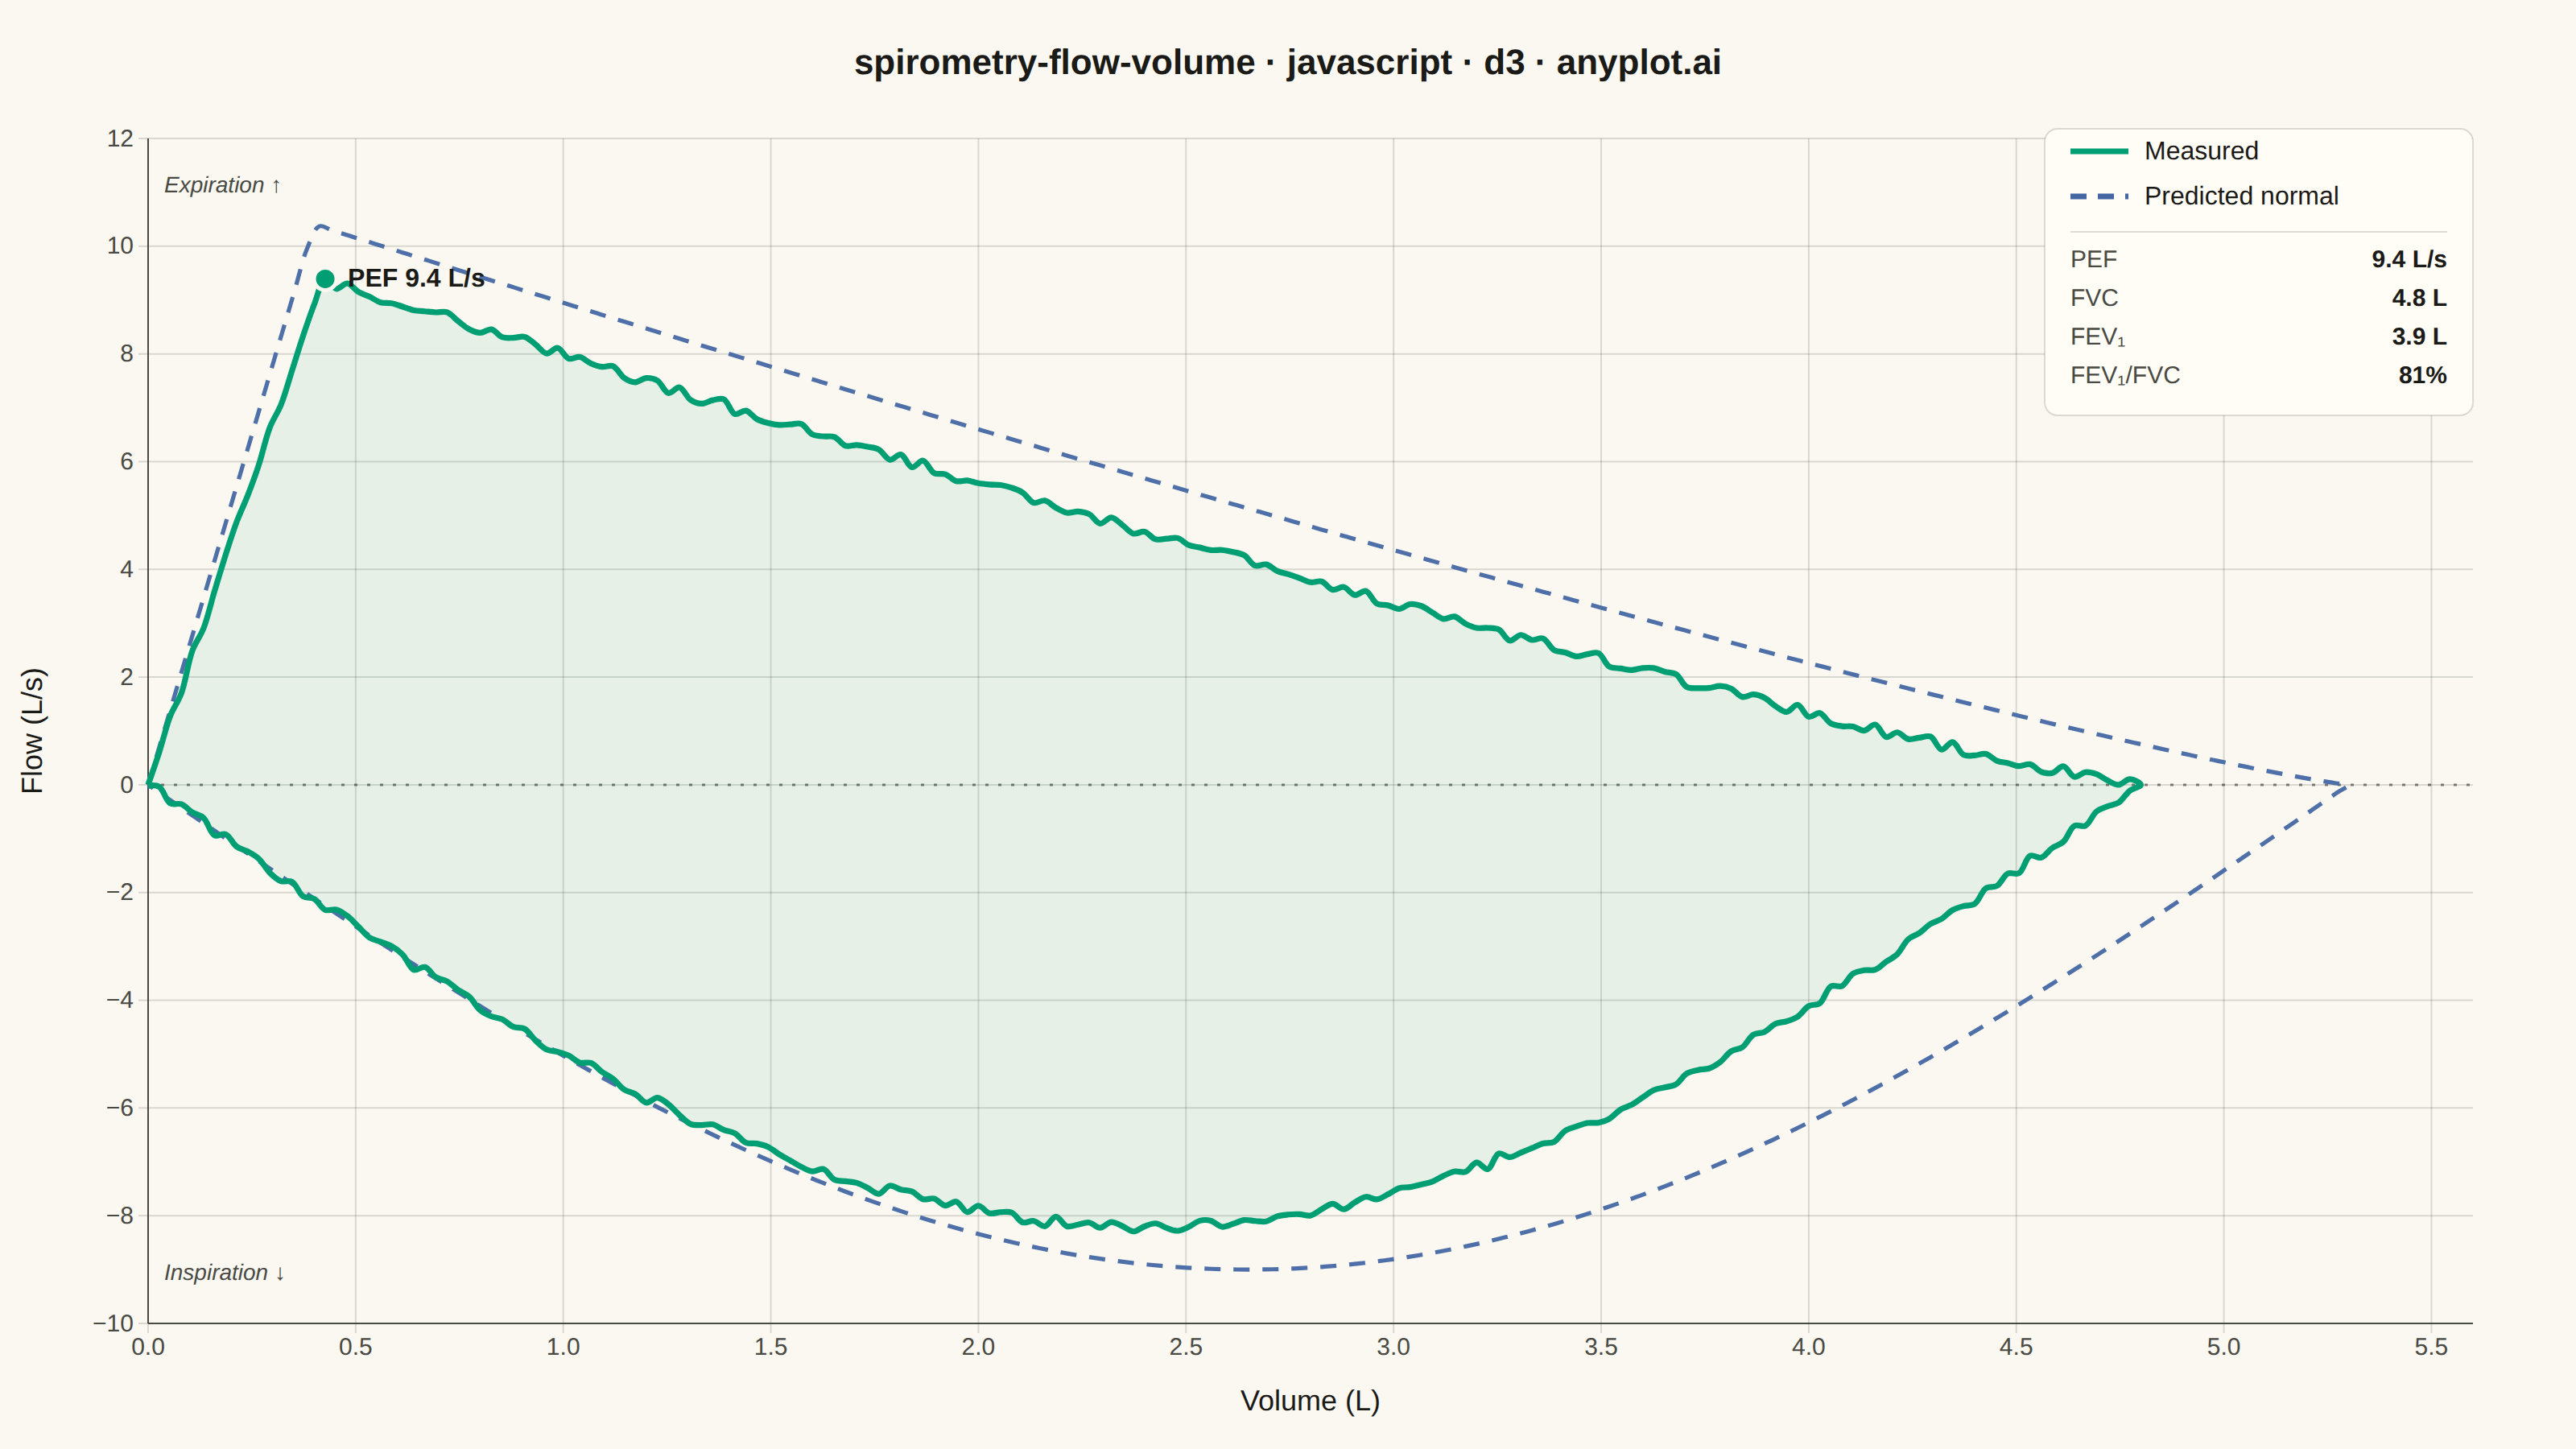
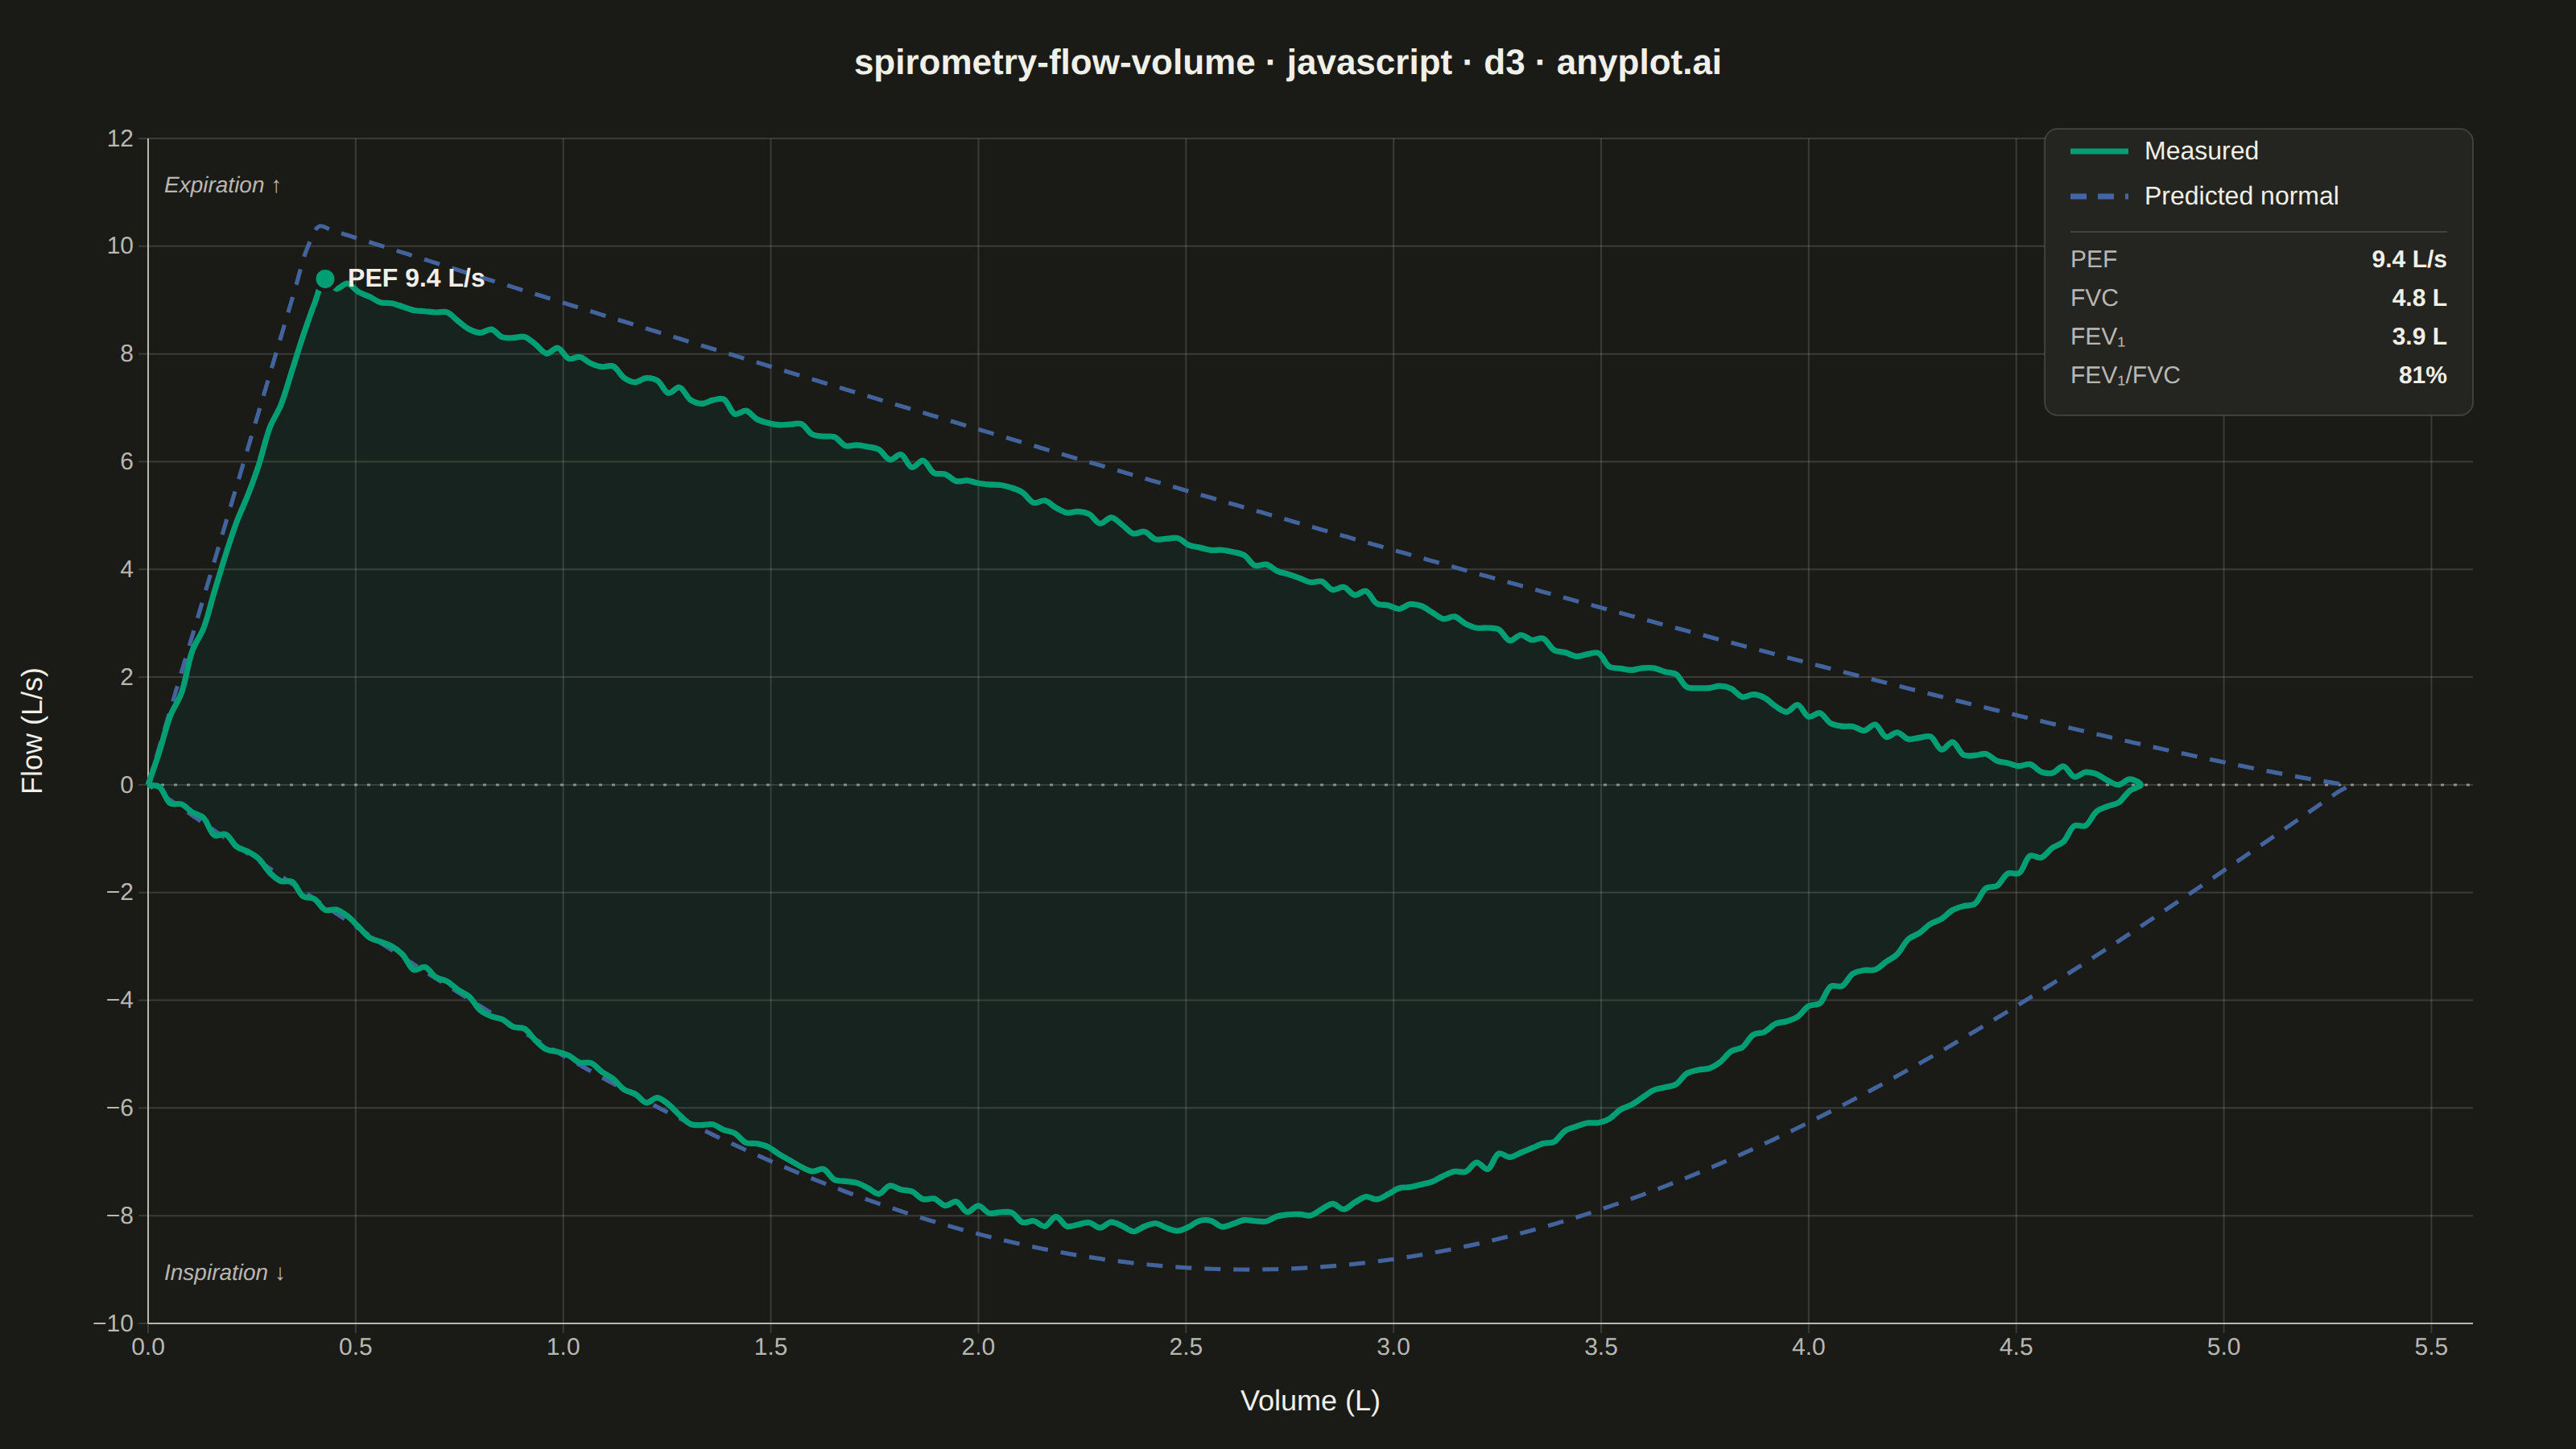
A pulmonary function test visualization that plots airflow rate (L/s) against lung volume (L) during forced expiration and inspiration, forming a characteristic loop shape. The expiratory limb rises sharply to Peak Expiratory Flow (PEF) then declines, while the inspiratory limb forms a more symmetric curve below the x-axis. This plot is essential for diagnosing obstructive and restrictive lung diseases by comparing measured loops against predicted normal values.
// anyplot.ai
// spirometry-flow-volume: Spirometry Flow-Volume Loop
// Library: d3 7.9.0 | JavaScript 22.22.3
// Quality: 93/100 | Created: 2026-06-17
//# anyplot-orientation: landscape
// anyplot.ai
// spirometry-flow-volume: Spirometry Flow-Volume Loop
// Library: d3 7.9.0 | JavaScript 22
// Quality: pending | Created: 2026-06-17

const t = window.ANYPLOT_TOKENS;
const { width, height } = window.ANYPLOT_SIZE;
const margin = { top: 86, right: 64, bottom: 78, left: 92 };
const iw = width - margin.left - margin.right;
const ih = height - margin.top - margin.bottom;

// --- Data (in-memory, deterministic) ---------------------------------------
// A forced expiration/inspiration flow-volume loop. The expiratory limb rises
// sharply to Peak Expiratory Flow (PEF) then declines roughly linearly; the
// inspiratory limb is a symmetric U below the zero-flow line. We build a
// measured loop and a predicted-normal reference loop for comparison.
let seed = 20260617;
function rand() {
  seed = (seed * 1664525 + 1013904223) % 4294967296;
  return seed / 4294967296;
}

function flowVolumeLoop(fvc, pef, pif, vPef, jitter) {
  const N = 180;
  const pts = [];
  // Expiratory limb: volume 0 -> FVC (sharp rise to PEF, linear-ish decline).
  for (let i = 0; i <= N; i++) {
    const v = (fvc * i) / N;
    let f;
    if (v < vPef) f = pef * (v / vPef);
    else f = pef * Math.pow(1 - (v - vPef) / (fvc - vPef), 1.15);
    f += (rand() - 0.5) * jitter;
    pts.push({ volume: v, flow: Math.max(f, 0) });
  }
  // Inspiratory limb: volume FVC -> 0 (symmetric U, negative flow).
  for (let i = 1; i <= N; i++) {
    const v = fvc - (fvc * i) / N;
    let f = -pif * Math.sin((Math.PI * v) / fvc);
    f += (rand() - 0.5) * jitter;
    pts.push({ volume: v, flow: Math.min(f, 0) });
  }
  return pts;
}

const measured = flowVolumeLoop(4.8, 9.4, 8.2, 0.42, 0.22);
const predicted = flowVolumeLoop(5.3, 10.4, 9.0, 0.4, 0.0);

// Clinical summary values (measured).
const clinical = [
  { label: "PEF", value: "9.4 L/s" },
  { label: "FVC", value: "4.8 L" },
  { label: "FEV₁", value: "3.9 L" },
  { label: "FEV₁/FVC", value: "81%" },
];
const pefPoint = measured.reduce((a, b) => (b.flow > a.flow ? b : a));

// --- SVG mount --------------------------------------------------------------
const svg = d3
  .select("#container")
  .append("svg")
  .attr("width", width)
  .attr("height", height);
const g = svg
  .append("g")
  .attr("transform", `translate(${margin.left},${margin.top})`);

// --- Scales -----------------------------------------------------------------
const x = d3.scaleLinear().domain([0, 5.6]).range([0, iw]);
const y = d3.scaleLinear().domain([-10, 12]).nice().range([ih, 0]);

const line = d3
  .line()
  .x((d) => x(d.volume))
  .y((d) => y(d.flow))
  .curve(d3.curveCatmullRom.alpha(0.5));

// --- Gridlines --------------------------------------------------------------
g.append("g")
  .selectAll("line.gx")
  .data(x.ticks(8))
  .join("line")
  .attr("x1", (d) => x(d))
  .attr("x2", (d) => x(d))
  .attr("y1", 0)
  .attr("y2", ih)
  .attr("stroke", t.grid)
  .attr("stroke-width", 1);
g.append("g")
  .selectAll("line.gy")
  .data(y.ticks(8))
  .join("line")
  .attr("x1", 0)
  .attr("x2", iw)
  .attr("y1", (d) => y(d))
  .attr("y2", (d) => y(d))
  .attr("stroke", t.grid)
  .attr("stroke-width", 1);

// Zero-flow reference line (separates expiratory from inspiratory limb).
g.append("line")
  .attr("x1", 0)
  .attr("x2", iw)
  .attr("y1", y(0))
  .attr("y2", y(0))
  .attr("stroke", t.inkSoft)
  .attr("stroke-width", 1.5)
  .attr("stroke-dasharray", "2 6")
  .attr("opacity", 0.7);

// --- Axes -------------------------------------------------------------------
const xAxis = g
  .append("g")
  .attr("transform", `translate(0,${ih})`)
  .call(d3.axisBottom(x).ticks(8).tickSizeOuter(0));
const yAxis = g.append("g").call(d3.axisLeft(y).ticks(8).tickSizeOuter(0));
for (const ax of [xAxis, yAxis]) {
  ax.selectAll("text").attr("fill", t.inkSoft).style("font-size", "15px");
  ax.selectAll("line").attr("stroke", t.grid);
  ax.select(".domain").attr("stroke", t.inkSoft);
}

// --- Predicted normal loop (dashed reference) -------------------------------
g.append("path")
  .datum(predicted)
  .attr("fill", "none")
  .attr("stroke", t.palette[2])
  .attr("stroke-width", 2.6)
  .attr("stroke-dasharray", "10 8")
  .attr("stroke-linejoin", "round")
  .attr("opacity", 0.95)
  .attr("d", line);

// --- Measured loop (solid, brand green) -------------------------------------
g.append("path")
  .datum(measured)
  .attr("fill", t.palette[0])
  .attr("fill-opacity", 0.08)
  .attr("stroke", t.palette[0])
  .attr("stroke-width", 3.6)
  .attr("stroke-linejoin", "round")
  .attr("d", line);

// --- PEF marker -------------------------------------------------------------
g.append("circle")
  .attr("cx", x(pefPoint.volume))
  .attr("cy", y(pefPoint.flow))
  .attr("r", 7)
  .attr("fill", t.palette[0])
  .attr("stroke", t.pageBg)
  .attr("stroke-width", 2.5);
g.append("text")
  .attr("x", x(pefPoint.volume) + 14)
  .attr("y", y(pefPoint.flow) + 5)
  .attr("fill", t.ink)
  .style("font-size", "16px")
  .style("font-weight", "600")
  .text("PEF 9.4 L/s");

// --- Axis labels ------------------------------------------------------------
svg
  .append("text")
  .attr("x", margin.left + iw / 2)
  .attr("y", height - 24)
  .attr("text-anchor", "middle")
  .attr("fill", t.ink)
  .style("font-size", "18px")
  .text("Volume (L)");
svg
  .append("text")
  .attr("transform", "rotate(-90)")
  .attr("x", -(margin.top + ih / 2))
  .attr("y", 26)
  .attr("text-anchor", "middle")
  .attr("fill", t.ink)
  .style("font-size", "18px")
  .text("Flow (L/s)");

// Expiration / Inspiration limb hints along the y-axis.
g.append("text")
  .attr("x", 10)
  .attr("y", y(11))
  .attr("fill", t.inkSoft)
  .style("font-size", "14px")
  .style("font-style", "italic")
  .text("Expiration ↑");
g.append("text")
  .attr("x", 10)
  .attr("y", y(-9.2))
  .attr("fill", t.inkSoft)
  .style("font-size", "14px")
  .style("font-style", "italic")
  .text("Inspiration ↓");

// --- Legend + clinical callout (upper-right, away from the curves) ----------
const legend = g.append("g").attr("transform", `translate(${iw - 250},${8})`);
legend
  .append("rect")
  .attr("x", -16)
  .attr("y", -14)
  .attr("width", 266)
  .attr("height", 178)
  .attr("rx", 8)
  .attr("fill", t.elevatedBg)
  .attr("stroke", t.grid)
  .attr("stroke-width", 1);

const entries = [
  { color: t.palette[0], dash: null, text: "Measured" },
  { color: t.palette[2], dash: "10 7", text: "Predicted normal" },
];
entries.forEach((e, i) => {
  const yy = i * 28;
  legend
    .append("line")
    .attr("x1", 0)
    .attr("x2", 36)
    .attr("y1", yy)
    .attr("y2", yy)
    .attr("stroke", e.color)
    .attr("stroke-width", 3.6)
    .attr("stroke-dasharray", e.dash);
  legend
    .append("text")
    .attr("x", 46)
    .attr("y", yy + 5)
    .attr("fill", t.ink)
    .style("font-size", "16px")
    .text(e.text);
});

legend
  .append("line")
  .attr("x1", 0)
  .attr("x2", 234)
  .attr("y1", 50)
  .attr("y2", 50)
  .attr("stroke", t.grid)
  .attr("stroke-width", 1);
clinical.forEach((c, i) => {
  const yy = 72 + i * 24;
  legend
    .append("text")
    .attr("x", 0)
    .attr("y", yy)
    .attr("fill", t.inkSoft)
    .style("font-size", "15px")
    .text(c.label);
  legend
    .append("text")
    .attr("x", 234)
    .attr("y", yy)
    .attr("text-anchor", "end")
    .attr("fill", t.ink)
    .style("font-size", "15px")
    .style("font-weight", "600")
    .text(c.value);
});

// --- Title ------------------------------------------------------------------
svg
  .append("text")
  .attr("x", width / 2)
  .attr("y", 46)
  .attr("text-anchor", "middle")
  .attr("fill", t.ink)
  .style("font-size", "22px")
  .style("font-weight", "600")
  .text("spirometry-flow-volume · javascript · d3 · anyplot.ai");
Runnable source as JSON, for any HTTP client: https://api.anyplot.ai/specs/spirometry-flow-volume/d3/code. Any spec id and library id listed in llms-full.txt fit the same URL shape; every URL below is complete and callable.
{
  "spec_id": "spirometry-flow-volume",
  "language": "javascript",
  "library": "d3",
  "page": "https://anyplot.ai/spirometry-flow-volume/javascript/d3",
  "hub": "https://anyplot.ai/spirometry-flow-volume",
  "code_json": "https://api.anyplot.ai/specs/spirometry-flow-volume/d3/code",
  "spec_json": "https://api.anyplot.ai/specs/spirometry-flow-volume",
  "render_light_png": "https://storage.googleapis.com/anyplot-images/plots/spirometry-flow-volume/javascript/d3/plot-light.png",
  "render_dark_png": "https://storage.googleapis.com/anyplot-images/plots/spirometry-flow-volume/javascript/d3/plot-dark.png",
  "interactive_light_html": "https://storage.googleapis.com/anyplot-images/plots/spirometry-flow-volume/javascript/d3/plot-light.html",
  "interactive_dark_html": "https://storage.googleapis.com/anyplot-images/plots/spirometry-flow-volume/javascript/d3/plot-dark.html",
  "quality_score": 93.0,
  "license": "MIT",
  "guide": "https://anyplot.ai/llms.txt"
}
Part of Spirometry Flow-Volume Loop on anyplot.ai.