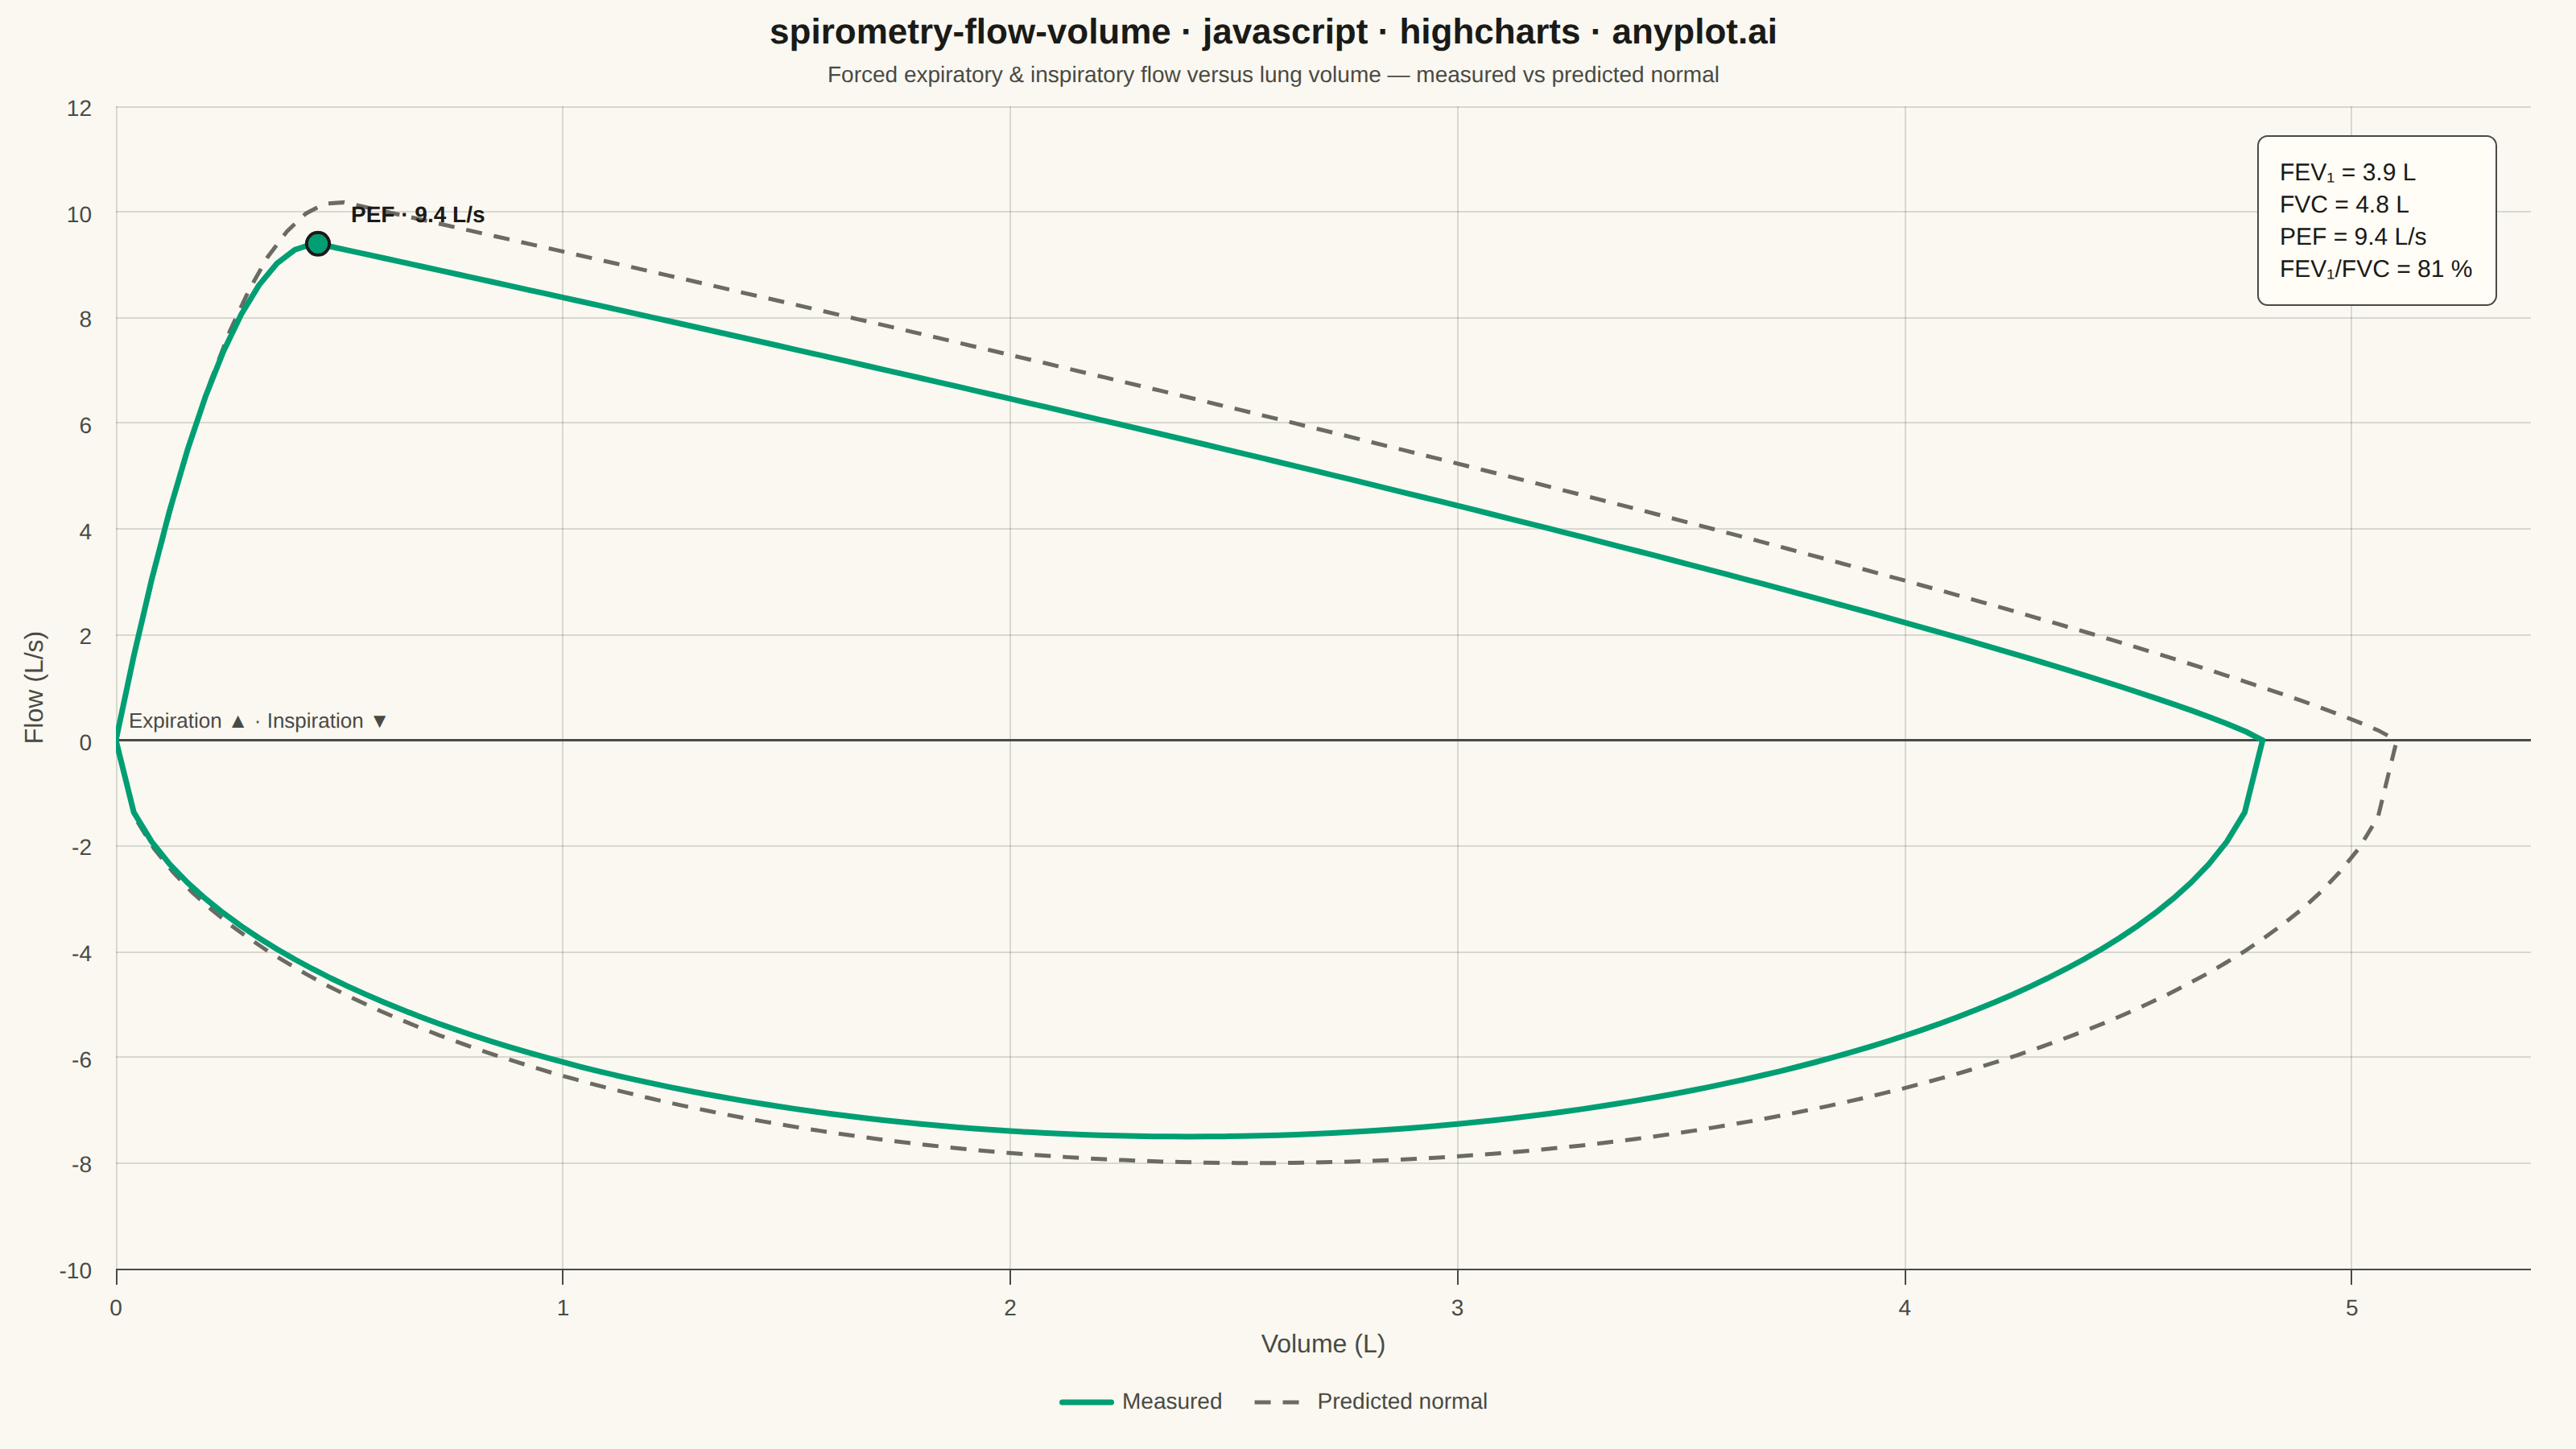
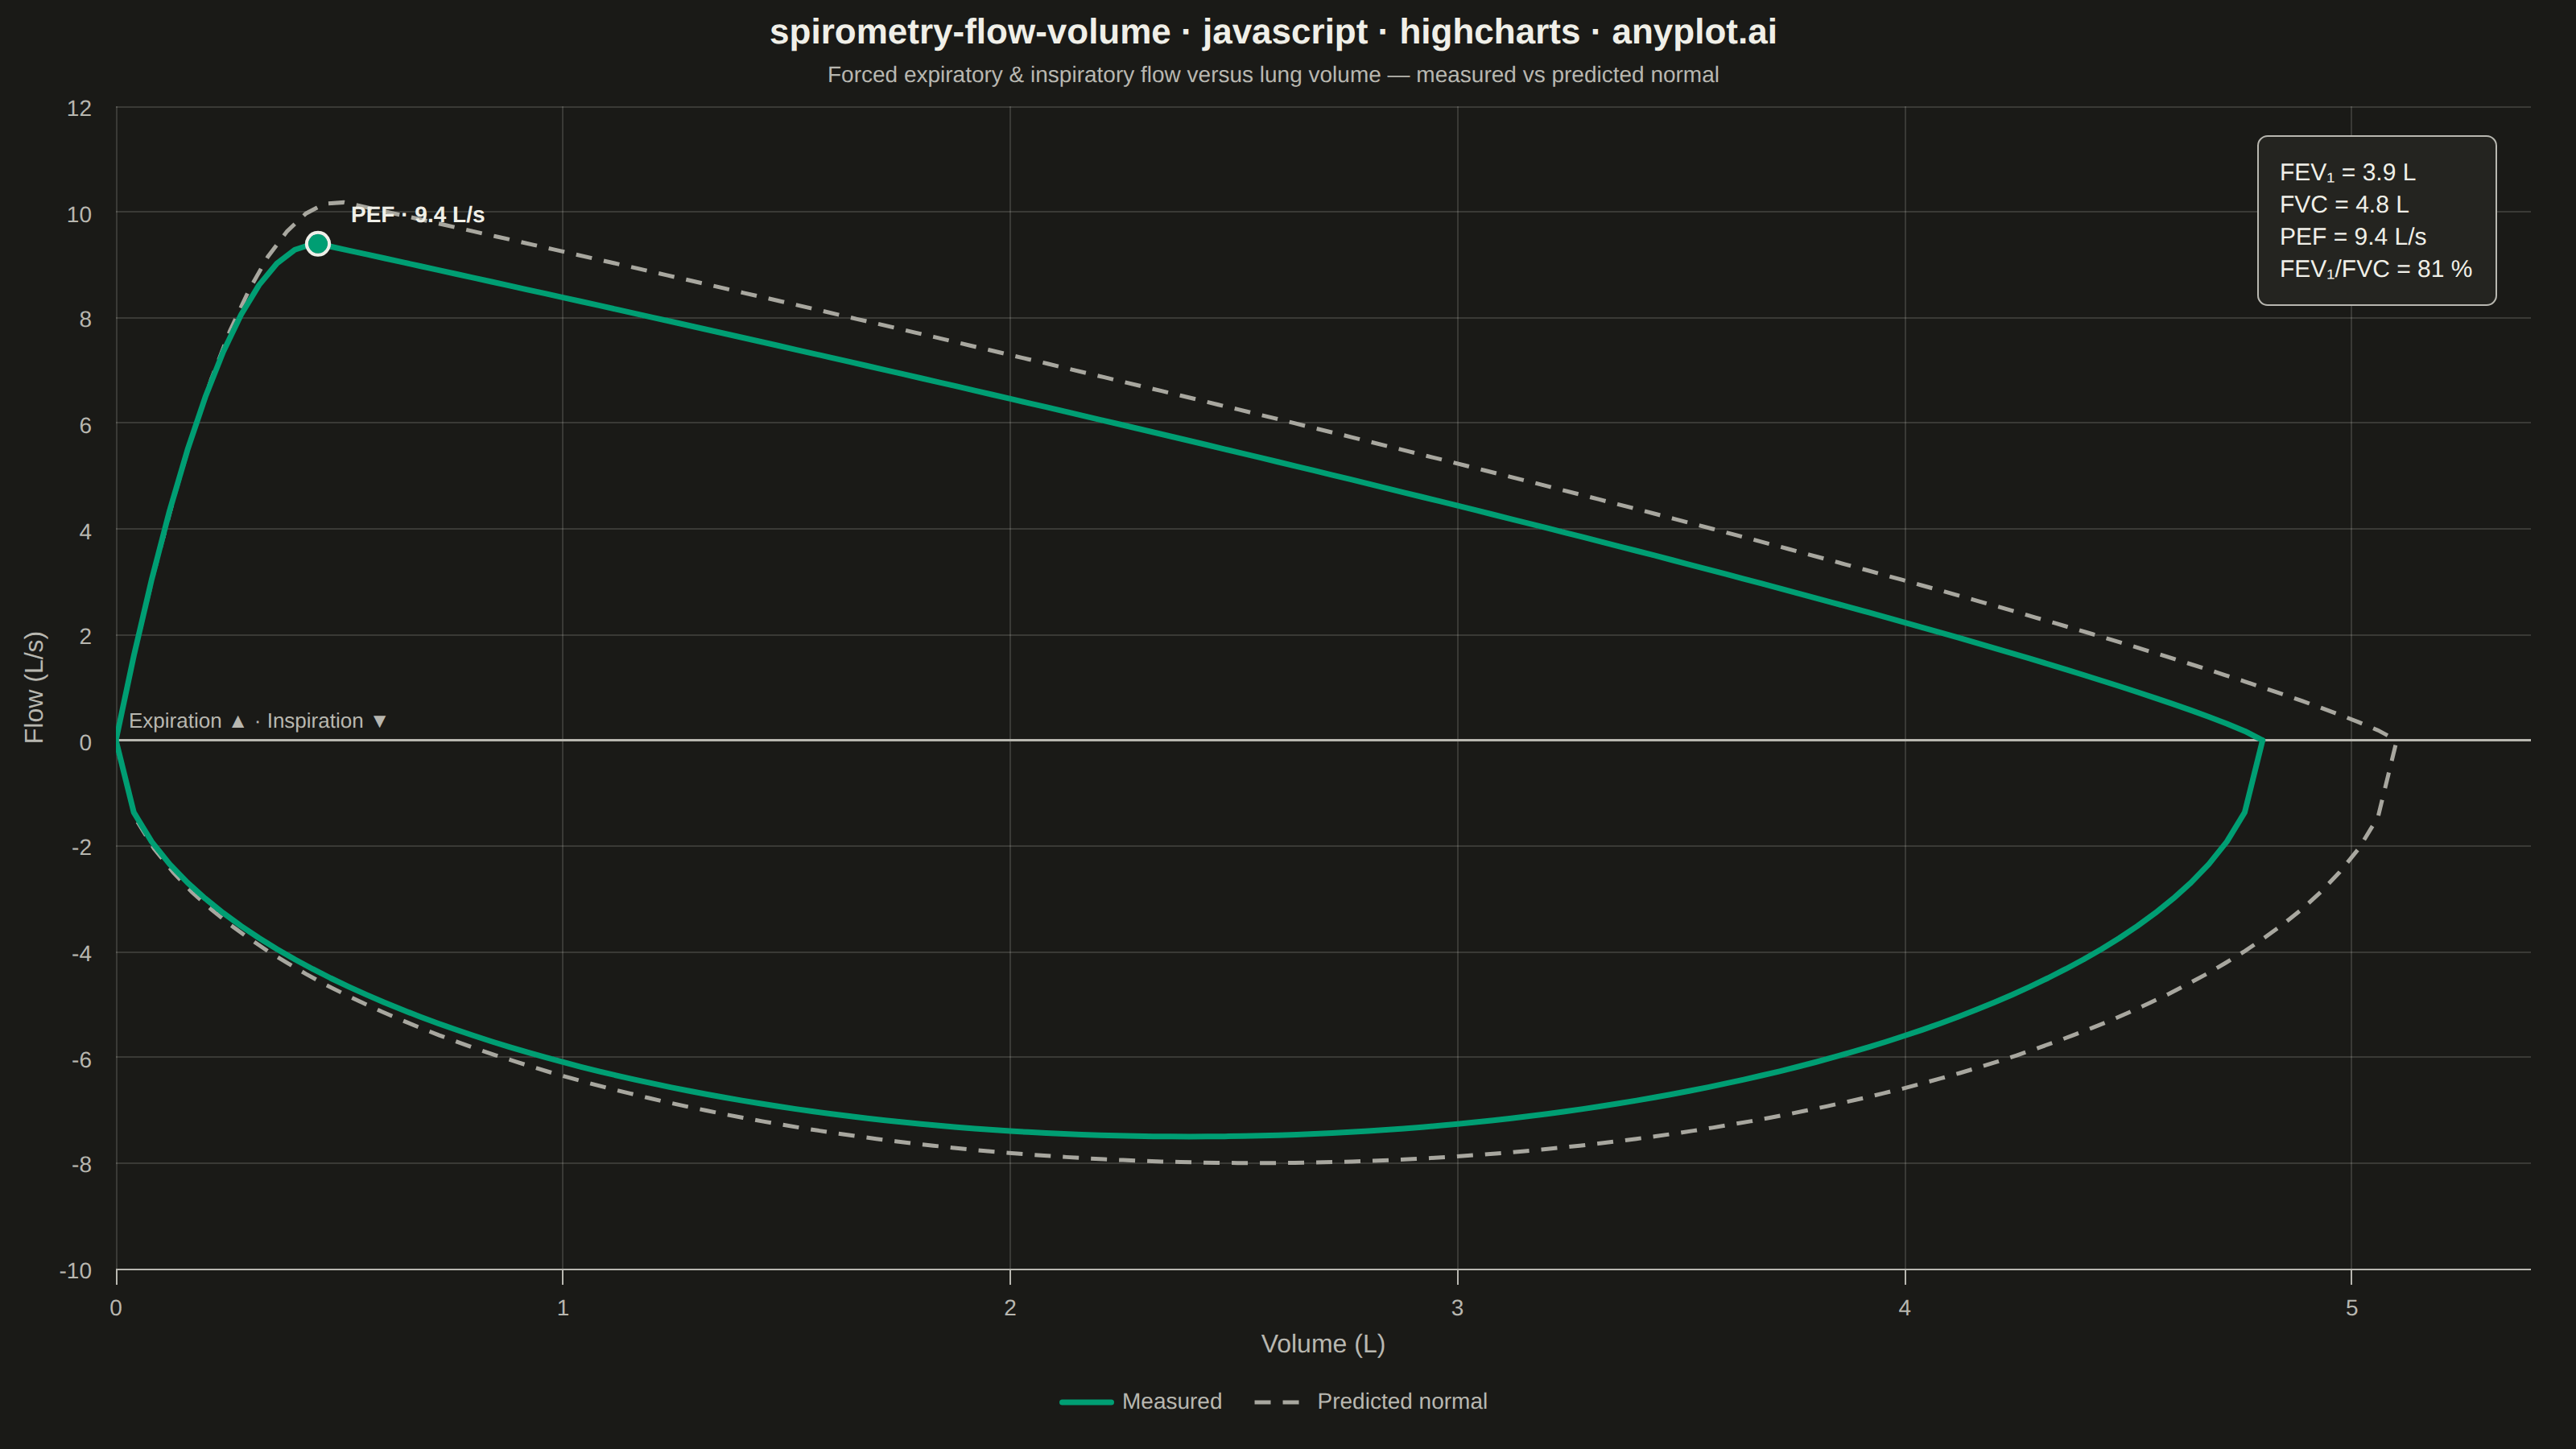
A pulmonary function test visualization that plots airflow rate (L/s) against lung volume (L) during forced expiration and inspiration, forming a characteristic loop shape. The expiratory limb rises sharply to Peak Expiratory Flow (PEF) then declines, while the inspiratory limb forms a more symmetric curve below the x-axis. This plot is essential for diagnosing obstructive and restrictive lung diseases by comparing measured loops against predicted normal values.
// anyplot.ai
// spirometry-flow-volume: Spirometry Flow-Volume Loop
// Library: highcharts 12.6.0 | JavaScript 22.22.3
// Quality: 92/100 | Created: 2026-06-17
//# anyplot-orientation: landscape

const t = window.ANYPLOT_TOKENS;
const dark = window.ANYPLOT_THEME === "dark";

// Theme-adaptive chrome (Imprint palette + tokens)
const BRAND = t.palette[0]; // #009E73 — measured loop, ALWAYS first series
const INK = t.ink;
const INK_SOFT = t.inkSoft;
const RULE = t.grid;
const ELEVATED_BG = t.elevatedBg;
const MUTED = dark ? "#A8A79F" : "#6B6A63"; // predicted-normal reference overlay

// --- Data (in-memory, deterministic clinical spirometry curves) -------------
// A healthy adult forced expiration/inspiration manoeuvre and the predicted
// normal reference. Volume (L) on x, flow (L/s) on y; the expiratory limb is
// positive (sharp rise to PEF, near-linear decline), the inspiratory limb is a
// symmetric U below the zero-flow line. Both limbs are stored ascending in
// volume so Highcharts draws each as a sorted line; the two limbs share their
// endpoints (0,0) and (FVC,0), closing the loop.
const round = (v, d) => Math.round(v * 10 ** d) / 10 ** d;

function expiratoryLimb(fvc, pef, vpef, n) {
  const pts = [];
  for (let i = 0; i <= n; i++) {
    const v = (fvc * i) / n;
    let f;
    if (v <= vpef) {
      const r = v / vpef; // steep ease-out rise to Peak Expiratory Flow
      f = pef * (1 - (1 - r) * (1 - r));
    } else {
      const r = Math.max((fvc - v) / (fvc - vpef), 0); // slightly convex decline
      f = pef * Math.pow(r, 0.85);
    }
    pts.push([round(v, 3), round(f, 3)]);
  }
  return pts;
}

function inspiratoryLimb(fvc, pif, n) {
  const pts = [];
  for (let i = 0; i <= n; i++) {
    const v = (fvc * i) / n;
    const x = (v - fvc / 2) / (fvc / 2); // -1..1 → symmetric semicircle
    const f = -pif * Math.sqrt(Math.max(0, 1 - x * x));
    pts.push([round(v, 3), round(f, 3)]);
  }
  return pts;
}

// Measured manoeuvre (mild values within normal range)
const MEAS = { fvc: 4.8, pef: 9.4, vpef: 0.45, pif: 7.5, fev1: 3.9 };
// Predicted normal reference
const PRED = { fvc: 5.1, pef: 10.2, vpef: 0.5, pif: 8.0 };

const measExp = expiratoryLimb(MEAS.fvc, MEAS.pef, MEAS.vpef, 120);
const measInsp = inspiratoryLimb(MEAS.fvc, MEAS.pif, 120);
const predExp = expiratoryLimb(PRED.fvc, PRED.pef, PRED.vpef, 120);
const predInsp = inspiratoryLimb(PRED.fvc, PRED.pif, 120);

const ratio = Math.round((MEAS.fev1 / MEAS.fvc) * 100);

// --- Chart ------------------------------------------------------------------
Highcharts.chart("container", {
  chart: {
    type: "line",
    backgroundColor: "transparent",
    animation: false,
    style: { fontFamily: "inherit" },
    spacingRight: 28,
    events: {
      // Clinical-values callout box (core SVGRenderer — no annotations module).
      load: function () {
        const chart = this;
        const lines = [
          `FEV₁  =  ${MEAS.fev1.toFixed(1)} L`,
          `FVC   =  ${MEAS.fvc.toFixed(1)} L`,
          `PEF   =  ${MEAS.pef.toFixed(1)} L/s`,
          `FEV₁/FVC  =  ${ratio} %`,
        ];
        const box = chart.renderer
          .label(lines.join("<br/>"), 0, 0, "rect")
          .css({ color: INK, fontSize: "15px", lineHeight: "20px" })
          .attr({
            fill: ELEVATED_BG,
            stroke: INK_SOFT,
            "stroke-width": 1,
            padding: 14,
            r: 6,
            zIndex: 7,
          })
          .add();
        const bb = box.getBBox();
        box.attr({
          x: chart.plotLeft + chart.plotWidth - bb.width - 22,
          y: chart.plotTop + 18,
        });
      },
    },
  },
  credits: { enabled: false },
  colors: t.palette,
  title: {
    text: "spirometry-flow-volume · javascript · highcharts · anyplot.ai",
    style: { color: INK, fontSize: "22px", fontWeight: "600" },
  },
  subtitle: {
    text: "Forced expiratory & inspiratory flow versus lung volume — measured vs predicted normal",
    style: { color: INK_SOFT, fontSize: "14px" },
  },
  xAxis: {
    title: { text: "Volume (L)", style: { color: INK_SOFT, fontSize: "16px" } },
    min: 0,
    max: 5.4,
    tickInterval: 1,
    lineColor: INK_SOFT,
    tickColor: INK_SOFT,
    gridLineColor: RULE,
    gridLineWidth: 1,
    labels: { style: { color: INK_SOFT, fontSize: "14px" } },
  },
  yAxis: {
    title: { text: "Flow (L/s)", style: { color: INK_SOFT, fontSize: "16px" } },
    min: -9,
    max: 11,
    tickInterval: 2,
    lineColor: INK_SOFT,
    gridLineColor: RULE,
    gridLineWidth: 1,
    labels: { style: { color: INK_SOFT, fontSize: "14px" } },
    plotLines: [
      {
        value: 0,
        color: INK_SOFT,
        width: 1.5,
        zIndex: 3,
        label: {
          text: "Expiration ▲   ·   Inspiration ▼",
          align: "left",
          x: 8,
          y: -8,
          style: { color: INK_SOFT, fontSize: "13px" },
        },
      },
    ],
  },
  legend: {
    itemStyle: { color: INK_SOFT, fontSize: "14px" },
    itemHoverStyle: { color: INK },
    symbolWidth: 34,
  },
  tooltip: {
    backgroundColor: ELEVATED_BG,
    borderColor: INK_SOFT,
    style: { color: INK, fontSize: "13px" },
    headerFormat: "",
    pointFormat: "Vol {point.x:.2f} L · Flow {point.y:.2f} L/s",
  },
  plotOptions: {
    series: {
      animation: false,
      marker: { enabled: false },
      states: { hover: { lineWidthPlus: 0 }, inactive: { opacity: 1 } },
    },
  },
  series: [
    {
      name: "Measured",
      color: BRAND,
      lineWidth: 3.5,
      zIndex: 4,
      data: measExp,
    },
    {
      name: "Measured (inspiratory)",
      color: BRAND,
      lineWidth: 3.5,
      zIndex: 4,
      linkedTo: ":previous",
      data: measInsp,
    },
    {
      name: "Predicted normal",
      color: MUTED,
      dashStyle: "Dash",
      lineWidth: 2.5,
      zIndex: 2,
      data: predExp,
    },
    {
      name: "Predicted normal (inspiratory)",
      color: MUTED,
      dashStyle: "Dash",
      lineWidth: 2.5,
      zIndex: 2,
      linkedTo: ":previous",
      data: predInsp,
    },
    {
      name: "PEF",
      type: "scatter",
      color: BRAND,
      zIndex: 6,
      showInLegend: false,
      enableMouseTracking: false,
      marker: {
        enabled: true,
        radius: 7,
        symbol: "circle",
        fillColor: BRAND,
        lineColor: INK,
        lineWidth: 2,
      },
      dataLabels: {
        enabled: true,
        align: "left",
        x: 16,
        y: -6,
        format: "PEF · {point.y:.1f} L/s",
        style: {
          color: INK,
          fontSize: "14px",
          fontWeight: "600",
          textOutline: "none",
        },
      },
      data: [[MEAS.vpef, MEAS.pef]],
    },
  ],
});
Runnable source as JSON, for any HTTP client: https://api.anyplot.ai/specs/spirometry-flow-volume/highcharts/code. Any spec id and library id listed in llms-full.txt fit the same URL shape; every URL below is complete and callable.
{
  "spec_id": "spirometry-flow-volume",
  "language": "javascript",
  "library": "highcharts",
  "page": "https://anyplot.ai/spirometry-flow-volume/javascript/highcharts",
  "hub": "https://anyplot.ai/spirometry-flow-volume",
  "code_json": "https://api.anyplot.ai/specs/spirometry-flow-volume/highcharts/code",
  "spec_json": "https://api.anyplot.ai/specs/spirometry-flow-volume",
  "render_light_png": "https://storage.googleapis.com/anyplot-images/plots/spirometry-flow-volume/javascript/highcharts/plot-light.png",
  "render_dark_png": "https://storage.googleapis.com/anyplot-images/plots/spirometry-flow-volume/javascript/highcharts/plot-dark.png",
  "interactive_light_html": "https://storage.googleapis.com/anyplot-images/plots/spirometry-flow-volume/javascript/highcharts/plot-light.html",
  "interactive_dark_html": "https://storage.googleapis.com/anyplot-images/plots/spirometry-flow-volume/javascript/highcharts/plot-dark.html",
  "quality_score": 92.0,
  "license": "MIT",
  "guide": "https://anyplot.ai/llms.txt"
}
Part of Spirometry Flow-Volume Loop on anyplot.ai.