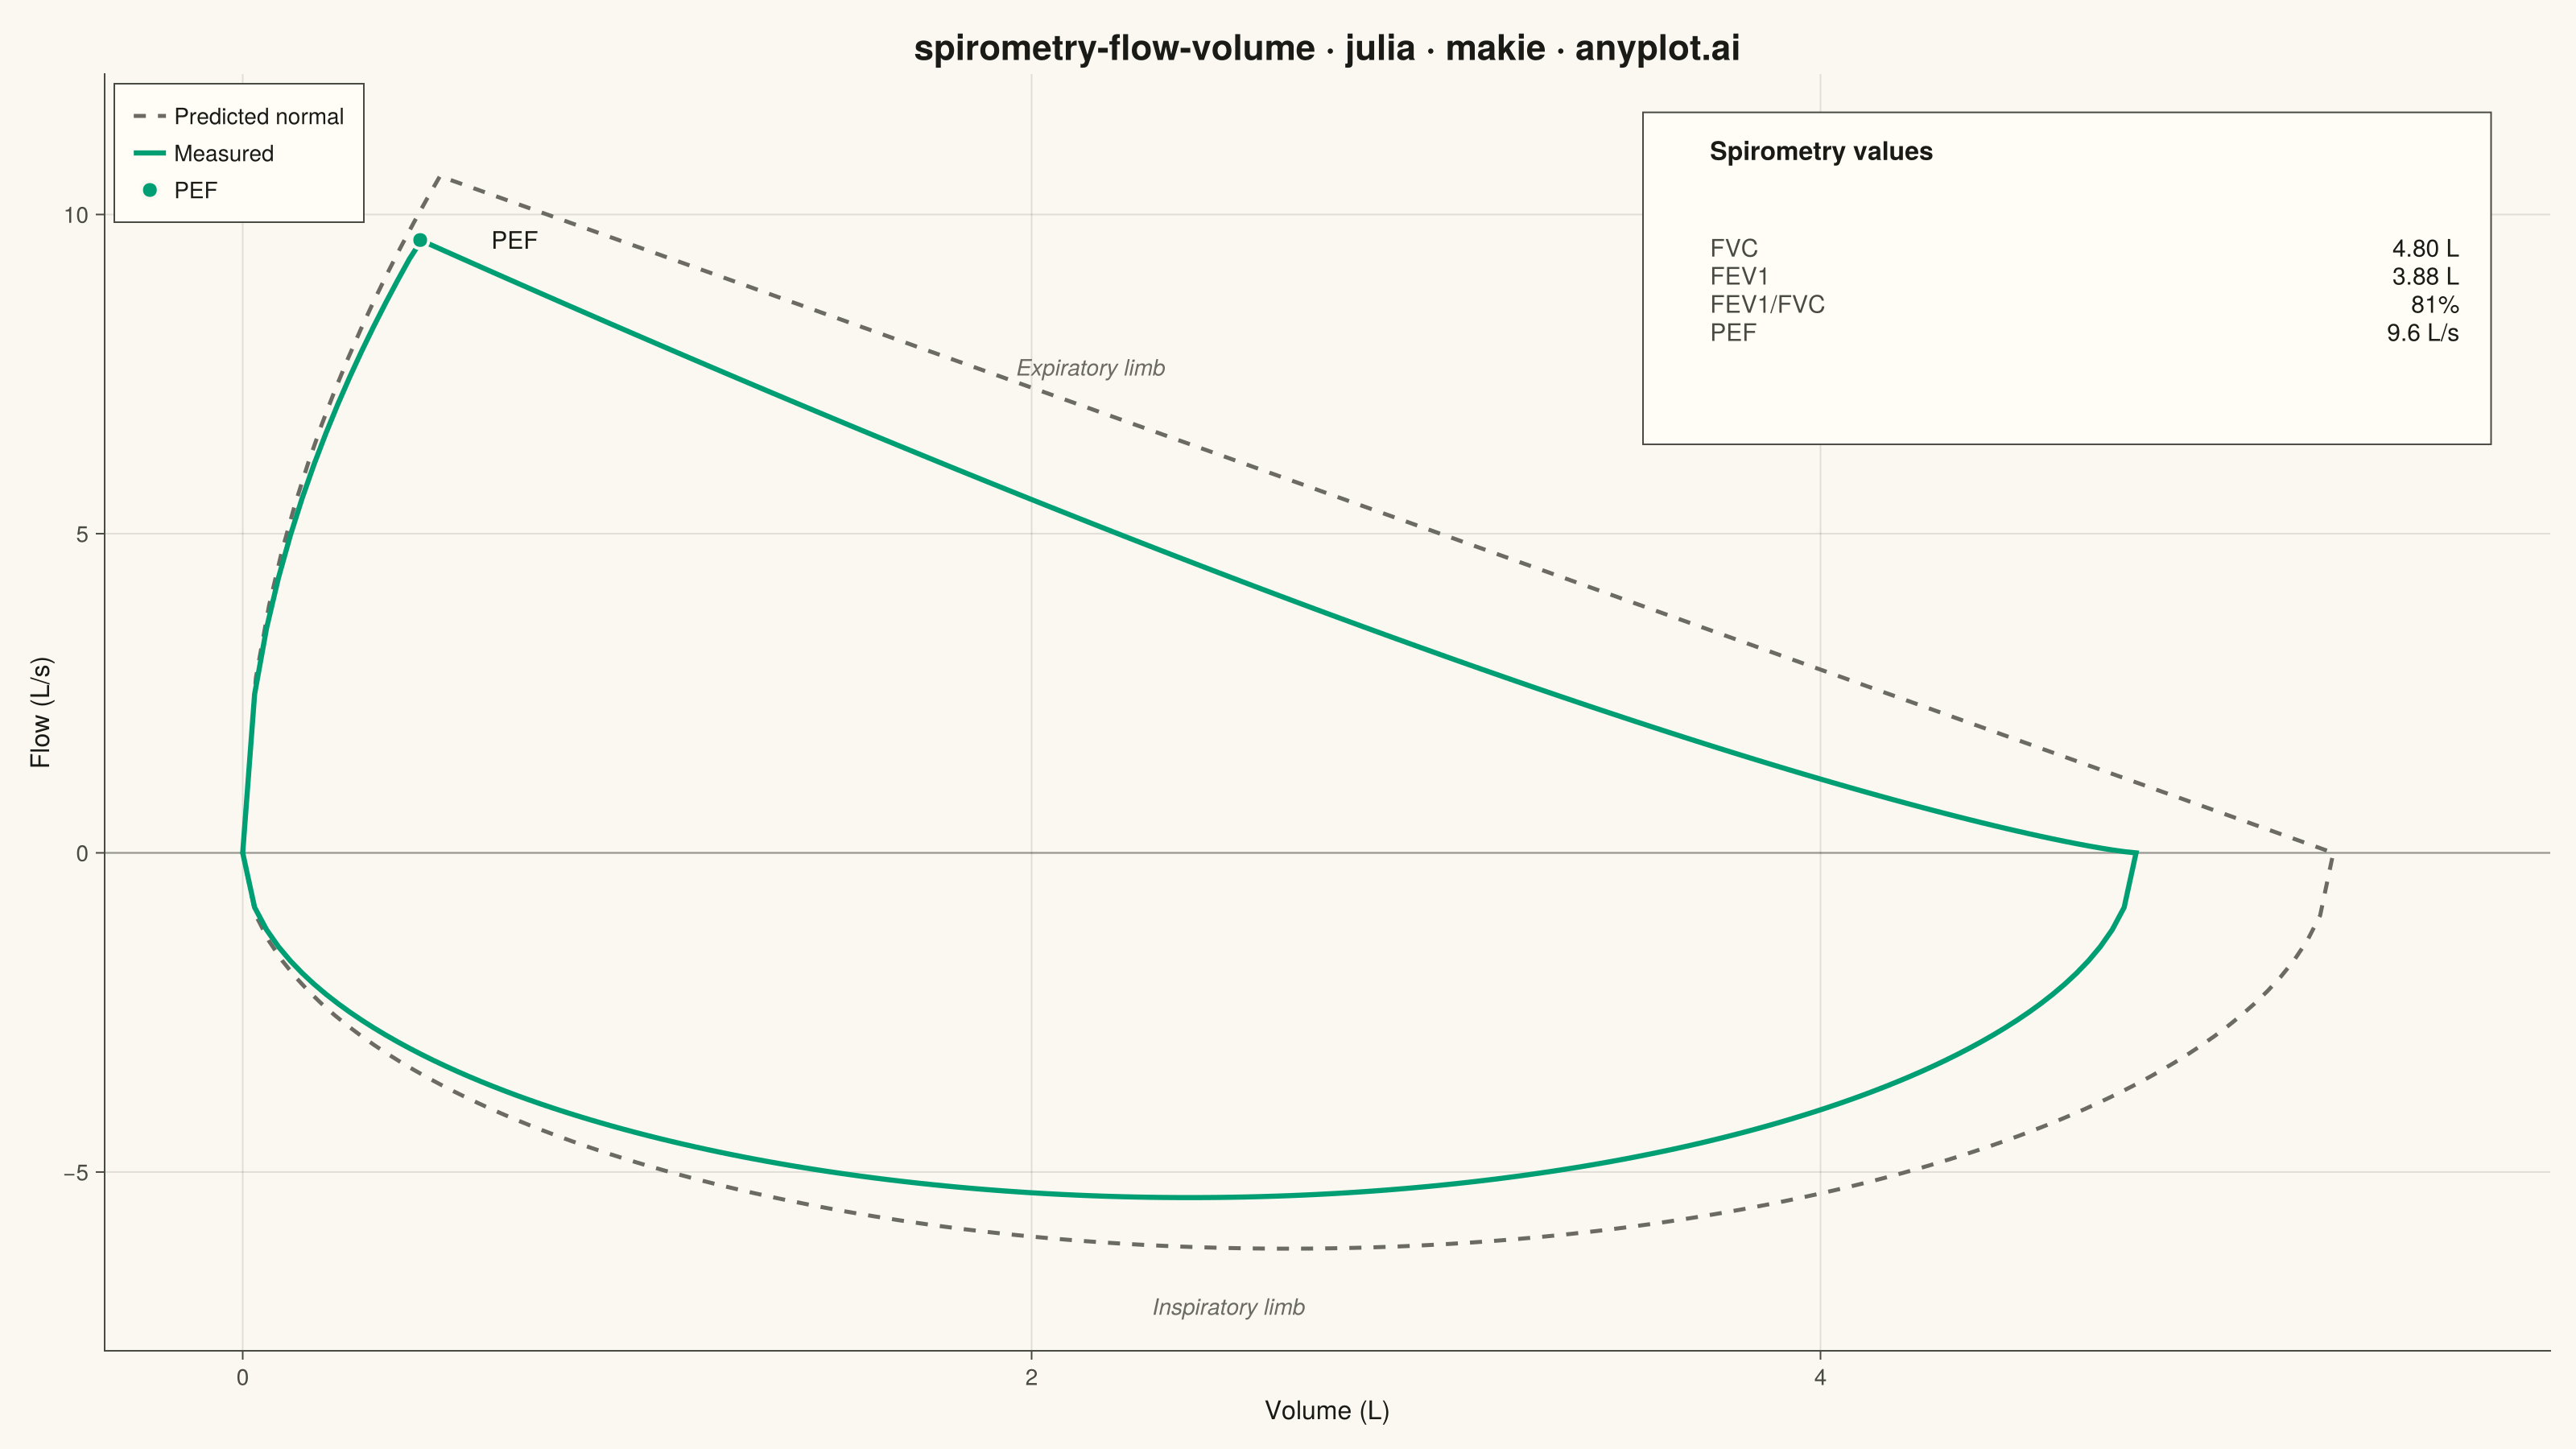
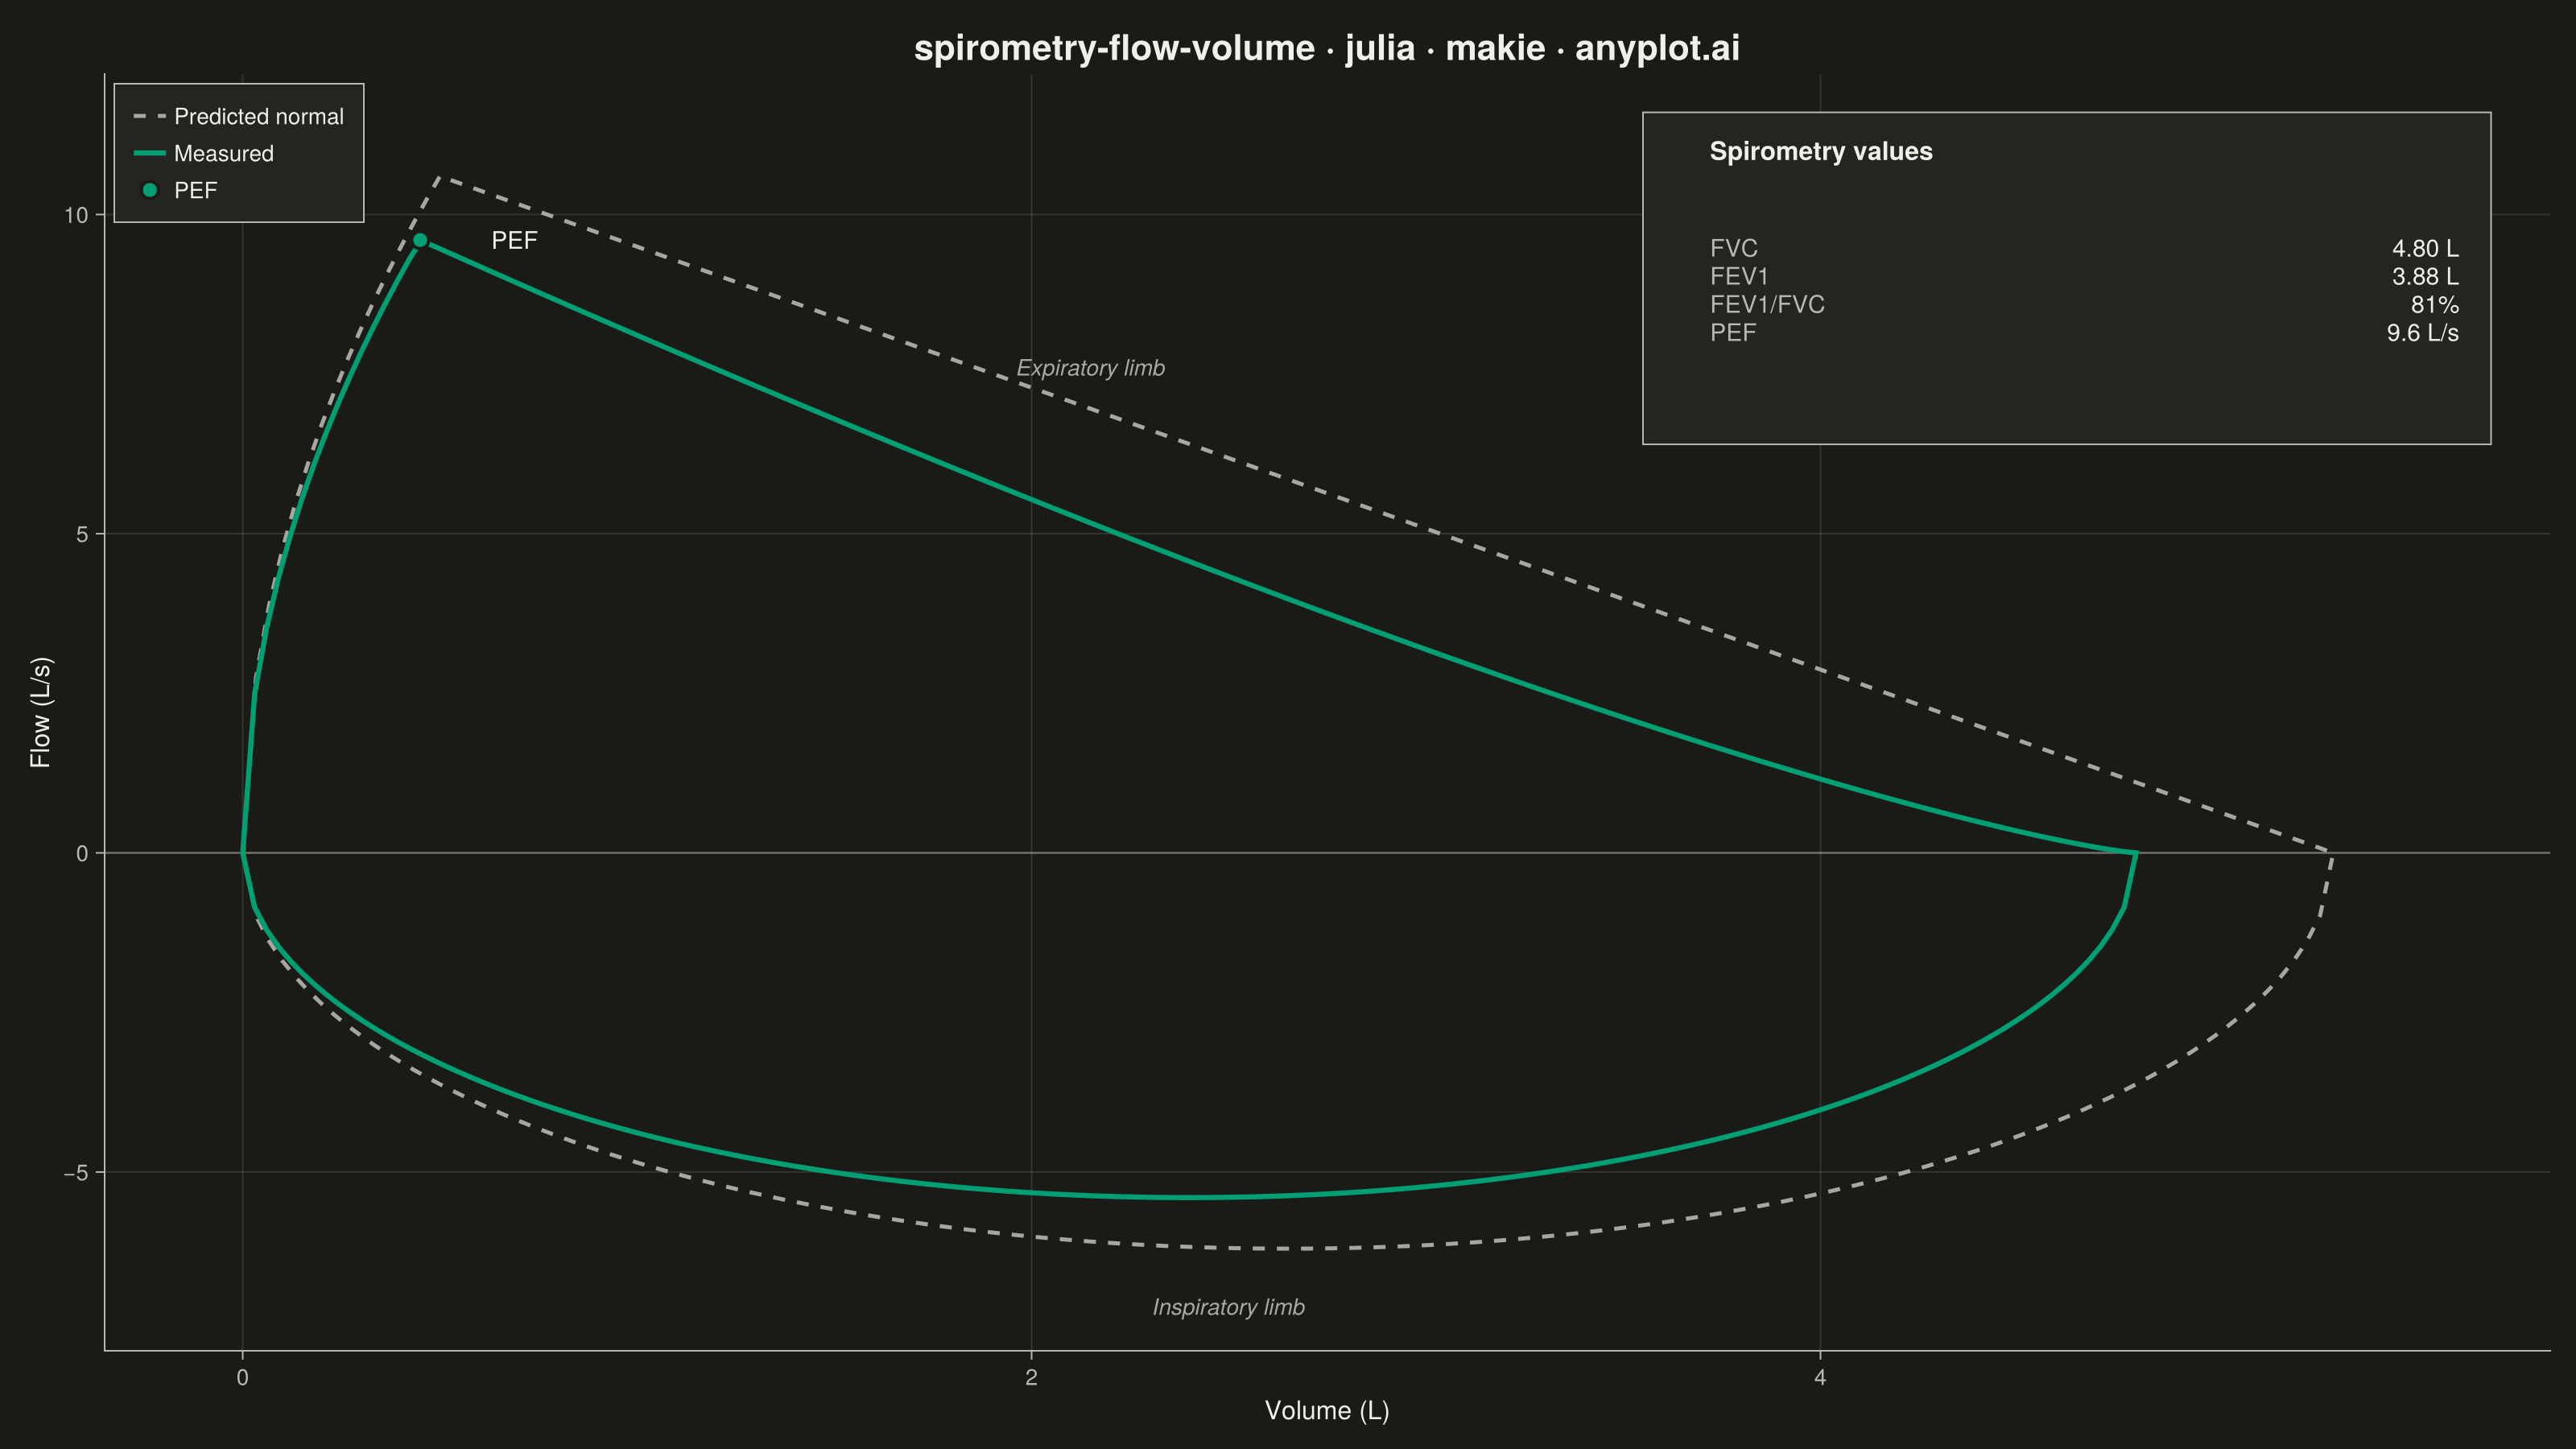
A pulmonary function test visualization that plots airflow rate (L/s) against lung volume (L) during forced expiration and inspiration, forming a characteristic loop shape. The expiratory limb rises sharply to Peak Expiratory Flow (PEF) then declines, while the inspiratory limb forms a more symmetric curve below the x-axis. This plot is essential for diagnosing obstructive and restrictive lung diseases by comparing measured loops against predicted normal values.
# anyplot.ai
# spirometry-flow-volume: Spirometry Flow-Volume Loop
# Library: makie 0.22.10 | Julia 1.11.9
# Quality: 90/100 | Created: 2026-06-17

using CairoMakie
using Colors
using Random

Random.seed!(42)

# --- Theme tokens -----------------------------------------------------------
const THEME       = get(ENV, "ANYPLOT_THEME", "light")
const PAGE_BG     = THEME == "light" ? colorant"#FAF8F1" : colorant"#1A1A17"
const ELEVATED_BG = THEME == "light" ? colorant"#FFFDF6" : colorant"#242420"
const INK         = THEME == "light" ? colorant"#1A1A17" : colorant"#F0EFE8"
const INK_SOFT    = THEME == "light" ? colorant"#4A4A44" : colorant"#B8B7B0"
const INK_MUTED   = THEME == "light" ? colorant"#6B6A63" : colorant"#A8A79F"

const BRAND     = colorant"#009E73"  # Imprint palette position 1 — measured loop
const REFERENCE = INK_MUTED          # Imprint muted anchor — predicted normal overlay

# --- Data: forced expiratory + inspiratory flow-volume loops ----------------
# Volume axis runs 0 (full inflation, TLC) -> FVC (full exhalation, RV).
# Expiratory limb rises sharply to PEF then declines toward zero at FVC;
# inspiratory limb is a symmetric U below the zero-flow line.
n = 160

# Measured loop (mild obstructive pattern: slightly scooped expiratory decline)
fvc_meas   = 4.8
pef_meas   = 9.6
v_pef_meas = 0.45
pif_meas   = 5.4

v_exp_meas = collect(range(0, fvc_meas; length = n))
flow_exp_meas = [v <= v_pef_meas ?
    pef_meas * sqrt(v / v_pef_meas) :
    pef_meas * ((fvc_meas - v) / (fvc_meas - v_pef_meas))^1.25
    for v in v_exp_meas]

v_insp_meas = collect(range(fvc_meas, 0; length = n))
flow_insp_meas = [-pif_meas * sqrt(max(0.0, 1 - ((v - fvc_meas / 2) / (fvc_meas / 2))^2))
                  for v in v_insp_meas]

volume_meas = vcat(v_exp_meas, v_insp_meas)
flow_meas   = vcat(flow_exp_meas, flow_insp_meas)

# Predicted normal loop (reference overlay — larger, near-linear decline)
fvc_pred   = 5.3
pef_pred   = 10.6
v_pef_pred = 0.5
pif_pred   = 6.2

v_exp_pred = collect(range(0, fvc_pred; length = n))
flow_exp_pred = [v <= v_pef_pred ?
    pef_pred * sqrt(v / v_pef_pred) :
    pef_pred * ((fvc_pred - v) / (fvc_pred - v_pef_pred))
    for v in v_exp_pred]

v_insp_pred = collect(range(fvc_pred, 0; length = n))
flow_insp_pred = [-pif_pred * sqrt(max(0.0, 1 - ((v - fvc_pred / 2) / (fvc_pred / 2))^2))
                  for v in v_insp_pred]

volume_pred = vcat(v_exp_pred, v_insp_pred)
flow_pred   = vcat(flow_exp_pred, flow_insp_pred)

# --- Plot -------------------------------------------------------------------
fig = Figure(
    size            = (1600, 900),
    fontsize        = 14,
    backgroundcolor = PAGE_BG,
)

ax = Axis(
    fig[1, 1];
    title             = "spirometry-flow-volume · julia · makie · anyplot.ai",
    titlesize         = 22,
    titlecolor        = INK,
    xlabel            = "Volume (L)",
    ylabel            = "Flow (L/s)",
    xlabelsize        = 16,
    ylabelsize        = 16,
    xlabelcolor       = INK,
    ylabelcolor       = INK,
    xticklabelsize    = 14,
    yticklabelsize    = 14,
    xticklabelcolor   = INK_SOFT,
    yticklabelcolor   = INK_SOFT,
    xtickcolor        = INK_SOFT,
    ytickcolor        = INK_SOFT,
    backgroundcolor   = PAGE_BG,
    topspinevisible   = false,
    rightspinevisible = false,
    leftspinecolor    = INK_SOFT,
    bottomspinecolor  = INK_SOFT,
    xgridcolor        = RGBAf(INK.r, INK.g, INK.b, 0.12),
    ygridcolor        = RGBAf(INK.r, INK.g, INK.b, 0.12),
    xminorgridvisible = false,
    yminorgridvisible = false,
)

xlims!(ax, -0.35, 5.85)
ylims!(ax, -7.8, 12.2)

# Zero-flow reference line separating expiration (above) from inspiration (below)
hlines!(ax, 0; color = RGBAf(INK.r, INK.g, INK.b, 0.35), linewidth = 1.2)

# Predicted normal loop (dashed reference)
lines!(ax, volume_pred, flow_pred;
    color = REFERENCE, linewidth = 2.5, linestyle = :dash, label = "Predicted normal")

# Measured loop (solid brand green)
lines!(ax, volume_meas, flow_meas;
    color = BRAND, linewidth = 3.2, label = "Measured")

# Peak Expiratory Flow marker
scatter!(ax, [v_pef_meas], [pef_meas];
    color = BRAND, markersize = 15, strokecolor = PAGE_BG, strokewidth = 2,
    label = "PEF")
text!(ax, v_pef_meas + 0.18, pef_meas;
    text = "PEF", color = INK, fontsize = 15, align = (:left, :center))

# Limb annotations
text!(ax, 2.15, 7.4; text = "Expiratory limb", color = INK_MUTED,
    fontsize = 14, font = :italic, align = (:center, :bottom))
text!(ax, 2.5, -6.9; text = "Inspiratory limb", color = INK_MUTED,
    fontsize = 14, font = :italic, align = (:center, :top))

# Clinical values box (upper-right empty region)
poly!(ax, Point2f[(3.55, 6.4), (5.7, 6.4), (5.7, 11.6), (3.55, 11.6)];
    color = ELEVATED_BG, strokecolor = INK_SOFT, strokewidth = 1)
text!(ax, 3.72, 11.0; text = "Spirometry values", color = INK,
    fontsize = 16, font = :bold, align = (:left, :center))
text!(ax, 3.72, 9.7; text = "FVC\nFEV1\nFEV1/FVC\nPEF",
    color = INK_SOFT, fontsize = 15, align = (:left, :top))
text!(ax, 5.62, 9.7; text = "4.80 L\n3.88 L\n81%\n9.6 L/s",
    color = INK, fontsize = 15, align = (:right, :top))

axislegend(ax; position = :lt, framecolor = INK_SOFT, framevisible = true,
    backgroundcolor = ELEVATED_BG, labelcolor = INK, labelsize = 14,
    padding = (12, 12, 10, 10))

# --- Save -------------------------------------------------------------------
save("plot-$(THEME).png", fig; px_per_unit = 2)
Runnable source as JSON, for any HTTP client: https://api.anyplot.ai/specs/spirometry-flow-volume/makie/code. Any spec id and library id listed in llms-full.txt fit the same URL shape; every URL below is complete and callable.
{
  "spec_id": "spirometry-flow-volume",
  "language": "julia",
  "library": "makie",
  "page": "https://anyplot.ai/spirometry-flow-volume/julia/makie",
  "hub": "https://anyplot.ai/spirometry-flow-volume",
  "code_json": "https://api.anyplot.ai/specs/spirometry-flow-volume/makie/code",
  "spec_json": "https://api.anyplot.ai/specs/spirometry-flow-volume",
  "render_light_png": "https://storage.googleapis.com/anyplot-images/plots/spirometry-flow-volume/julia/makie/plot-light.png",
  "render_dark_png": "https://storage.googleapis.com/anyplot-images/plots/spirometry-flow-volume/julia/makie/plot-dark.png",
  "quality_score": 90.0,
  "license": "MIT",
  "guide": "https://anyplot.ai/llms.txt"
}
Part of Spirometry Flow-Volume Loop on anyplot.ai.