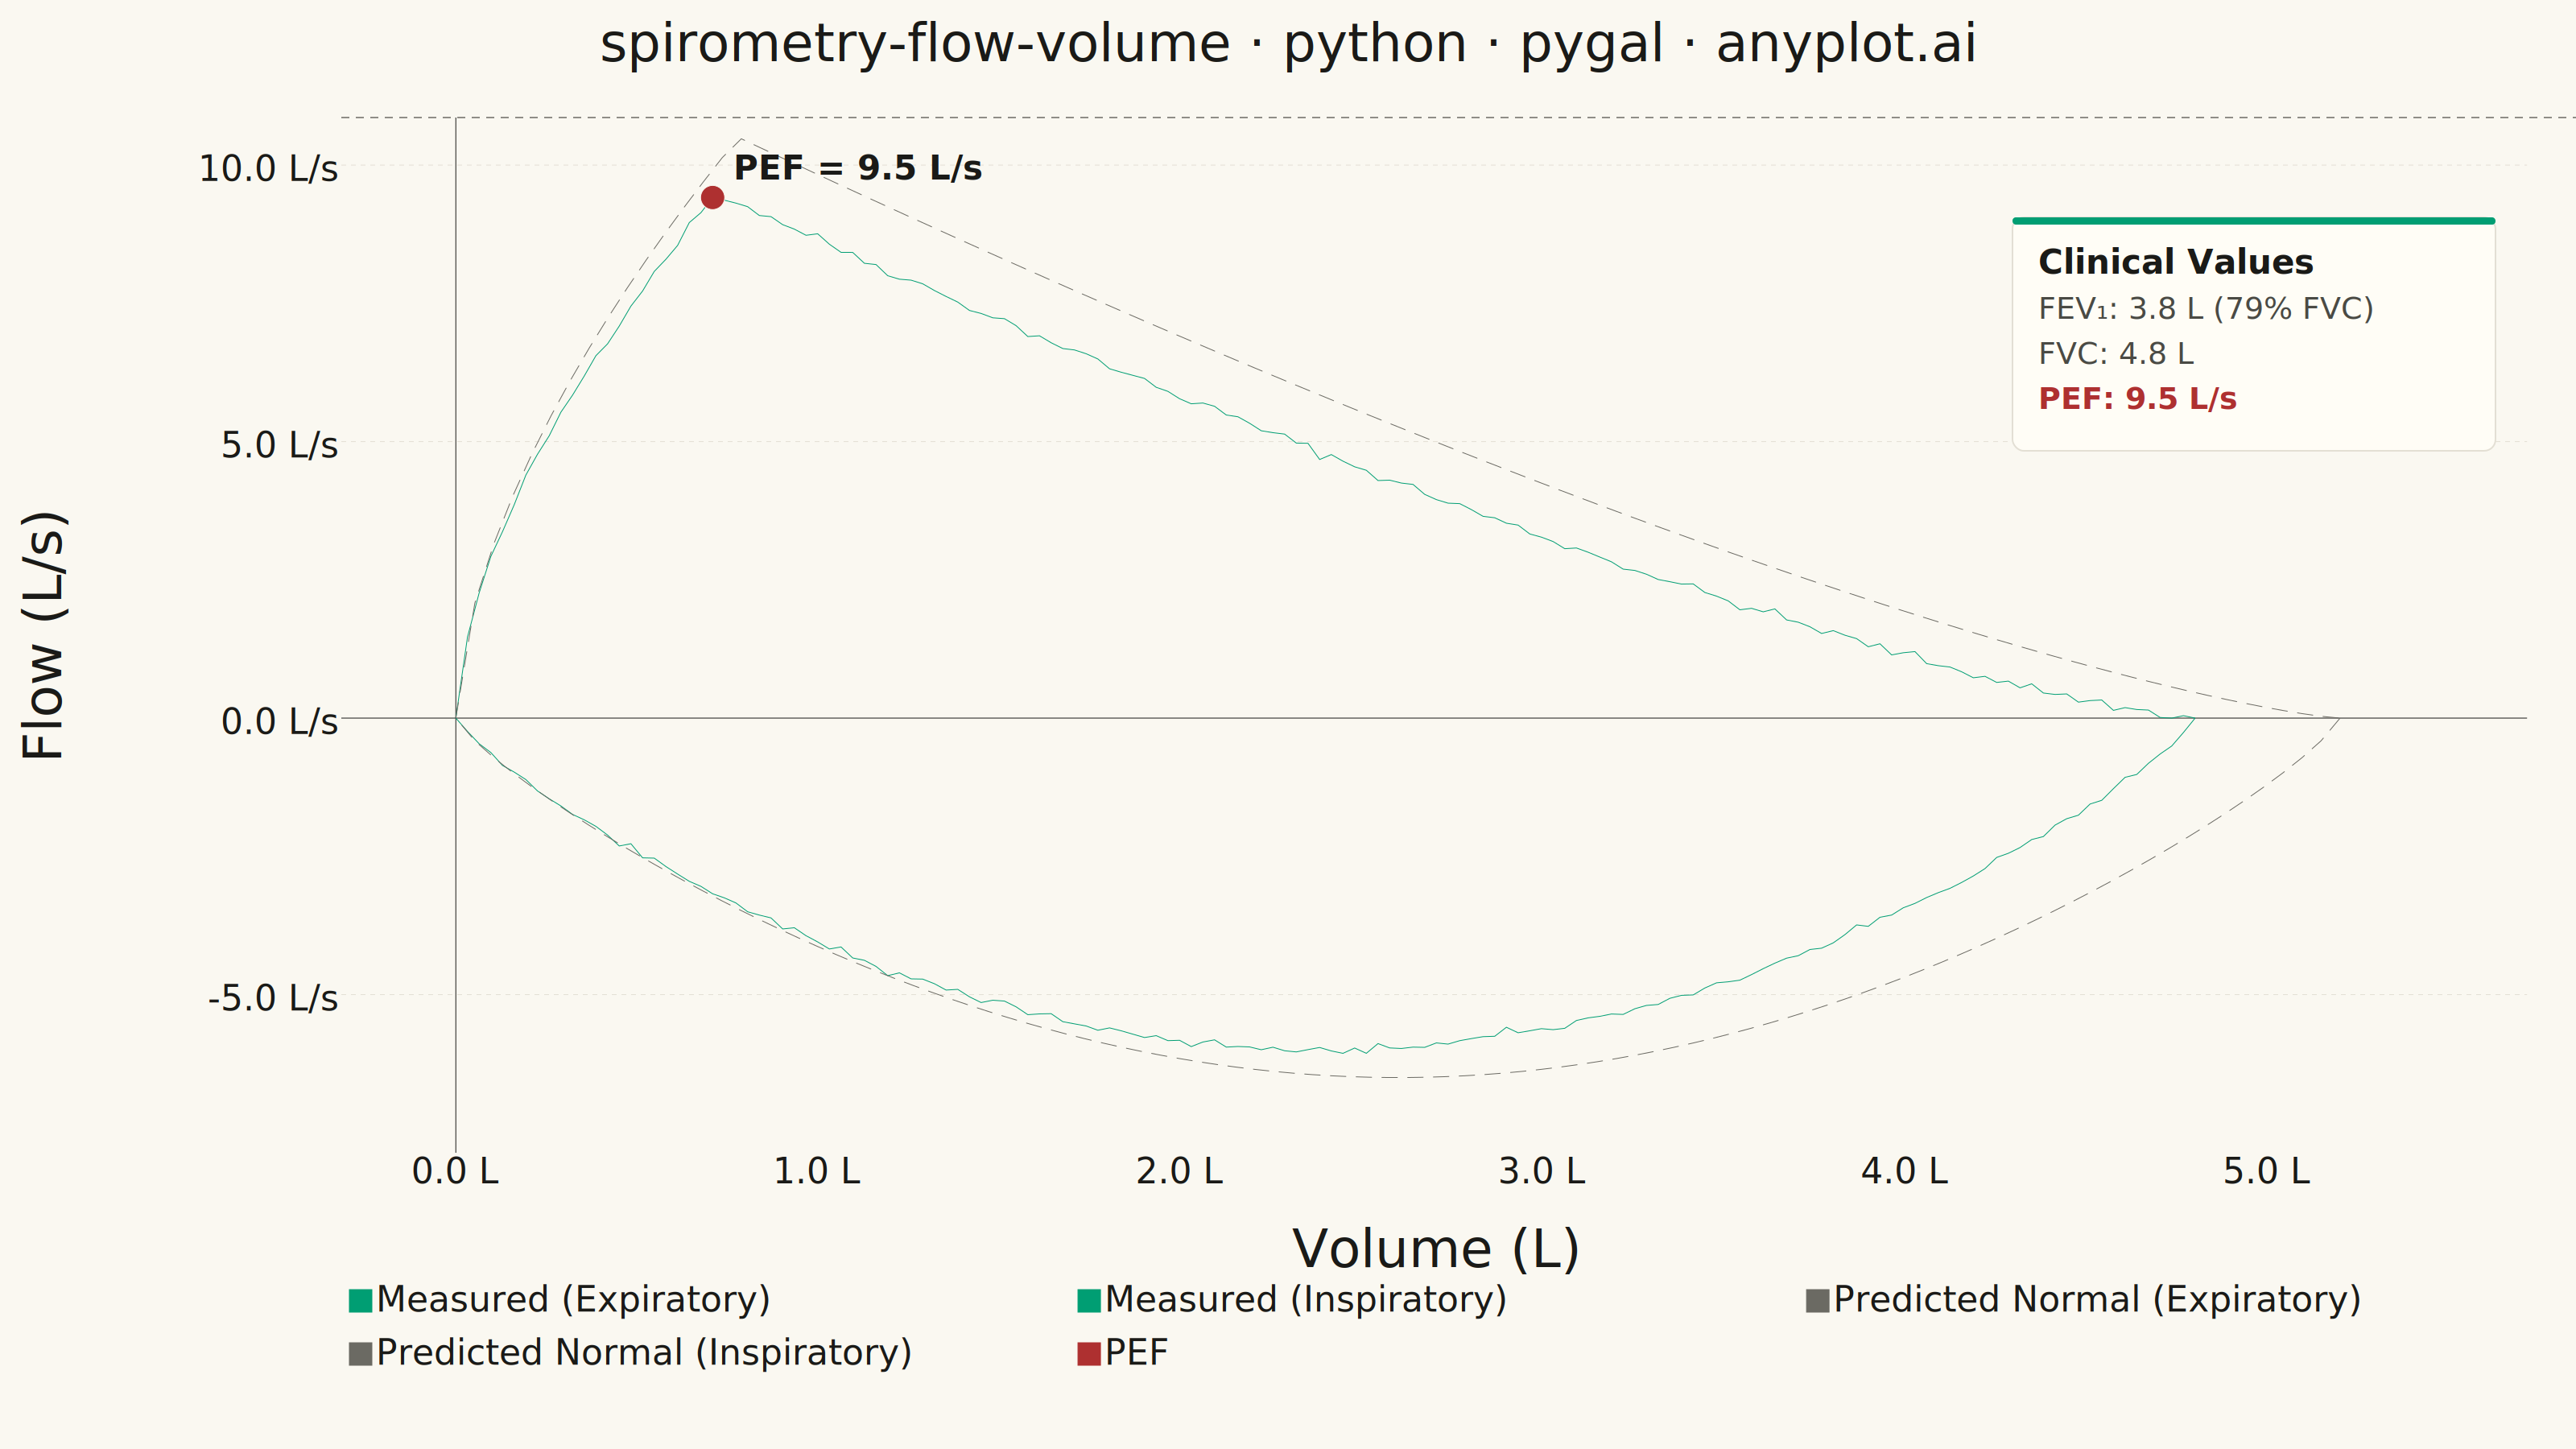
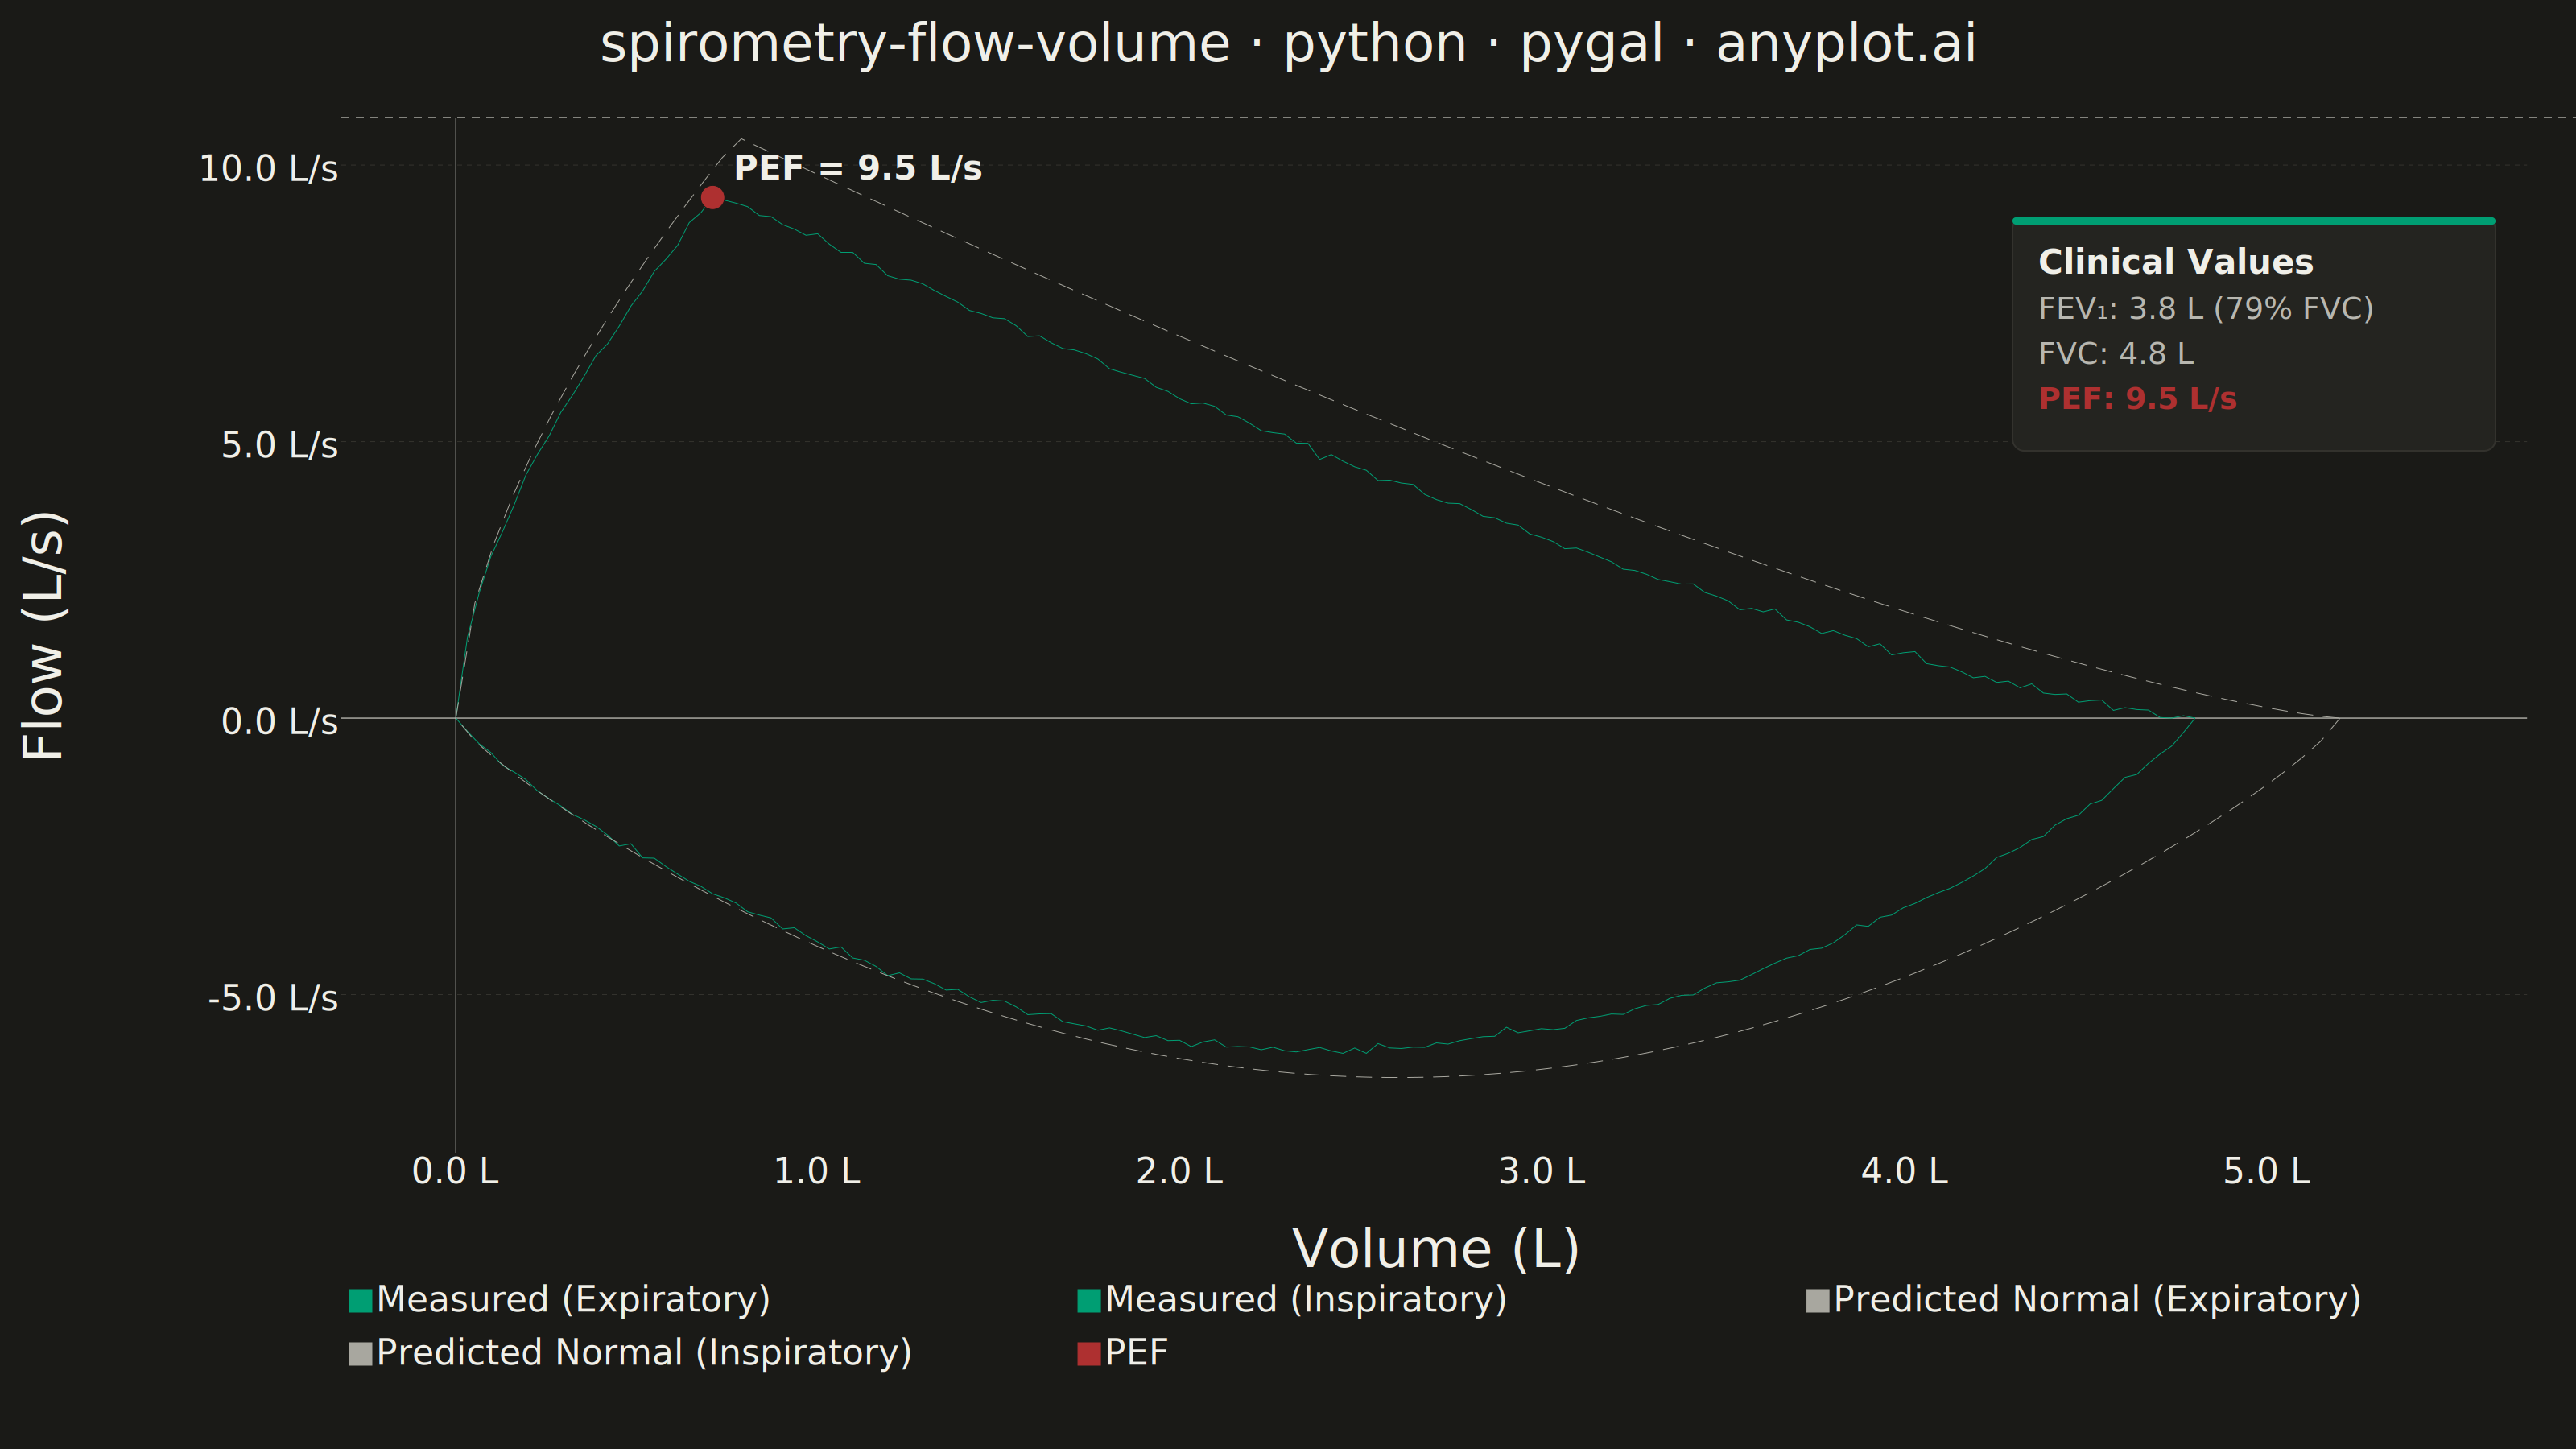
A pulmonary function test visualization that plots airflow rate (L/s) against lung volume (L) during forced expiration and inspiration, forming a characteristic loop shape. The expiratory limb rises sharply to Peak Expiratory Flow (PEF) then declines, while the inspiratory limb forms a more symmetric curve below the x-axis. This plot is essential for diagnosing obstructive and restrictive lung diseases by comparing measured loops against predicted normal values.
""" anyplot.ai
spirometry-flow-volume: Spirometry Flow-Volume Loop
Library: pygal 3.1.0 | Python 3.13.13
Quality: 94/100 | Updated: 2026-06-17
"""

import os
import xml.etree.ElementTree as ET

import cairosvg
import numpy as np
import pygal
from pygal.style import Style


# Theme tokens (see prompts/default-style-guide.md "Theme-adaptive Chrome")
THEME = os.getenv("ANYPLOT_THEME", "light")
PAGE_BG = "#FAF8F1" if THEME == "light" else "#1A1A17"
ELEVATED_BG = "#FFFDF6" if THEME == "light" else "#242420"
INK = "#1A1A17" if THEME == "light" else "#F0EFE8"
INK_SOFT = "#4A4A44" if THEME == "light" else "#B8B7B0"
INK_MUTED = "#6B6A63" if THEME == "light" else "#A8A79F"
GRID = "#E3DFD4" if THEME == "light" else "#33322D"

# Imprint palette: measured = brand green, predicted = muted (reference overlay),
# PEF = matte red (semantic anchor for the highlighted clinical peak)
BRAND = "#009E73"  # Imprint position 1 — ALWAYS first series
PREDICTED = INK_MUTED  # theme-adaptive muted — the normal reference loop
PEF_RED = "#AE3030"  # Imprint position 5 — emphasis on the key clinical point

# Data - Spirometry flow-volume loop for a healthy adult male
np.random.seed(42)

fvc = 4.8  # Forced Vital Capacity (L)
pef = 9.5  # Peak Expiratory Flow (L/s)
fev1 = 3.8  # Forced Expiratory Volume in 1 second (L)

# Measured expiratory limb: sharp rise to PEF then roughly linear decline
n_exp = 150
volume_exp = np.linspace(0, fvc, n_exp)
pef_volume = 0.15 * fvc
rise = volume_exp <= pef_volume
flow_exp = np.where(
    rise,
    pef * np.divide(volume_exp, pef_volume, where=rise, out=np.zeros_like(volume_exp)) ** 0.6,
    pef * np.clip(1 - (volume_exp - pef_volume) / (fvc - pef_volume), 0, None) ** 1.3,
)
flow_exp += np.random.normal(0, 0.05, n_exp)
flow_exp = np.clip(flow_exp, 0, None)
flow_exp[0] = 0
flow_exp[-1] = 0

# Measured inspiratory limb: symmetric U-shaped curve (negative flow)
n_insp = 150
volume_insp = np.linspace(fvc, 0, n_insp)
flow_insp = -6.0 * np.sin(np.pi * np.linspace(0, 1, n_insp)) ** 0.8
flow_insp += np.random.normal(0, 0.04, n_insp)
flow_insp[0] = 0
flow_insp[-1] = 0

# Predicted normal loop (slightly higher capacity), drawn dashed for comparison
fvc_pred = 5.2
pef_pred = 10.5
volume_pred_exp = np.linspace(0, fvc_pred, 100)
pef_vol_pred = 0.15 * fvc_pred
rise_pred = volume_pred_exp <= pef_vol_pred
flow_pred_exp = np.where(
    rise_pred,
    pef_pred * np.divide(volume_pred_exp, pef_vol_pred, where=rise_pred, out=np.zeros_like(volume_pred_exp)) ** 0.6,
    pef_pred * np.clip(1 - (volume_pred_exp - pef_vol_pred) / (fvc_pred - pef_vol_pred), 0, None) ** 1.3,
)
flow_pred_exp[0] = 0
flow_pred_exp[-1] = 0

volume_pred_insp = np.linspace(fvc_pred, 0, 100)
flow_pred_insp = -6.5 * np.sin(np.pi * np.linspace(0, 1, 100)) ** 0.8
flow_pred_insp[0] = 0
flow_pred_insp[-1] = 0

# Style - theme-adaptive Imprint chrome on the warm-cream / warm-black surface
custom_style = Style(
    background=PAGE_BG,
    plot_background=PAGE_BG,
    foreground=INK,
    foreground_strong=INK,
    foreground_subtle=INK_MUTED,
    colors=(BRAND, BRAND, PREDICTED, PREDICTED, PEF_RED),
    font_family="DejaVu Sans, Helvetica, Arial, sans-serif",
    title_font_size=66,
    label_font_size=56,
    major_label_font_size=44,
    legend_font_size=44,
    value_font_size=36,
    tooltip_font_size=36,
    opacity=1.0,
    opacity_hover=1.0,
    stroke_opacity=1.0,
    stroke_opacity_hover=1.0,
    guide_stroke_color=GRID,
    major_guide_stroke_color=GRID,
)

# Chart
chart = pygal.XY(
    width=3200,
    height=1800,
    title="spirometry-flow-volume · python · pygal · anyplot.ai",
    x_title="Volume (L)",
    y_title="Flow (L/s)",
    style=custom_style,
    show_dots=False,
    show_y_guides=True,
    show_x_guides=False,
    show_legend=True,
    legend_at_bottom=True,
    legend_box_size=28,
    value_formatter=lambda y: f"{y:.1f} L/s",
    x_value_formatter=lambda x: f"{x:.1f} L",
    margin_top=70,
    margin_bottom=40,
    margin_left=70,
    margin_right=60,
    xrange=(-0.2, 5.6),
    range=(-7.5, 10.5),
    x_labels=[0, 1, 2, 3, 4, 5],
    x_labels_major=[0, 1, 2, 3, 4, 5],
    y_labels=[-5, 0, 5, 10],
    show_x_labels=True,
    show_y_labels=True,
    show_minor_x_labels=False,
    show_minor_y_labels=False,
    truncate_legend=-1,
    explicit_size=True,
)

# Measured loop (solid, thick); predicted loop (dashed via SVG post-processing)
chart.add(
    "Measured (Expiratory)",
    [(float(v), float(f)) for v, f in zip(volume_exp, flow_exp, strict=True)],
    stroke_style={"width": 5},
)
chart.add(
    "Measured (Inspiratory)",
    [(float(v), float(f)) for v, f in zip(volume_insp, flow_insp, strict=True)],
    stroke_style={"width": 5},
)
chart.add(
    "Predicted Normal (Expiratory)",
    [(float(v), float(f)) for v, f in zip(volume_pred_exp, flow_pred_exp, strict=True)],
    stroke_style={"width": 4},
)
chart.add(
    "Predicted Normal (Inspiratory)",
    [(float(v), float(f)) for v, f in zip(volume_pred_insp, flow_pred_insp, strict=True)],
    stroke_style={"width": 4},
)

# PEF marker
pef_idx = int(np.argmax(flow_exp))
chart.add("PEF", [(float(volume_exp[pef_idx]), float(flow_exp[pef_idx]))], stroke=False, show_dots=True, dots_size=16)

# Render to interactive SVG, then post-process for dashed lines + annotations
svg_bytes = chart.render()
SVG_NS = "http://www.w3.org/2000/svg"
ET.register_namespace("", SVG_NS)
ET.register_namespace("xlink", "http://www.w3.org/1999/xlink")
root = ET.fromstring(svg_bytes)
ns = f"{{{SVG_NS}}}"

# Make the predicted (reference) loop dashed for distinct styling
for g in root.iter(f"{ns}g"):
    cls = g.get("class", "")
    if "serie-2" in cls or "serie-3" in cls:
        for path in g.iter(f"{ns}path"):
            path.set("stroke-dasharray", "20,12")

# Highlight the PEF point and add its label
parent_of = {child: parent for parent in root.iter() for child in parent}
for g in root.iter(f"{ns}g"):
    if "serie-4" not in g.get("class", ""):
        continue
    for circle in g.iter(f"{ns}circle"):
        if float(circle.get("r", "0")) <= 3:
            continue
        cx, cy = float(circle.get("cx", "0")), float(circle.get("cy", "0"))
        circle.set("fill", PEF_RED)
        circle.set("r", "15")
        circle.set("stroke", PAGE_BG)
        circle.set("stroke-width", "4")
        parent = parent_of.get(circle)
        if parent is not None:
            label = ET.SubElement(parent, f"{ns}text")
            label.set("x", f"{cx + 26:.0f}")
            label.set("y", f"{cy - 22:.0f}")
            label.set("font-size", "42")
            label.set("font-family", "DejaVu Sans, Helvetica, Arial, sans-serif")
            label.set("fill", PEF_RED)
            label.set("font-weight", "bold")
            label.text = f"PEF = {pef:.1f} L/s"
        break

# Clinical values callout box (upper-right, where the loop leaves the canvas open)
box_x, box_y, box_w, box_h = 2500, 270, 600, 290
box = ET.SubElement(root, f"{ns}rect")
box.set("x", f"{box_x}")
box.set("y", f"{box_y}")
box.set("width", f"{box_w}")
box.set("height", f"{box_h}")
box.set("rx", "14")
box.set("fill", ELEVATED_BG)
box.set("stroke", GRID)
box.set("stroke-width", "2")

accent = ET.SubElement(root, f"{ns}rect")
accent.set("x", f"{box_x}")
accent.set("y", f"{box_y}")
accent.set("width", f"{box_w}")
accent.set("height", "9")
accent.set("rx", "4")
accent.set("fill", BRAND)

clinical_lines = [
    ("Clinical Values", INK, "bold", 42),
    (f"FEV₁: {fev1:.1f} L  ({fev1 / fvc * 100:.0f}% FVC)", INK_SOFT, "normal", 38),
    (f"FVC:  {fvc:.1f} L", INK_SOFT, "normal", 38),
    (f"PEF:  {pef:.1f} L/s", PEF_RED, "bold", 38),
]
for i, (txt, color, weight, size) in enumerate(clinical_lines):
    el = ET.SubElement(root, f"{ns}text")
    el.set("x", f"{box_x + 32}")
    el.set("y", f"{box_y + 70 + i * 56}")
    el.set("font-size", f"{size}")
    el.set("font-family", "DejaVu Sans, Helvetica, Arial, sans-serif")
    el.set("fill", color)
    el.set("font-weight", weight)
    el.text = txt

# Zero-flow reference line for clinical context
plot_area = root.find(f".//{ns}g[@class='plot overlay']")
if plot_area is not None:
    zero_line = ET.SubElement(plot_area, f"{ns}line")
    zero_line.set("x1", "0")
    zero_line.set("y1", "0")
    zero_line.set("x2", "3200")
    zero_line.set("y2", "0")
    zero_line.set("stroke", INK_MUTED)
    zero_line.set("stroke-width", "1.5")
    zero_line.set("stroke-dasharray", "10,8")

# Save - interactive HTML (SVG with tooltips) + PNG
final_svg = ET.tostring(root, encoding="unicode")
with open(f"plot-{THEME}.html", "w", encoding="utf-8") as f:
    f.write(final_svg)
cairosvg.svg2png(
    bytestring=final_svg.encode("utf-8"), write_to=f"plot-{THEME}.png", output_width=3200, output_height=1800
)
Runnable source as JSON, for any HTTP client: https://api.anyplot.ai/specs/spirometry-flow-volume/pygal/code. Any spec id and library id listed in llms-full.txt fit the same URL shape; every URL below is complete and callable.
{
  "spec_id": "spirometry-flow-volume",
  "language": "python",
  "library": "pygal",
  "page": "https://anyplot.ai/spirometry-flow-volume/python/pygal",
  "hub": "https://anyplot.ai/spirometry-flow-volume",
  "code_json": "https://api.anyplot.ai/specs/spirometry-flow-volume/pygal/code",
  "spec_json": "https://api.anyplot.ai/specs/spirometry-flow-volume",
  "render_light_png": "https://storage.googleapis.com/anyplot-images/plots/spirometry-flow-volume/python/pygal/plot-light.png",
  "render_dark_png": "https://storage.googleapis.com/anyplot-images/plots/spirometry-flow-volume/python/pygal/plot-dark.png",
  "interactive_light_html": "https://storage.googleapis.com/anyplot-images/plots/spirometry-flow-volume/python/pygal/plot-light.html",
  "interactive_dark_html": "https://storage.googleapis.com/anyplot-images/plots/spirometry-flow-volume/python/pygal/plot-dark.html",
  "quality_score": 94.0,
  "license": "MIT",
  "guide": "https://anyplot.ai/llms.txt"
}
Part of Spirometry Flow-Volume Loop on anyplot.ai.