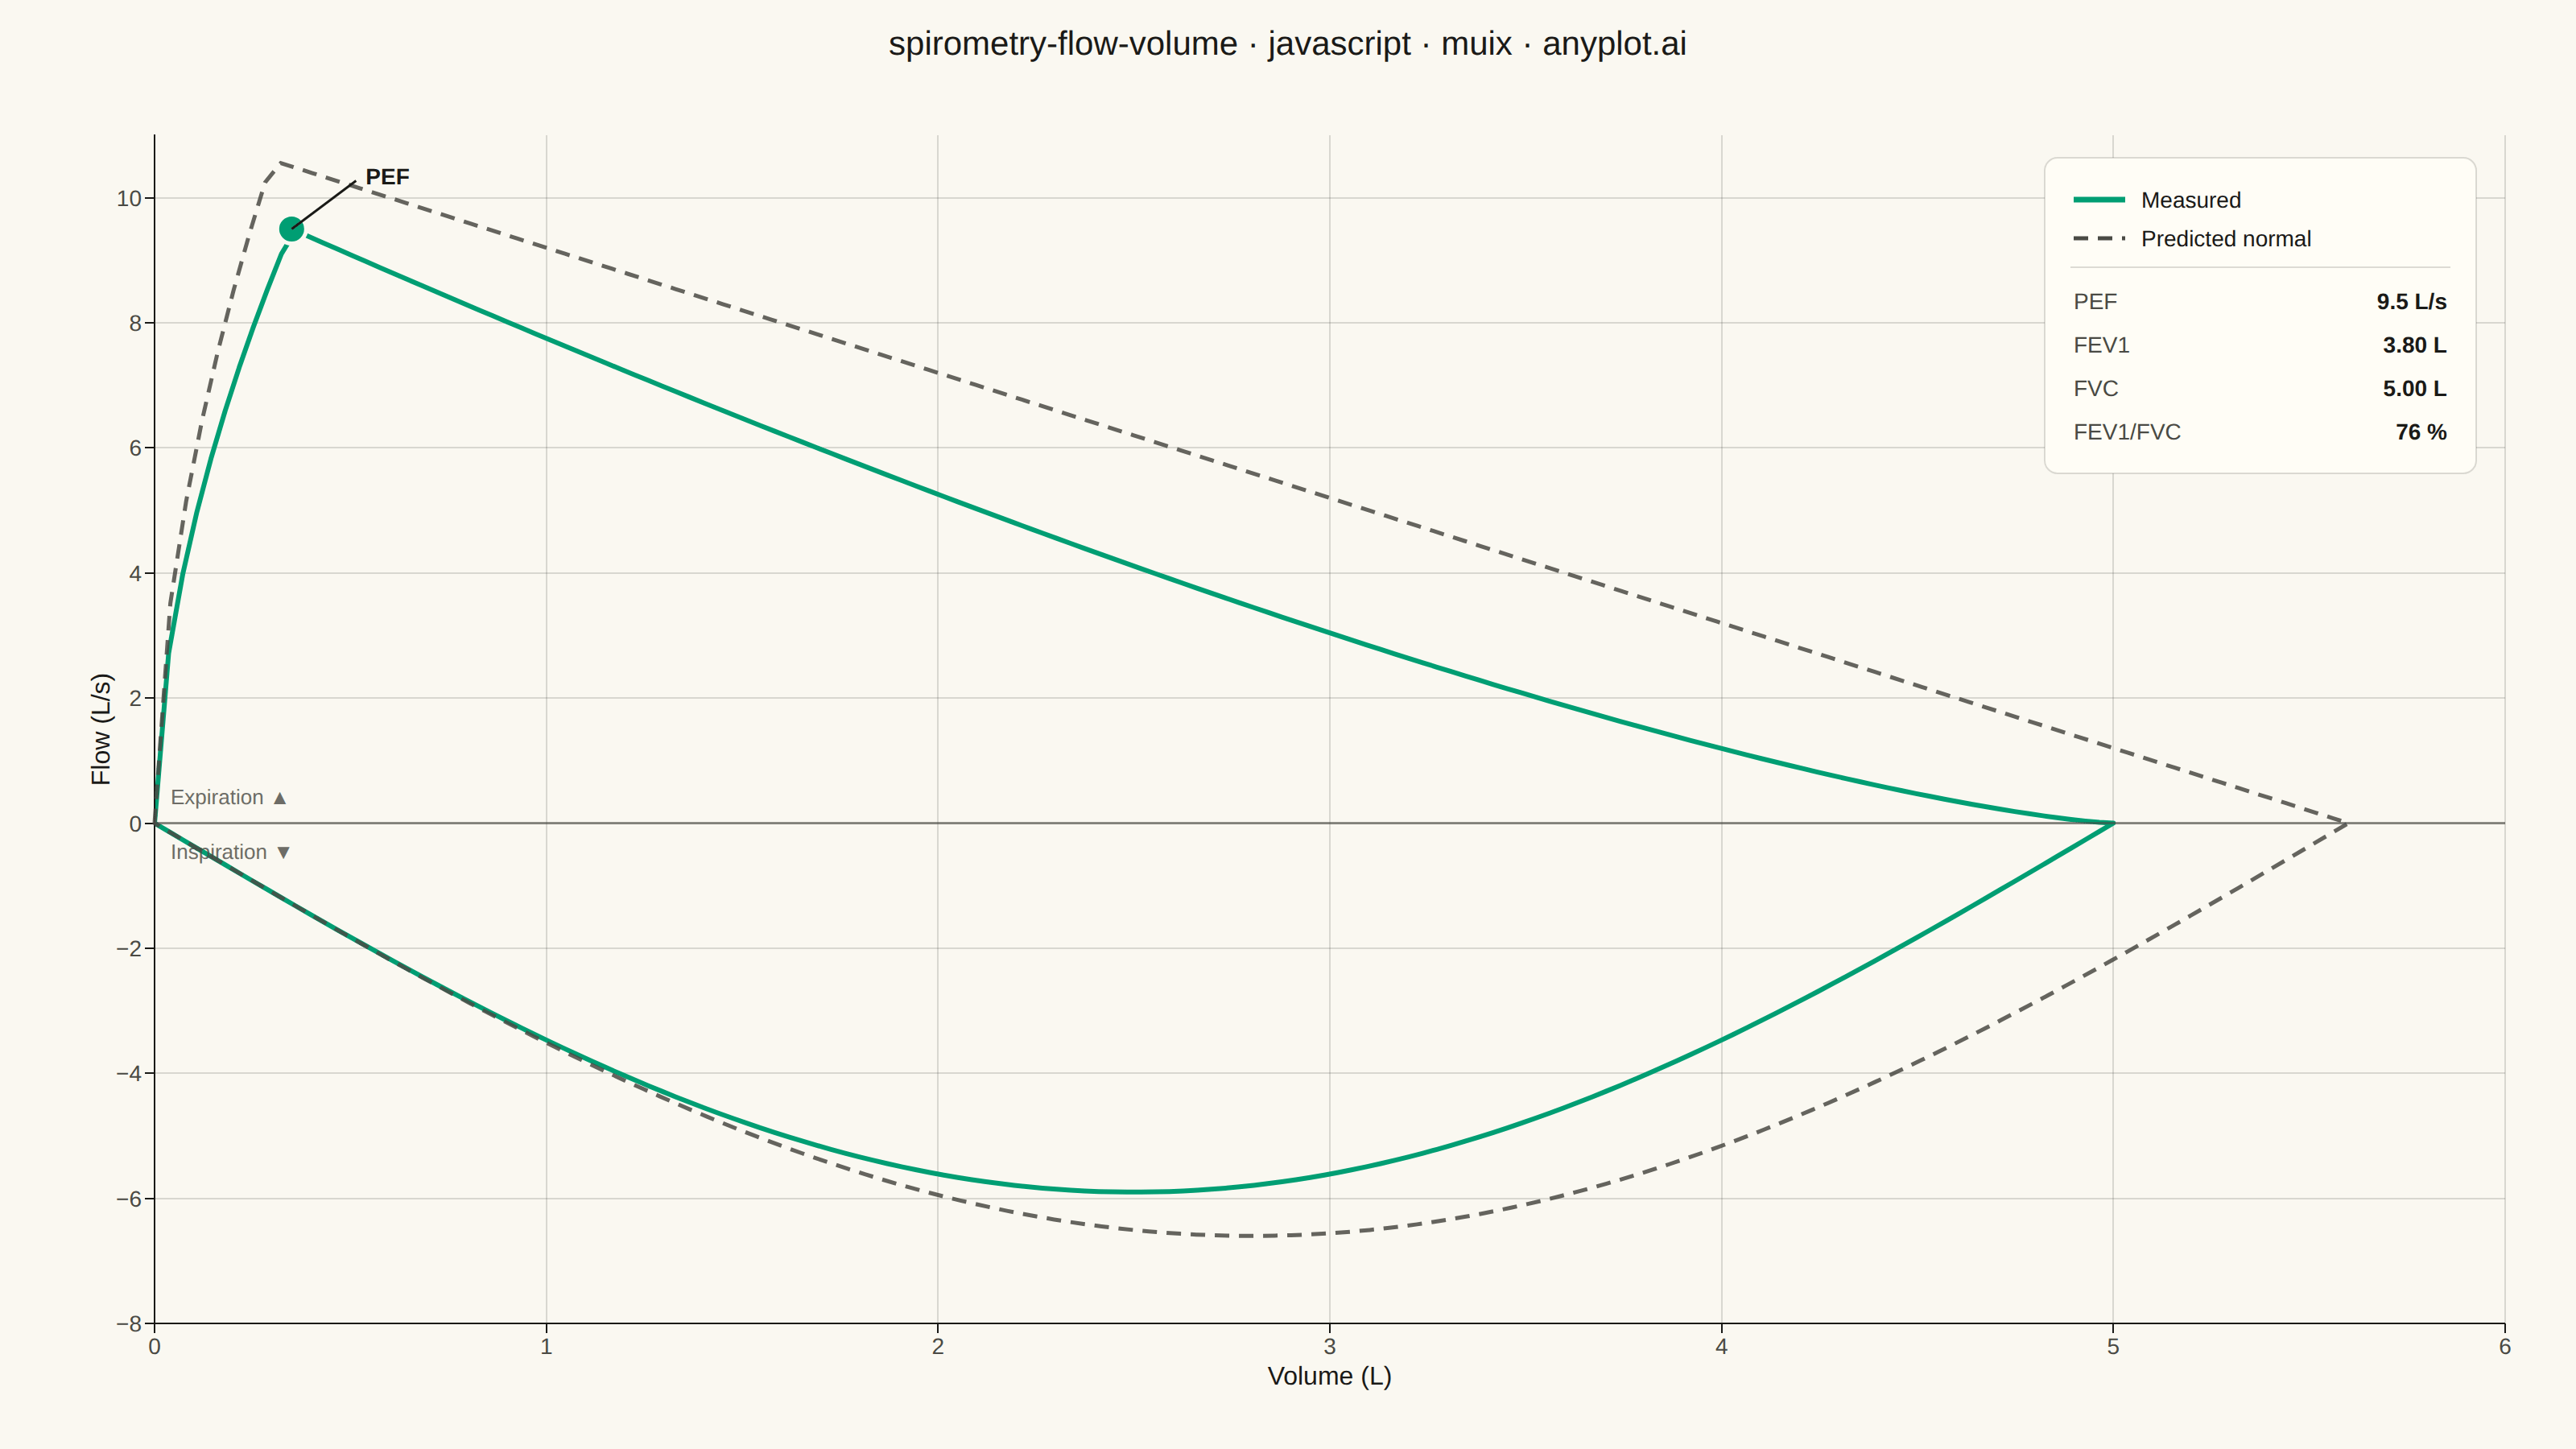
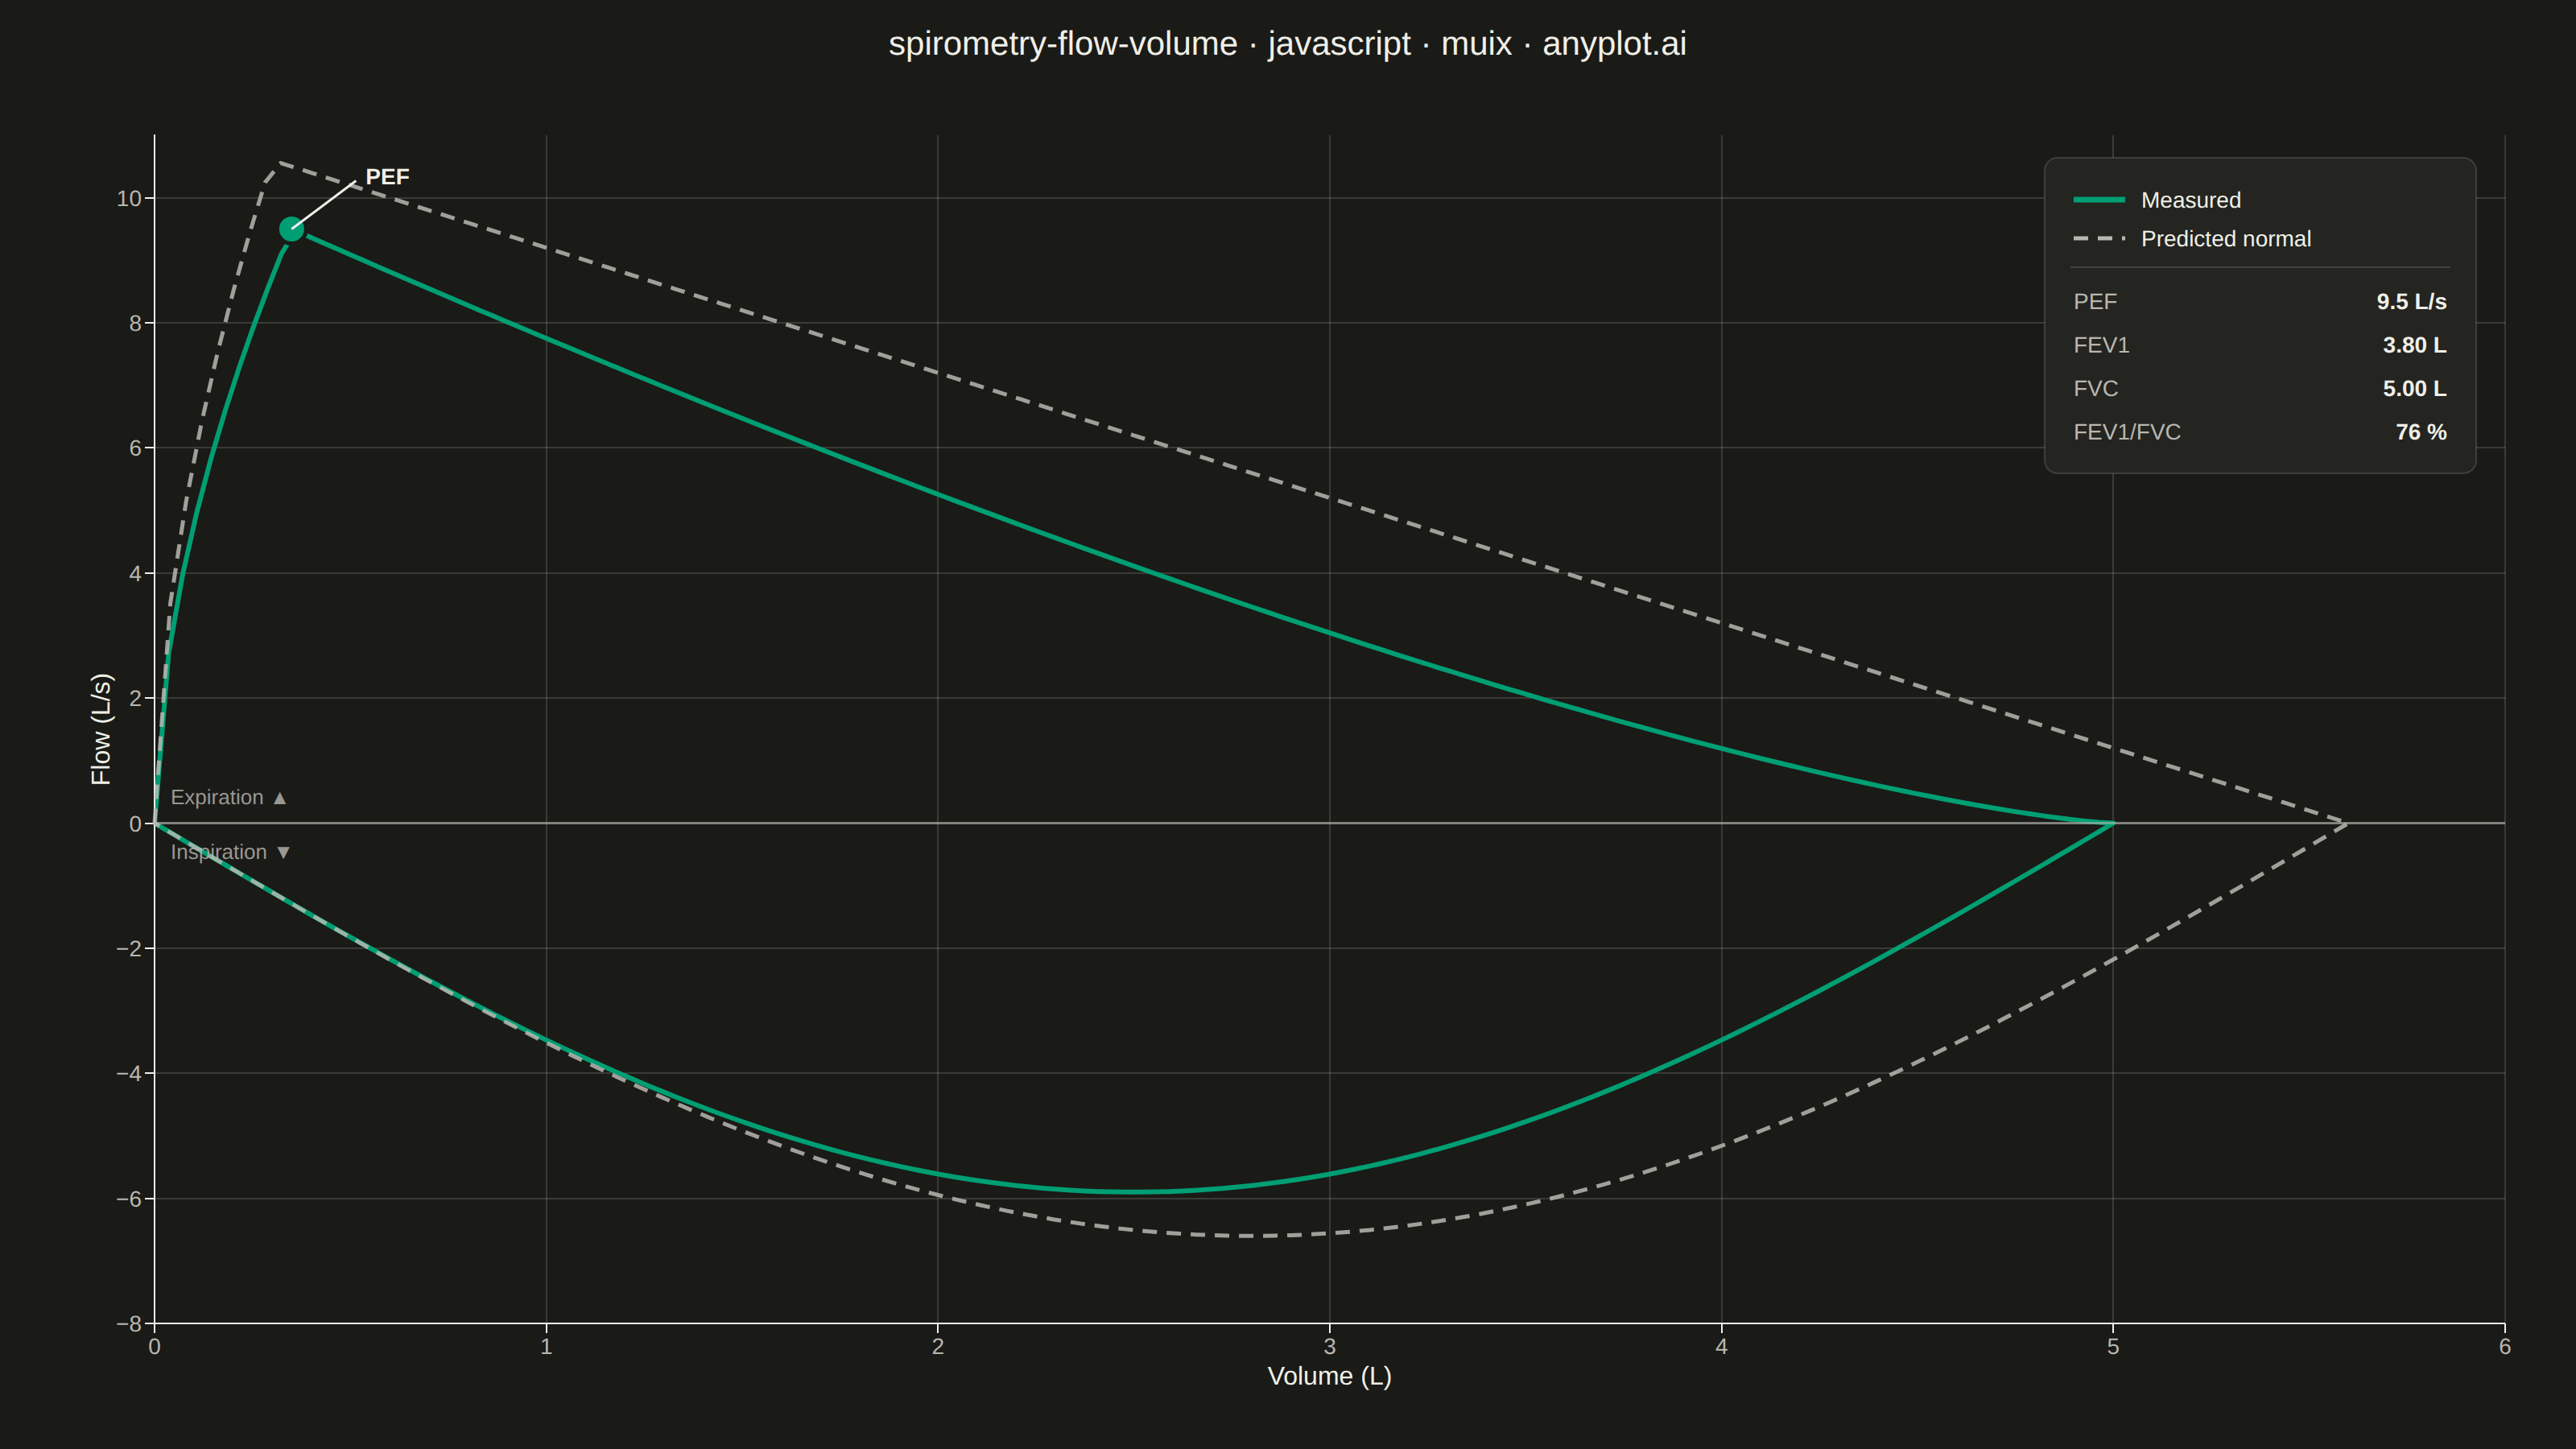
A pulmonary function test visualization that plots airflow rate (L/s) against lung volume (L) during forced expiration and inspiration, forming a characteristic loop shape. The expiratory limb rises sharply to Peak Expiratory Flow (PEF) then declines, while the inspiratory limb forms a more symmetric curve below the x-axis. This plot is essential for diagnosing obstructive and restrictive lung diseases by comparing measured loops against predicted normal values.
// anyplot.ai
// spirometry-flow-volume: Spirometry Flow-Volume Loop
// Library: muix 7.29.1 | JavaScript 22.22.3
// Quality: 91/100 | Created: 2026-06-17
//# anyplot-orientation: landscape
// anyplot.ai
// spirometry-flow-volume: Spirometry Flow-Volume Loop
// Library: MUI X Charts | React | Node 22
// License: @mui/x-charts — MIT (community). Pro/Premium are out of scope.
// Quality: pending | Created: 2026-06-17
import { LineChart } from "@mui/x-charts/LineChart";
import { useXScale, useYScale, useDrawingArea } from "@mui/x-charts/hooks";
import Box from "@mui/material/Box";
import Typography from "@mui/material/Typography";

const t = window.ANYPLOT_TOKENS;

// --- Data (in-memory, deterministic) ---------------------------------------
// Pulmonary function test: forced expiration + inspiration traced as flow (L/s)
// against exhaled volume (L). One closed parametric loop per test. The measured
// curve shows a mild obstructive pattern (reduced PEF, scooped descending limb);
// the predicted-normal envelope is overlaid dashed for comparison.
const N = 140;

// Build the expiratory limb: volume 0 -> FVC. Flow rises steeply to PEF at a
// small volume, then declines toward zero. `scoop` > 1 bows the descending limb
// toward the origin (the classic obstructive coving).
function expiratoryLimb(fvc, pef, vPeak, scoop) {
  const pts = [];
  for (let i = 0; i < N; i++) {
    const v = (fvc * i) / (N - 1);
    const flow =
      v <= vPeak
        ? pef * Math.pow(v / vPeak, 0.55)
        : pef * Math.pow((fvc - v) / (fvc - vPeak), scoop);
    pts.push([v, flow]);
  }
  return pts;
}

// Build the inspiratory limb: volume FVC -> 0, flow negative, symmetric U-shape.
function inspiratoryLimb(fvc, pif) {
  const pts = [];
  for (let i = 0; i < N; i++) {
    const v = fvc * (1 - i / (N - 1));
    pts.push([v, -pif * Math.sin(Math.PI * (v / fvc))]);
  }
  return pts;
}

// Measured patient loop (mild obstruction) and the predicted-normal reference.
const MEASURED = { fvc: 5.0, pef: 9.5, vPeak: 0.35, pif: 5.9, fev1: 3.8 };
const PREDICTED = { fvc: 5.6, pef: 10.6, vPeak: 0.3, pif: 6.6, fev1: 4.5 };

const measuredLoop = [
  ...expiratoryLimb(MEASURED.fvc, MEASURED.pef, MEASURED.vPeak, 1.35),
  ...inspiratoryLimb(MEASURED.fvc, MEASURED.pif),
];
const predictedLoop = [
  ...expiratoryLimb(PREDICTED.fvc, PREDICTED.pef, PREDICTED.vPeak, 1.0),
  ...inspiratoryLimb(PREDICTED.fvc, PREDICTED.pif),
];

const measuredVolume = measuredLoop.map((p) => p[0]);
const measuredFlow = measuredLoop.map((p) => p[1]);

const ratio = Math.round((MEASURED.fev1 / MEASURED.fvc) * 100);

// --- Overlay: predicted loop, zero-flow axis, PEF marker, clinical panel -----
function toPath(points, xs, ys) {
  return (
    points.map(([v, f], i) => `${i ? "L" : "M"}${xs(v)},${ys(f)}`).join(" ") + " Z"
  );
}

function ClinicalOverlay() {
  const xs = useXScale();
  const ys = useYScale();
  const { left, top, width } = useDrawingArea();
  if (!xs || !ys) return null;

  const zeroY = ys(0);
  const pefX = xs(MEASURED.vPeak);
  const pefY = ys(MEASURED.pef);

  // Info / legend panel anchored top-right (the declining tail leaves it clear).
  const panelW = 268;
  const panelH = 196;
  const px = left + width - panelW - 18;
  const py = top + 14;
  const rows = [
    ["PEF", `${MEASURED.pef.toFixed(1)} L/s`],
    ["FEV1", `${MEASURED.fev1.toFixed(2)} L`],
    ["FVC", `${MEASURED.fvc.toFixed(2)} L`],
    ["FEV1/FVC", `${ratio} %`],
  ];

  return (
    <g>
      {/* Zero-flow reference line separating expiration (+) from inspiration (−) */}
      <line
        x1={left}
        x2={left + width}
        y1={zeroY}
        y2={zeroY}
        stroke={t.inkSoft}
        strokeWidth={1.5}
        opacity={0.6}
      />
      <text x={left + 10} y={zeroY - 12} fontSize={13} fill={t.inkSoft} opacity={0.8}>
        Expiration ▲
      </text>
      <text x={left + 10} y={zeroY + 22} fontSize={13} fill={t.inkSoft} opacity={0.8}>
        Inspiration ▼
      </text>

      {/* Predicted-normal envelope (dashed reference) */}
      <path
        d={toPath(predictedLoop, xs, ys)}
        fill="none"
        stroke={t.inkSoft}
        strokeWidth={2.5}
        strokeDasharray="9 6"
        opacity={0.85}
      />

      {/* Peak Expiratory Flow marker on the measured loop */}
      <circle cx={pefX} cy={pefY} r={9} fill={t.palette[0]} stroke={t.pageBg} strokeWidth={2.5} />
      <line
        x1={pefX}
        y1={pefY}
        x2={pefX + 40}
        y2={pefY - 30}
        stroke={t.ink}
        strokeWidth={1.5}
      />
      <text x={pefX + 46} y={pefY - 28} fontSize={14} fontWeight="600" fill={t.ink}>
        PEF
      </text>

      {/* Clinical values + legend panel */}
      <rect
        x={px}
        y={py}
        width={panelW}
        height={panelH}
        rx={8}
        fill={t.elevatedBg}
        stroke={t.grid}
        strokeWidth={1}
      />
      {/* Legend: measured (solid green) + predicted (dashed neutral) */}
      <line x1={px + 18} y1={py + 26} x2={px + 50} y2={py + 26} stroke={t.palette[0]} strokeWidth={3.5} />
      <text x={px + 60} y={py + 31} fontSize={14} fill={t.ink}>
        Measured
      </text>
      <line
        x1={px + 18}
        y1={py + 50}
        x2={px + 50}
        y2={py + 50}
        stroke={t.inkSoft}
        strokeWidth={2.5}
        strokeDasharray="9 6"
      />
      <text x={px + 60} y={py + 55} fontSize={14} fill={t.ink}>
        Predicted normal
      </text>
      <line x1={px + 16} y1={py + 68} x2={px + panelW - 16} y2={py + 68} stroke={t.grid} strokeWidth={1} />
      {/* Numeric clinical values */}
      {rows.map(([k, v], i) => (
        <g key={k}>
          <text x={px + 18} y={py + 94 + i * 27} fontSize={14} fill={t.inkSoft}>
            {k}
          </text>
          <text
            x={px + panelW - 18}
            y={py + 94 + i * 27}
            fontSize={14}
            fontWeight="600"
            textAnchor="end"
            fill={t.ink}
          >
            {v}
          </text>
        </g>
      ))}
    </g>
  );
}

// --- Chart (default-exported component — the harness mounts it) -------------
const TITLE_H = 56;

export default function Chart() {
  const W = window.ANYPLOT_SIZE.width;
  const H = window.ANYPLOT_SIZE.height;

  return (
    <Box sx={{ width: W, height: H, bgcolor: t.pageBg, display: "flex", flexDirection: "column" }}>
      <Typography
        sx={{
          color: t.ink,
          fontSize: 21,
          fontWeight: 500,
          textAlign: "center",
          height: TITLE_H,
          lineHeight: `${TITLE_H}px`,
          flexShrink: 0,
        }}
      >
        spirometry-flow-volume · javascript · muix · anyplot.ai
      </Typography>
      <LineChart
        width={W}
        height={H - TITLE_H}
        skipAnimation
        margin={{ top: 28, right: 44, bottom: 78, left: 96 }}
        grid={{ horizontal: true, vertical: true }}
        xAxis={[
          {
            data: measuredVolume,
            scaleType: "linear",
            min: 0,
            max: 6,
            tickMinStep: 1,
            label: "Volume (L)",
            labelStyle: { fontSize: 16, fill: t.ink },
            tickLabelStyle: { fontSize: 14, fill: t.inkSoft },
          },
        ]}
        yAxis={[
          {
            min: -8,
            max: 11,
            tickMinStep: 2,
            label: "Flow (L/s)",
            labelStyle: { fontSize: 16, fill: t.ink },
            tickLabelStyle: { fontSize: 14, fill: t.inkSoft },
          },
        ]}
        series={[
          {
            data: measuredFlow,
            color: t.palette[0],
            label: "Measured",
            showMark: false,
            curve: "linear",
          },
        ]}
        slotProps={{ legend: { hidden: true } }}
        sx={{
          "& .MuiLineElement-root": { strokeWidth: 3 },
          "& .MuiChartsAxis-line": { stroke: t.inkSoft, strokeWidth: 1 },
          "& .MuiChartsAxis-tick": { stroke: t.inkSoft },
          "& .MuiChartsGrid-line": { stroke: t.grid },
        }}
      >
        <ClinicalOverlay />
      </LineChart>
    </Box>
  );
}
Runnable source as JSON, for any HTTP client: https://api.anyplot.ai/specs/spirometry-flow-volume/muix/code. Any spec id and library id listed in llms-full.txt fit the same URL shape; every URL below is complete and callable.
{
  "spec_id": "spirometry-flow-volume",
  "language": "javascript",
  "library": "muix",
  "page": "https://anyplot.ai/spirometry-flow-volume/javascript/muix",
  "hub": "https://anyplot.ai/spirometry-flow-volume",
  "code_json": "https://api.anyplot.ai/specs/spirometry-flow-volume/muix/code",
  "spec_json": "https://api.anyplot.ai/specs/spirometry-flow-volume",
  "render_light_png": "https://storage.googleapis.com/anyplot-images/plots/spirometry-flow-volume/javascript/muix/plot-light.png",
  "render_dark_png": "https://storage.googleapis.com/anyplot-images/plots/spirometry-flow-volume/javascript/muix/plot-dark.png",
  "interactive_light_html": "https://storage.googleapis.com/anyplot-images/plots/spirometry-flow-volume/javascript/muix/plot-light.html",
  "interactive_dark_html": "https://storage.googleapis.com/anyplot-images/plots/spirometry-flow-volume/javascript/muix/plot-dark.html",
  "quality_score": 91.0,
  "license": "MIT",
  "guide": "https://anyplot.ai/llms.txt"
}
Part of Spirometry Flow-Volume Loop on anyplot.ai.