The same plot in 14 other libraries — JavaScript: D3.js, Apache ECharts, Highcharts, MUI X Charts; Python: Altair, Bokeh, lets-plot, Matplotlib, Plotly, plotnine, Pygal, Seaborn; R: ggplot2; Julia: Makie.jl. Compare all 15 side by side: Basic Step Plot in Python, R, Julia and JavaScript.
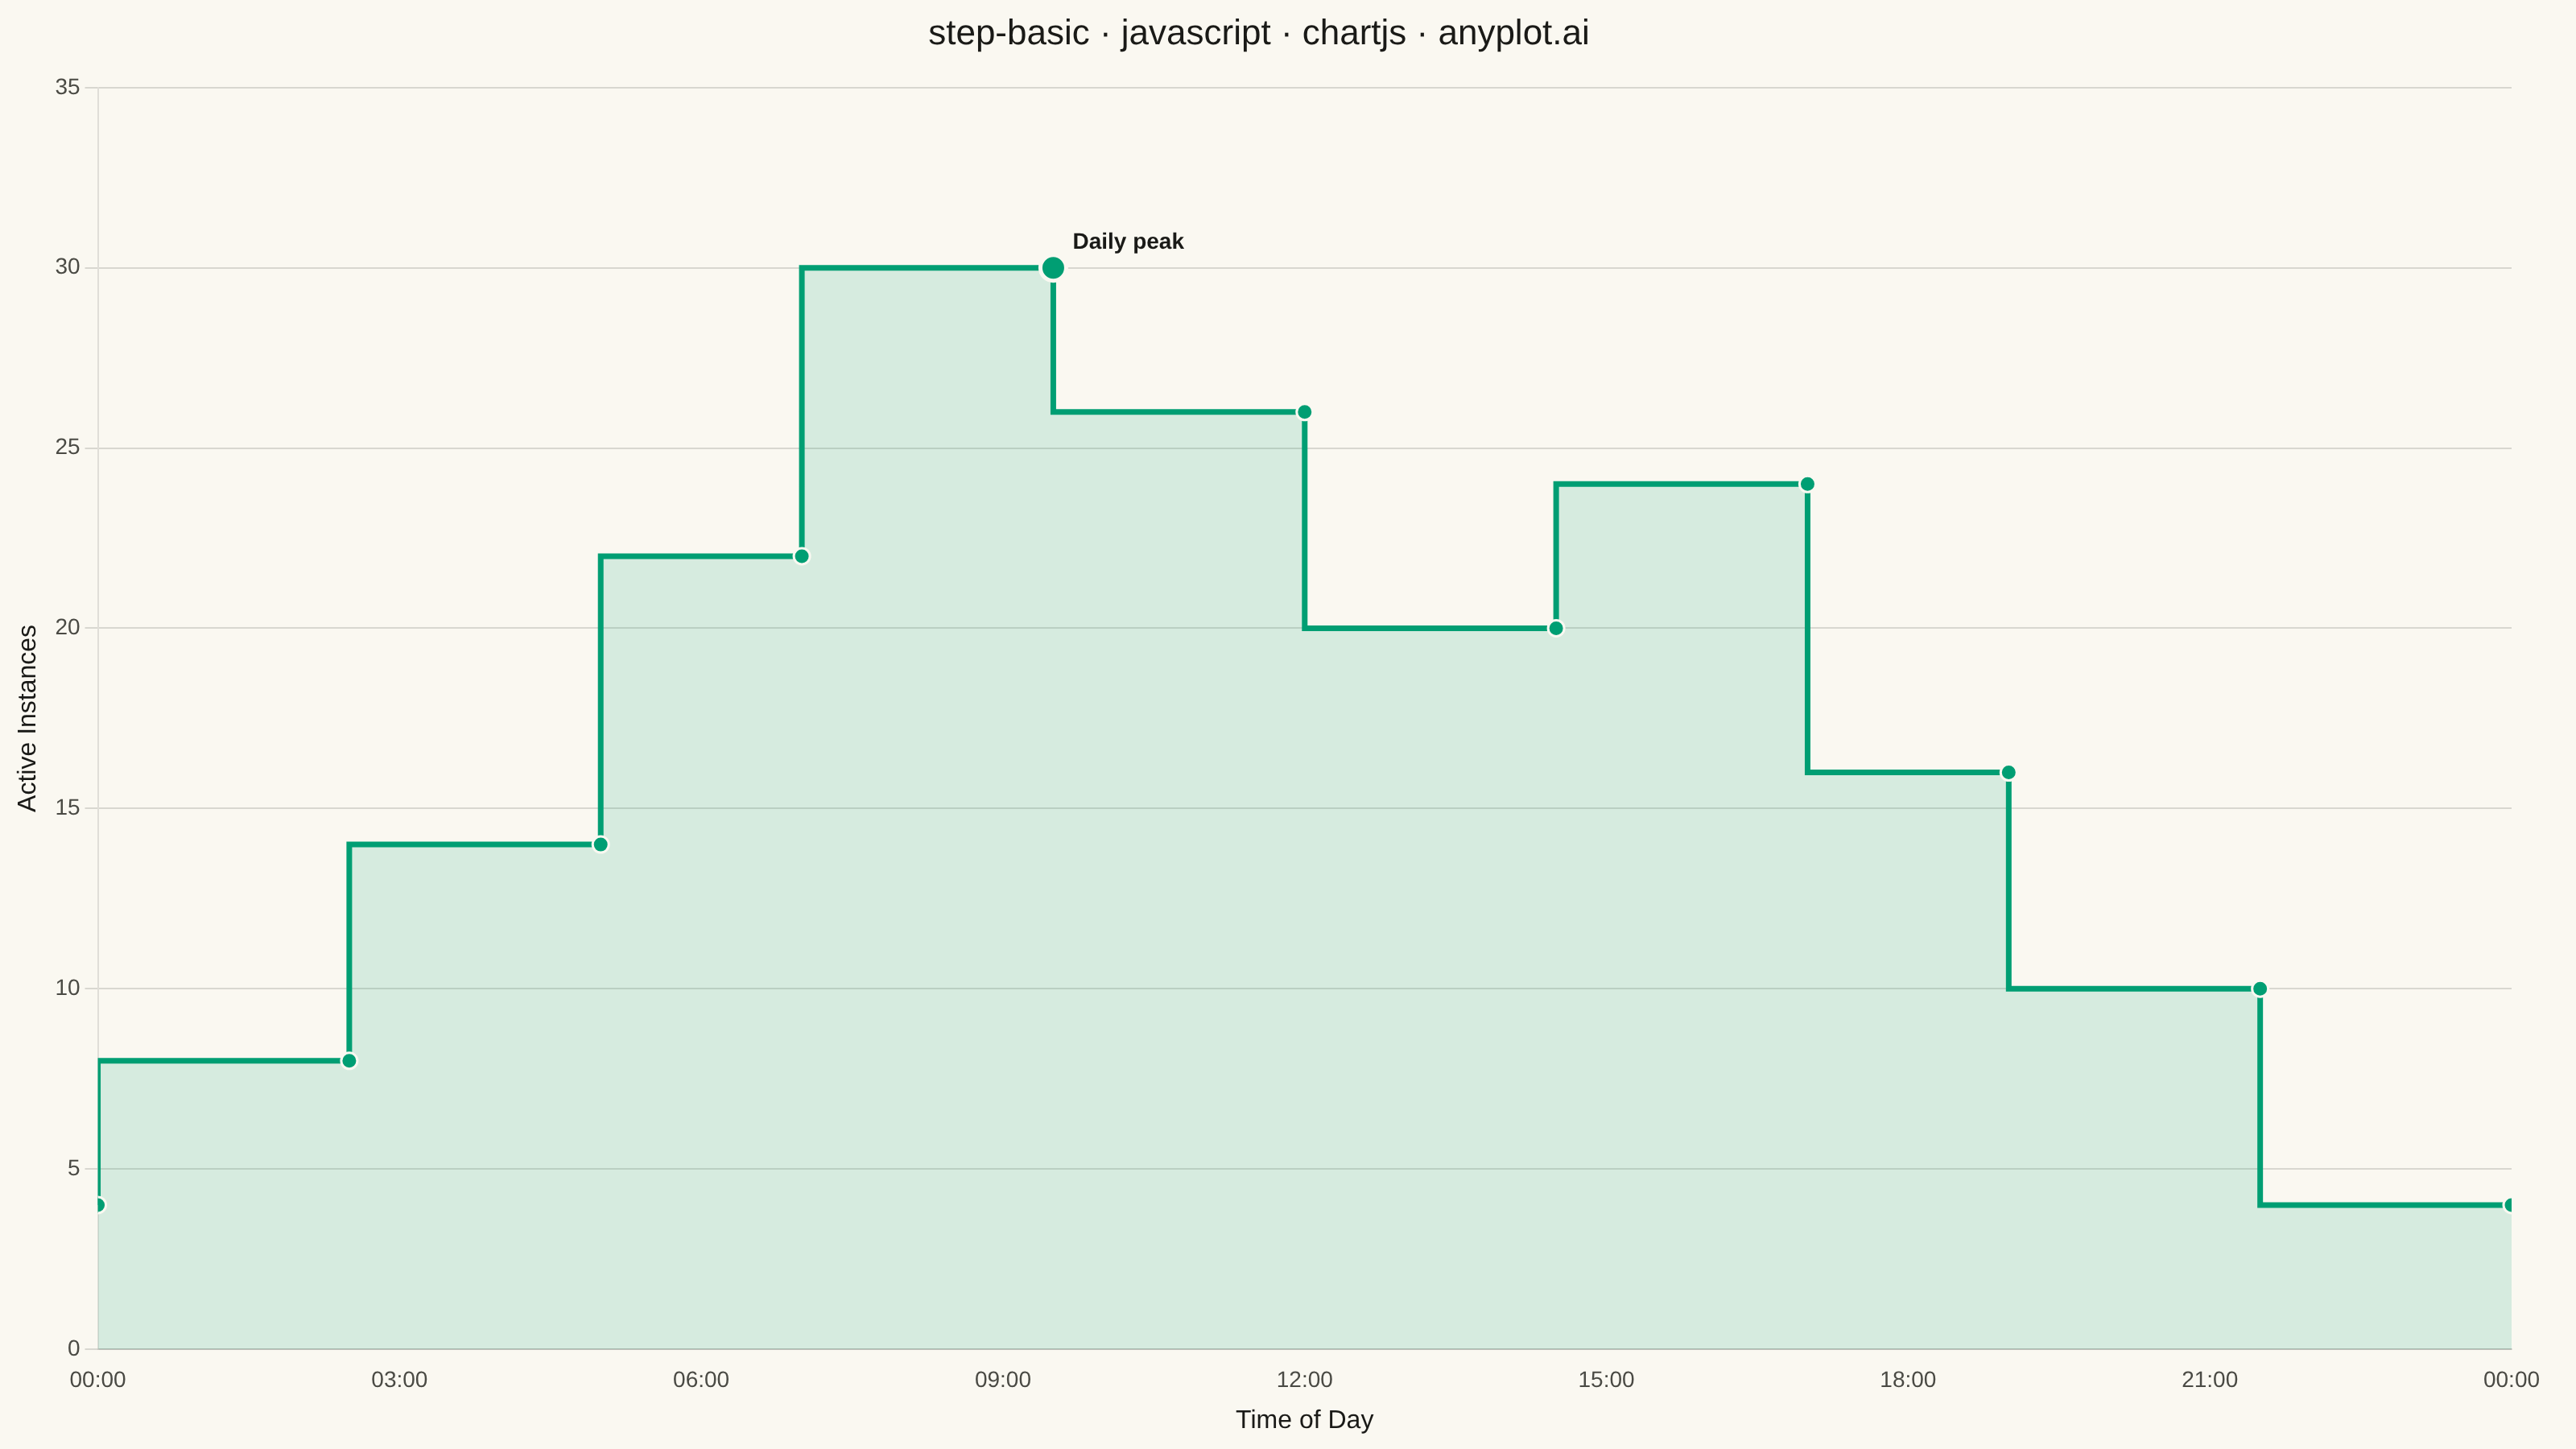
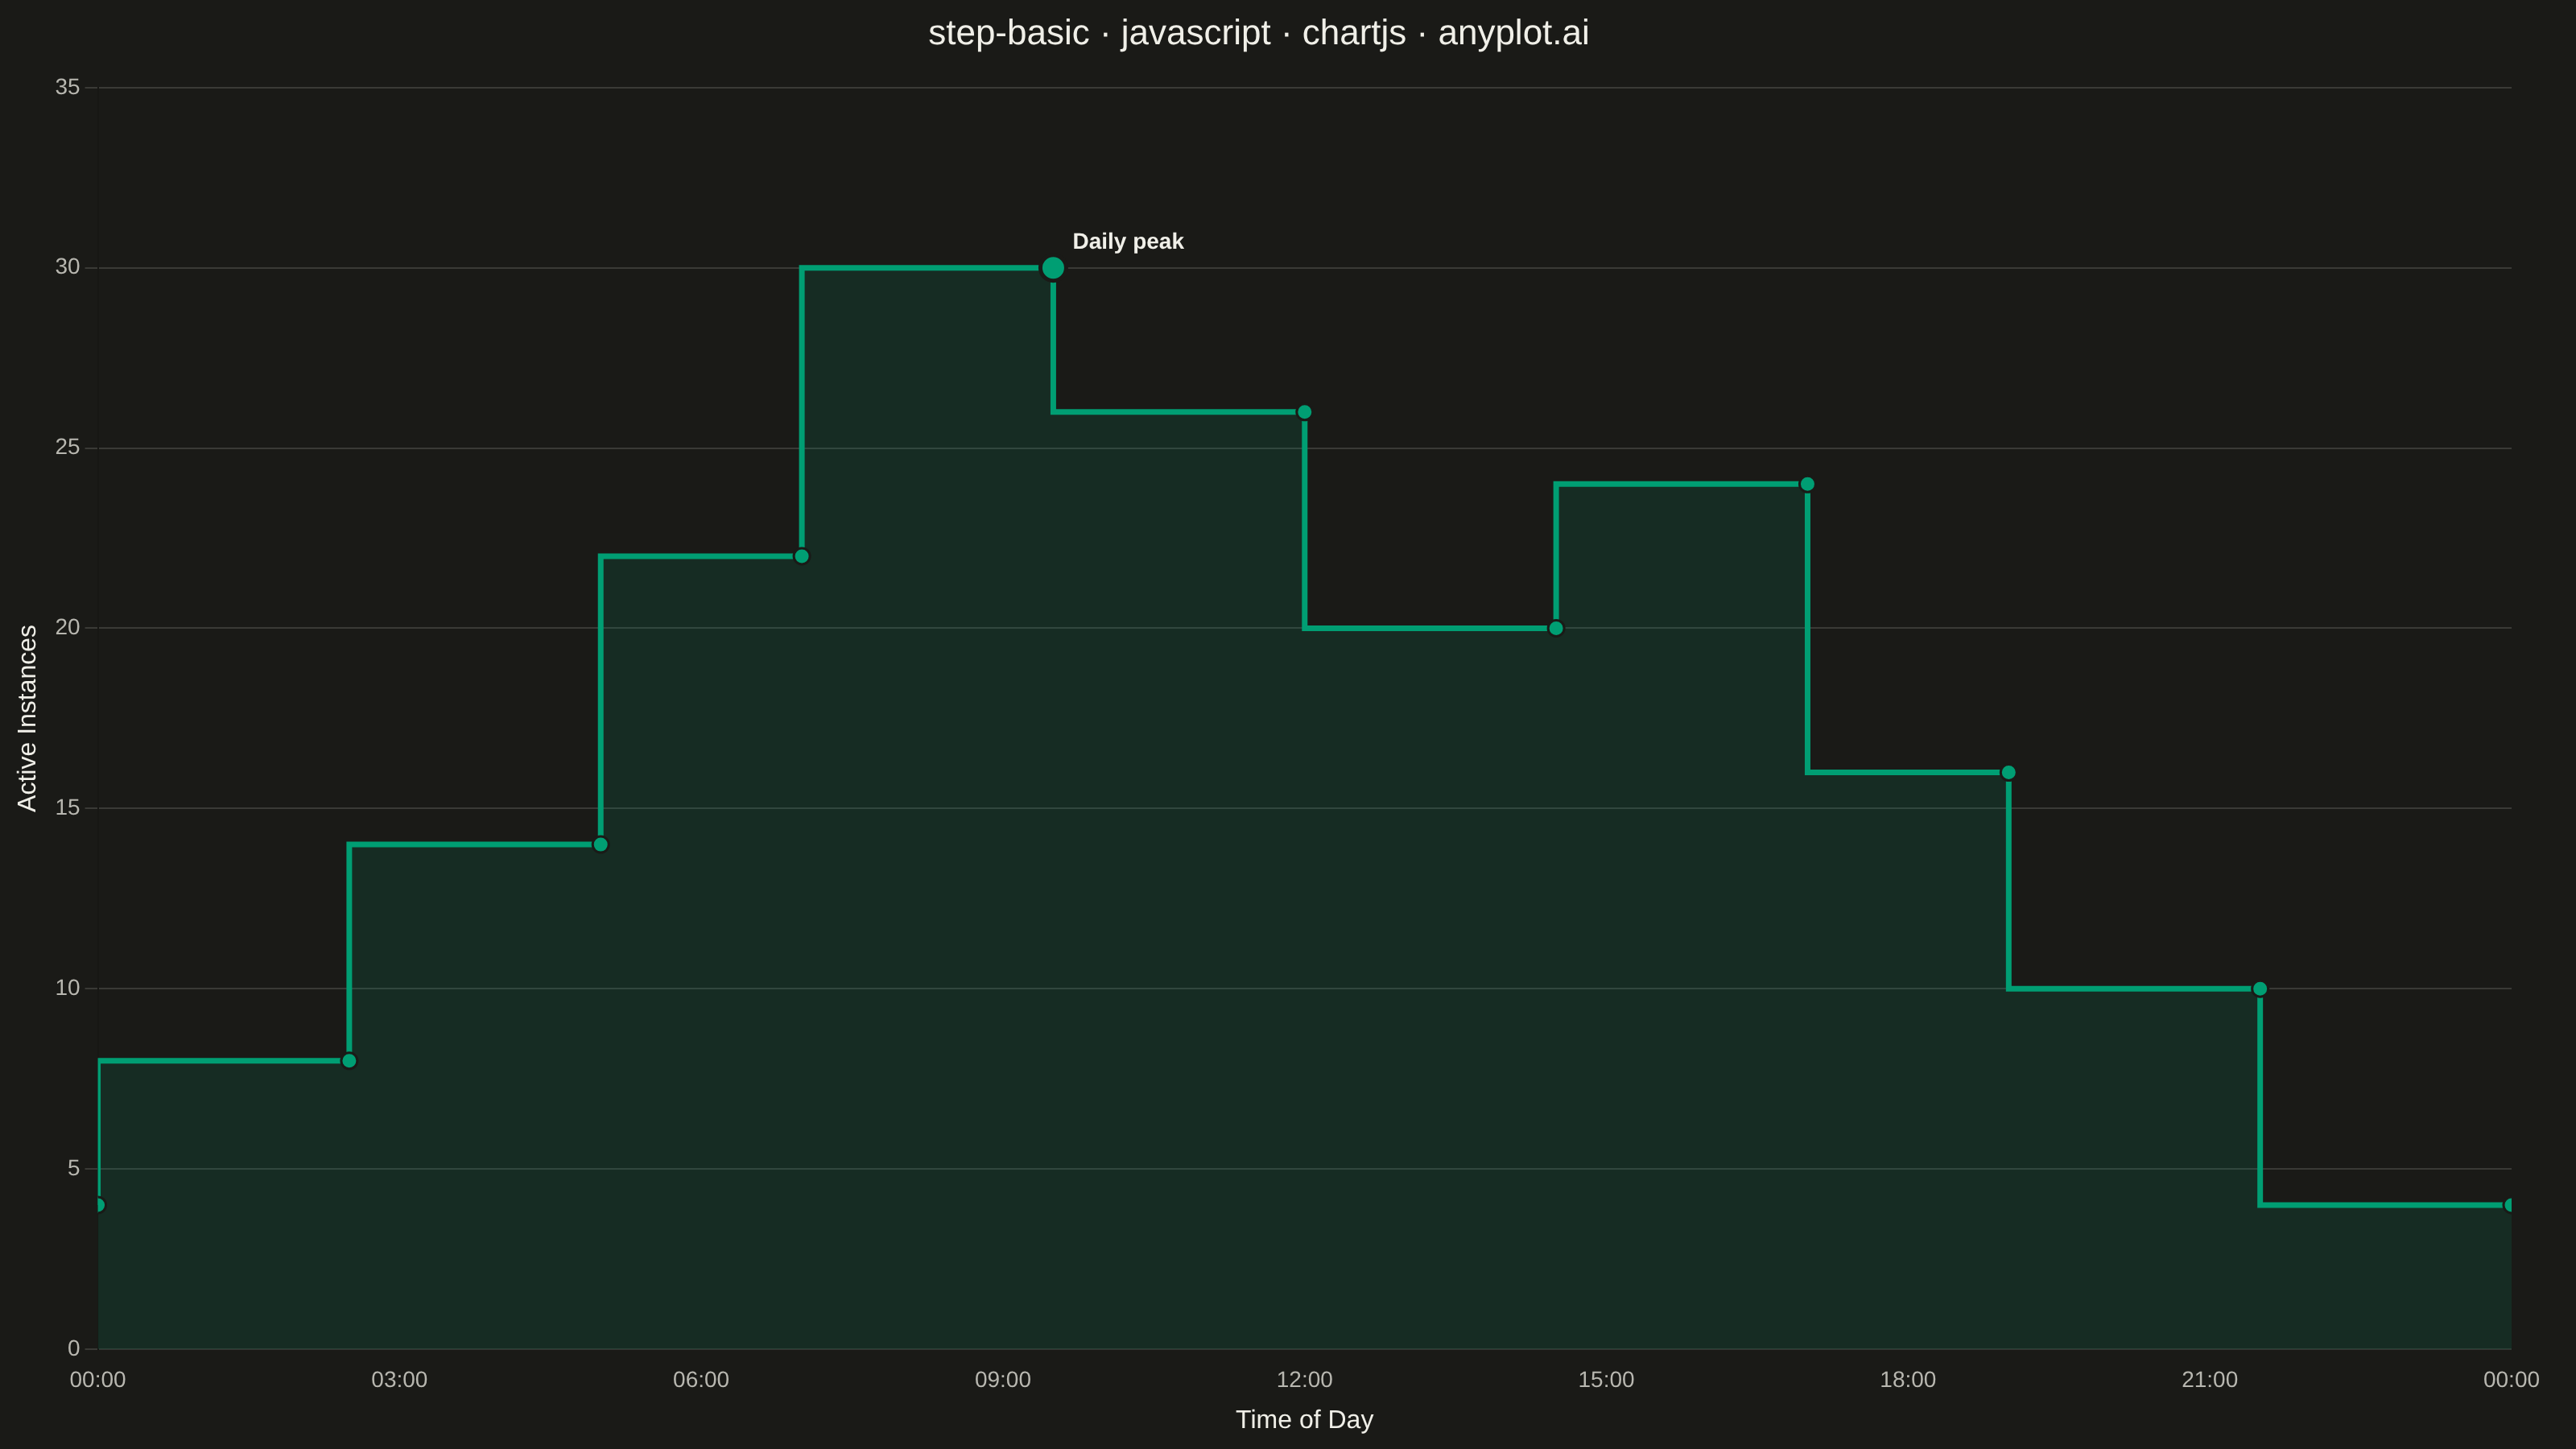
A step plot (also known as a stair plot or stepped line chart) displays data using horizontal lines connected by vertical lines, creating a stair-step pattern. Unlike line charts that interpolate between points, step plots show values as constant until the next change occurs. This makes them ideal for visualizing data that changes at discrete intervals, emphasizing the exact moments when values change.
// anyplot.ai
// step-basic: Basic Step Plot
// Library: chartjs 4.4.7 | JavaScript 22.23.1
// Quality: 90/100 | Created: 2026-07-25

const t = window.ANYPLOT_TOKENS;

// --- Data (in-memory, deterministic) ----------------------------------------
// Auto-scaling group size for a web service over a 24h day. Each point marks
// a scaling event; the instance count holds constant until the next event.
const scalingEvents = [
  { hour: 0, instances: 4 },
  { hour: 2.5, instances: 8 },
  { hour: 5, instances: 14 },
  { hour: 7, instances: 22 },
  { hour: 9.5, instances: 30 },
  { hour: 12, instances: 26 },
  { hour: 14.5, instances: 20 },
  { hour: 17, instances: 24 },
  { hour: 19, instances: 16 },
  { hour: 21.5, instances: 10 },
  { hour: 24, instances: 4 },
];
const points = scalingEvents.map((e) => ({ x: e.hour, y: e.instances }));
const peakIndex = points.reduce((best, p, i, arr) => (p.y > arr[best].y ? i : best), 0);

const formatHour = (hour) => {
  const h = Math.floor(hour) % 24;
  const m = Math.round((hour - Math.floor(hour)) * 60);
  return `${String(h).padStart(2, "0")}:${String(m).padStart(2, "0")}`;
};

const hexToRgba = (hex, alpha) => {
  const int = parseInt(hex.slice(1), 16);
  const r = (int >> 16) & 255;
  const g = (int >> 8) & 255;
  const b = int & 255;
  return `rgba(${r}, ${g}, ${b}, ${alpha})`;
};

// --- Mount -------------------------------------------------------------------
const canvas = document.createElement("canvas");
document.getElementById("container").appendChild(canvas);

// --- Peak callout plugin (labels the daily peak as a storytelling focal point) --
const peakCalloutPlugin = {
  id: "peakCallout",
  afterDatasetsDraw(chart) {
    const point = chart.getDatasetMeta(0).data[peakIndex];
    if (!point) return;
    const { ctx } = chart;
    ctx.save();
    ctx.fillStyle = t.ink;
    ctx.font = "600 14px sans-serif";
    ctx.textAlign = "left";
    ctx.fillText("Daily peak", point.x + 12, point.y - 12);
    ctx.restore();
  },
};

// --- Chart ---------------------------------------------------------------
new Chart(canvas, {
  type: "line",
  data: {
    datasets: [
      {
        label: "Active instances",
        data: points,
        stepped: "after",
        borderColor: t.palette[0],
        backgroundColor: hexToRgba(t.palette[0], 0.14),
        fill: "origin",
        borderWidth: 3.5,
        // Scriptable point styling: the daily-peak marker reads larger than the
        // rest, giving the viewer a focal point without introducing a new color.
        pointRadius: (ctx) => (ctx.dataIndex === peakIndex ? 8 : 5),
        pointHoverRadius: (ctx) => (ctx.dataIndex === peakIndex ? 9 : 6),
        pointBackgroundColor: t.palette[0],
        pointBorderColor: t.pageBg,
        pointBorderWidth: (ctx) => (ctx.dataIndex === peakIndex ? 2.5 : 1.5),
        tension: 0,
      },
    ],
  },
  plugins: [peakCalloutPlugin],
  options: {
    responsive: true,
    maintainAspectRatio: false,
    animation: false,
    layout: { padding: { top: 8, right: 40, bottom: 4, left: 4 } },
    plugins: {
      title: {
        display: true,
        text: "step-basic · javascript · chartjs · anyplot.ai",
        color: t.ink,
        font: { size: 22, weight: "500" },
        padding: { bottom: 20 },
      },
      legend: { display: false },
    },
    scales: {
      x: {
        type: "linear",
        min: 0,
        max: 24,
        ticks: {
          color: t.inkSoft,
          font: { size: 14 },
          stepSize: 3,
          callback: (value) => formatHour(value),
        },
        grid: { display: false },
        title: { display: true, text: "Time of Day", color: t.ink, font: { size: 16 } },
      },
      y: {
        beginAtZero: true,
        grace: "10%",
        ticks: { color: t.inkSoft, font: { size: 14 } },
        grid: { color: t.grid },
        title: { display: true, text: "Active Instances", color: t.ink, font: { size: 16 } },
      },
    },
  },
});
Runnable source as JSON, for any HTTP client: https://api.anyplot.ai/specs/step-basic/chartjs/code. Any spec id and library id listed in llms-full.txt fit the same URL shape; every URL below is complete and callable.
{
  "spec_id": "step-basic",
  "language": "javascript",
  "library": "chartjs",
  "page": "https://anyplot.ai/step-basic/javascript/chartjs",
  "hub": "https://anyplot.ai/step-basic",
  "code_json": "https://api.anyplot.ai/specs/step-basic/chartjs/code",
  "spec_json": "https://api.anyplot.ai/specs/step-basic",
  "render_light_png": "https://storage.googleapis.com/anyplot-images/plots/step-basic/javascript/chartjs/plot-light.png",
  "render_dark_png": "https://storage.googleapis.com/anyplot-images/plots/step-basic/javascript/chartjs/plot-dark.png",
  "interactive_light_html": "https://storage.googleapis.com/anyplot-images/plots/step-basic/javascript/chartjs/plot-light.html",
  "interactive_dark_html": "https://storage.googleapis.com/anyplot-images/plots/step-basic/javascript/chartjs/plot-dark.html",
  "quality_score": 90.0,
  "license": "MIT",
  "guide": "https://anyplot.ai/llms.txt"
}
Part of Basic Step Plot on anyplot.ai.