The same plot in 14 other libraries — Python: Altair, Bokeh, lets-plot, Matplotlib, Plotly, plotnine, Pygal, Seaborn; Julia: Makie.jl; JavaScript: Chart.js, D3.js, Apache ECharts, Highcharts, MUI X Charts. Compare all 15 side by side: Basic Step Plot in Python, R, Julia and JavaScript.
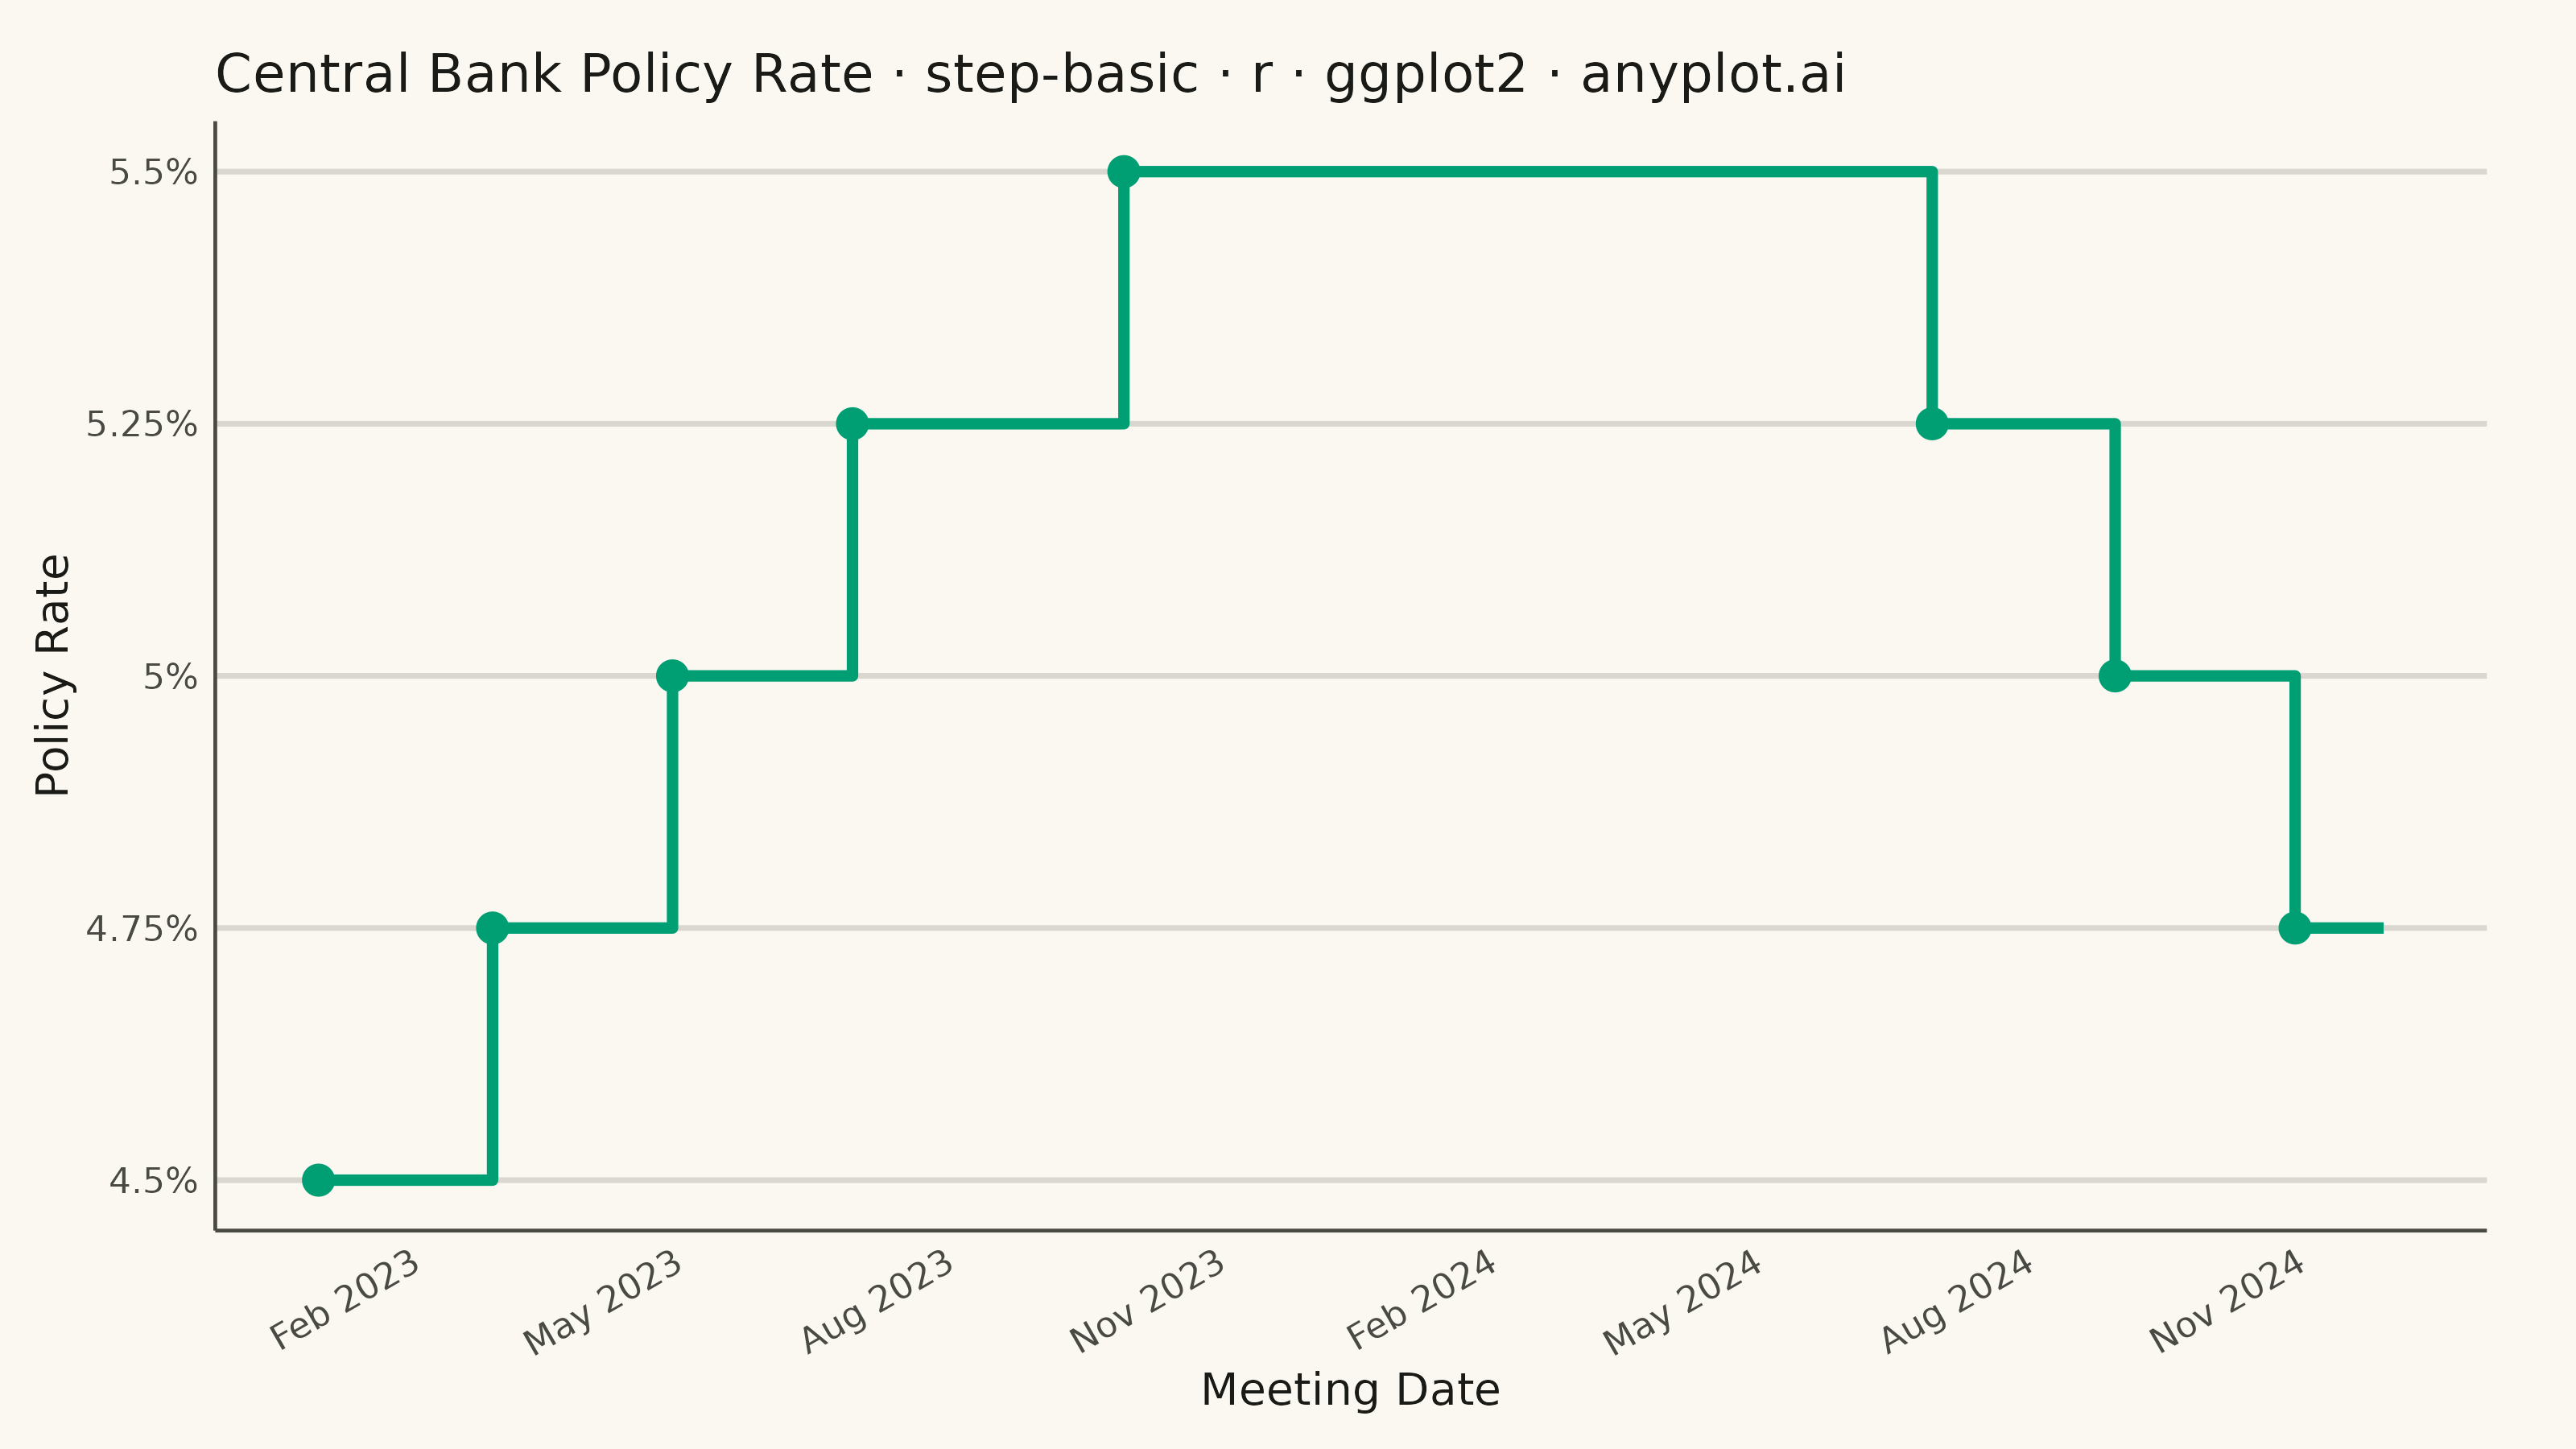
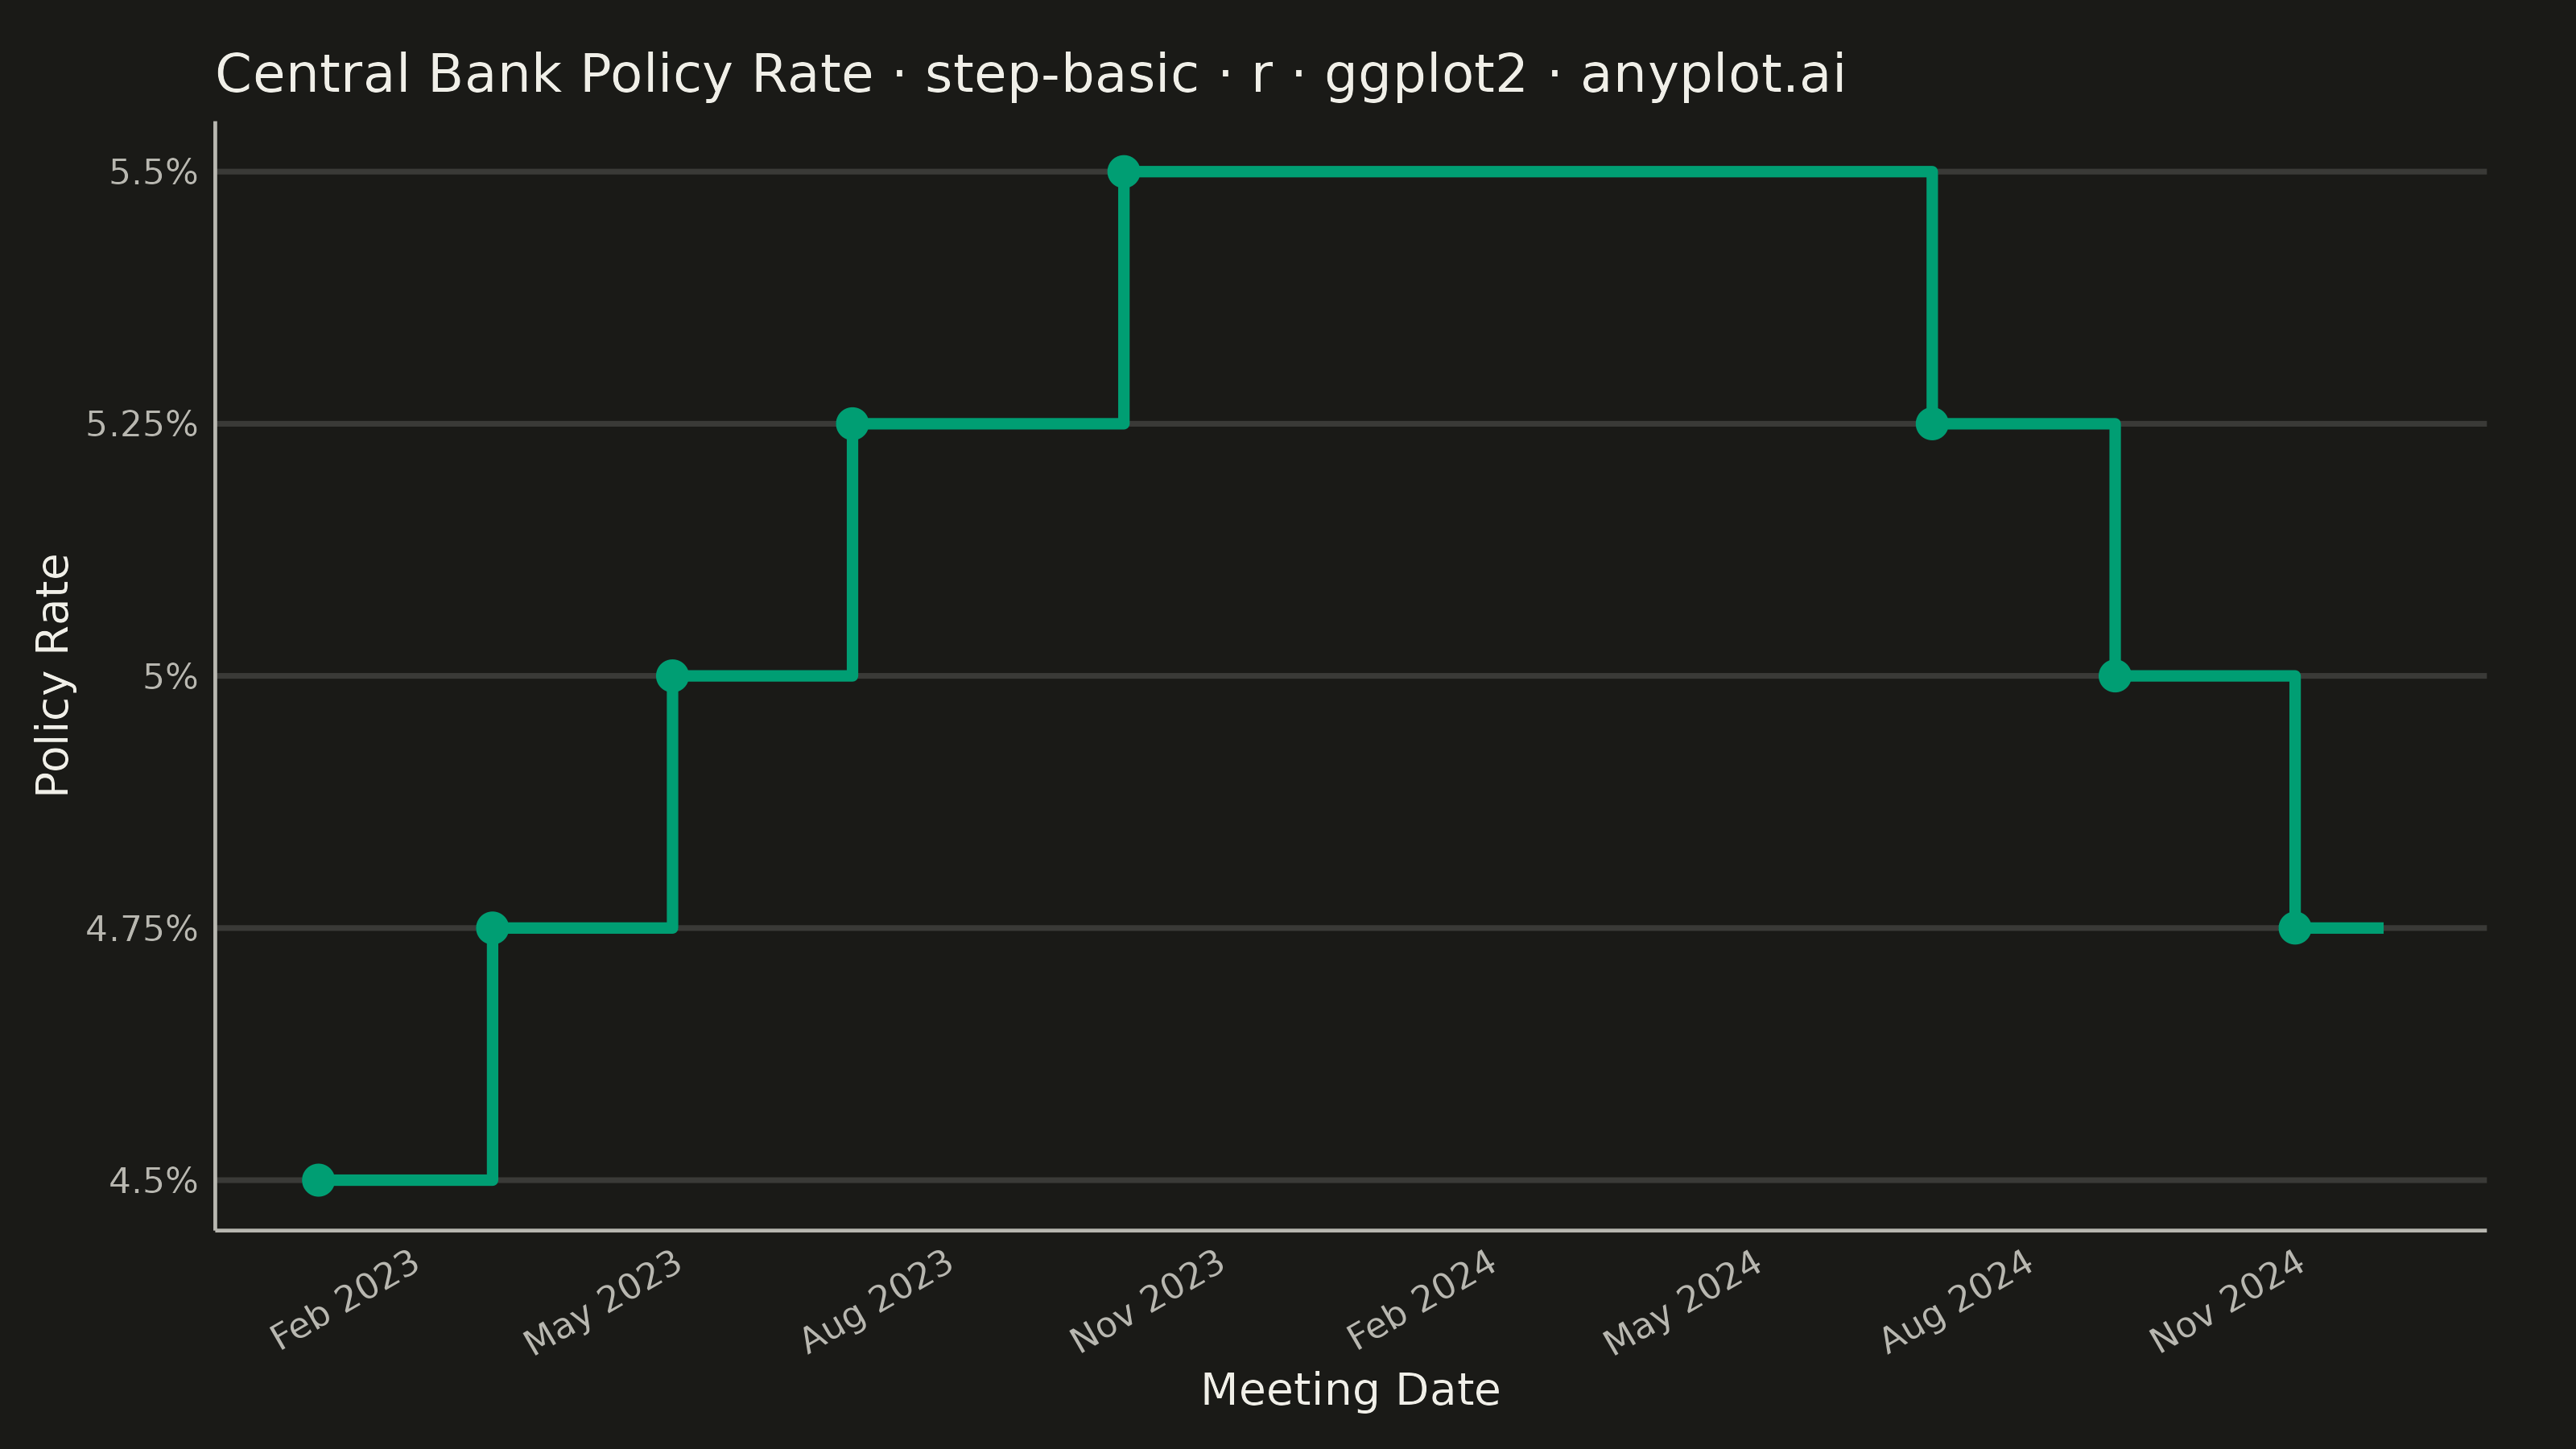
A step plot (also known as a stair plot or stepped line chart) displays data using horizontal lines connected by vertical lines, creating a stair-step pattern. Unlike line charts that interpolate between points, step plots show values as constant until the next change occurs. This makes them ideal for visualizing data that changes at discrete intervals, emphasizing the exact moments when values change.
#' anyplot.ai
#' step-basic: Basic Step Plot
#' Library: ggplot2 3.5.1 | R 4.4.1
#' Quality: 83/100 | Created: 2026-07-25

library(ggplot2)
library(dplyr)
library(scales)
library(ragg)

set.seed(42)

# --- Theme tokens -----------------------------------------------------------
THEME       <- Sys.getenv("ANYPLOT_THEME", "light")
PAGE_BG     <- if (THEME == "light") "#FAF8F1" else "#1A1A17"
INK         <- if (THEME == "light") "#1A1A17" else "#F0EFE8"
INK_SOFT    <- if (THEME == "light") "#4A4A44" else "#B8B7B0"
IMPRINT_PALETTE <- c(
  "#009E73", # 1 -- first categorical series (brand green)
  "#C475FD", # 2 -- lavender
  "#4467A3", # 3 -- blue
  "#BD8233", # 4 -- ochre
  "#AE3030", # 5 -- matte red (semantic anchor for bad / loss / error)
  "#2ABCCD", # 6 -- cyan
  "#954477", # 7 -- rose
  "#99B314"  # 8 -- lime
)

# --- Data ---------------------------------------------------------------
# Central bank policy rate held constant between meetings, stepping up or
# down whenever the committee votes to change it.
meeting_dates <- seq(as.Date("2023-01-01"), as.Date("2024-12-01"), by = "month")
policy_rate <- c(
  4.50, 4.50, 4.75, 4.75, 5.00, 5.00, 5.25, 5.25, 5.25, 5.50, 5.50, 5.50,
  5.50, 5.50, 5.50, 5.50, 5.50, 5.50, 5.25, 5.25, 5.00, 5.00, 4.75, 4.75
)
df <- tibble::tibble(date = meeting_dates, rate = policy_rate)

# Highlight only the meetings that actually changed the rate
changes <- df %>%
  filter(row_number() == 1 | rate != lag(rate))

# Mark the first meeting the cycle reached its peak rate, for a callout
peak_rate <- max(df$rate)
peak_date <- df$date[df$rate == peak_rate][1]

# --- Plot -----------------------------------------------------------------
p <- ggplot(df, aes(x = date, y = rate)) +
  geom_step(color = IMPRINT_PALETTE[1], linewidth = 1.2, direction = "hv") +
  geom_point(data = changes, color = IMPRINT_PALETTE[1], size = 3.8) +
  annotate(
    "text",
    x = peak_date, y = peak_rate + 0.18,
    label = sprintf("Cycle peak: %.2f%%", peak_rate),
    color = INK_SOFT, size = 3, hjust = 0
  ) +
  scale_x_date(date_breaks = "3 months", date_labels = "%b %Y") +
  scale_y_continuous(
    labels = function(x) paste0(x, "%"),
    expand = expansion(mult = c(0.05, 0.16))
  ) +
  labs(
    x = "Meeting Date",
    y = "Policy Rate (%)",
    title = "Central Bank Policy Rate · step-basic · r · ggplot2 · anyplot.ai"
  ) +
  theme_minimal(base_size = 8) +
  theme(
    plot.background   = element_rect(fill = PAGE_BG, color = PAGE_BG),
    panel.background  = element_rect(fill = PAGE_BG, color = NA),
    panel.grid.major.x = element_blank(),
    panel.grid.minor.x = element_blank(),
    panel.grid.minor.y = element_blank(),
    panel.grid.major.y = element_line(color = scales::alpha(INK, 0.15), linewidth = 0.6),
    axis.line         = element_line(color = INK_SOFT, linewidth = 0.4),
    axis.ticks        = element_blank(),
    axis.title        = element_text(color = INK, size = 10),
    axis.text         = element_text(color = INK_SOFT, size = 8),
    axis.text.x       = element_text(angle = 30, hjust = 1),
    plot.title        = element_text(color = INK, size = 12, face = "plain"),
    plot.margin       = margin(t = 12, r = 20, b = 8, l = 8)
  )

# --- Save -------------------------------------------------------------------
ggsave(
  filename = sprintf("plot-%s.png", THEME),
  plot     = p,
  device   = ragg::agg_png,
  width    = 8,
  height   = 4.5,
  units    = "in",
  dpi      = 400
)
Runnable source as JSON, for any HTTP client: https://api.anyplot.ai/specs/step-basic/ggplot2/code. Any spec id and library id listed in llms-full.txt fit the same URL shape; every URL below is complete and callable.
{
  "spec_id": "step-basic",
  "language": "r",
  "library": "ggplot2",
  "page": "https://anyplot.ai/step-basic/r/ggplot2",
  "hub": "https://anyplot.ai/step-basic",
  "code_json": "https://api.anyplot.ai/specs/step-basic/ggplot2/code",
  "spec_json": "https://api.anyplot.ai/specs/step-basic",
  "render_light_png": "https://storage.googleapis.com/anyplot-images/plots/step-basic/r/ggplot2/plot-light.png",
  "render_dark_png": "https://storage.googleapis.com/anyplot-images/plots/step-basic/r/ggplot2/plot-dark.png",
  "quality_score": 83.0,
  "license": "MIT",
  "guide": "https://anyplot.ai/llms.txt"
}
Part of Basic Step Plot on anyplot.ai.