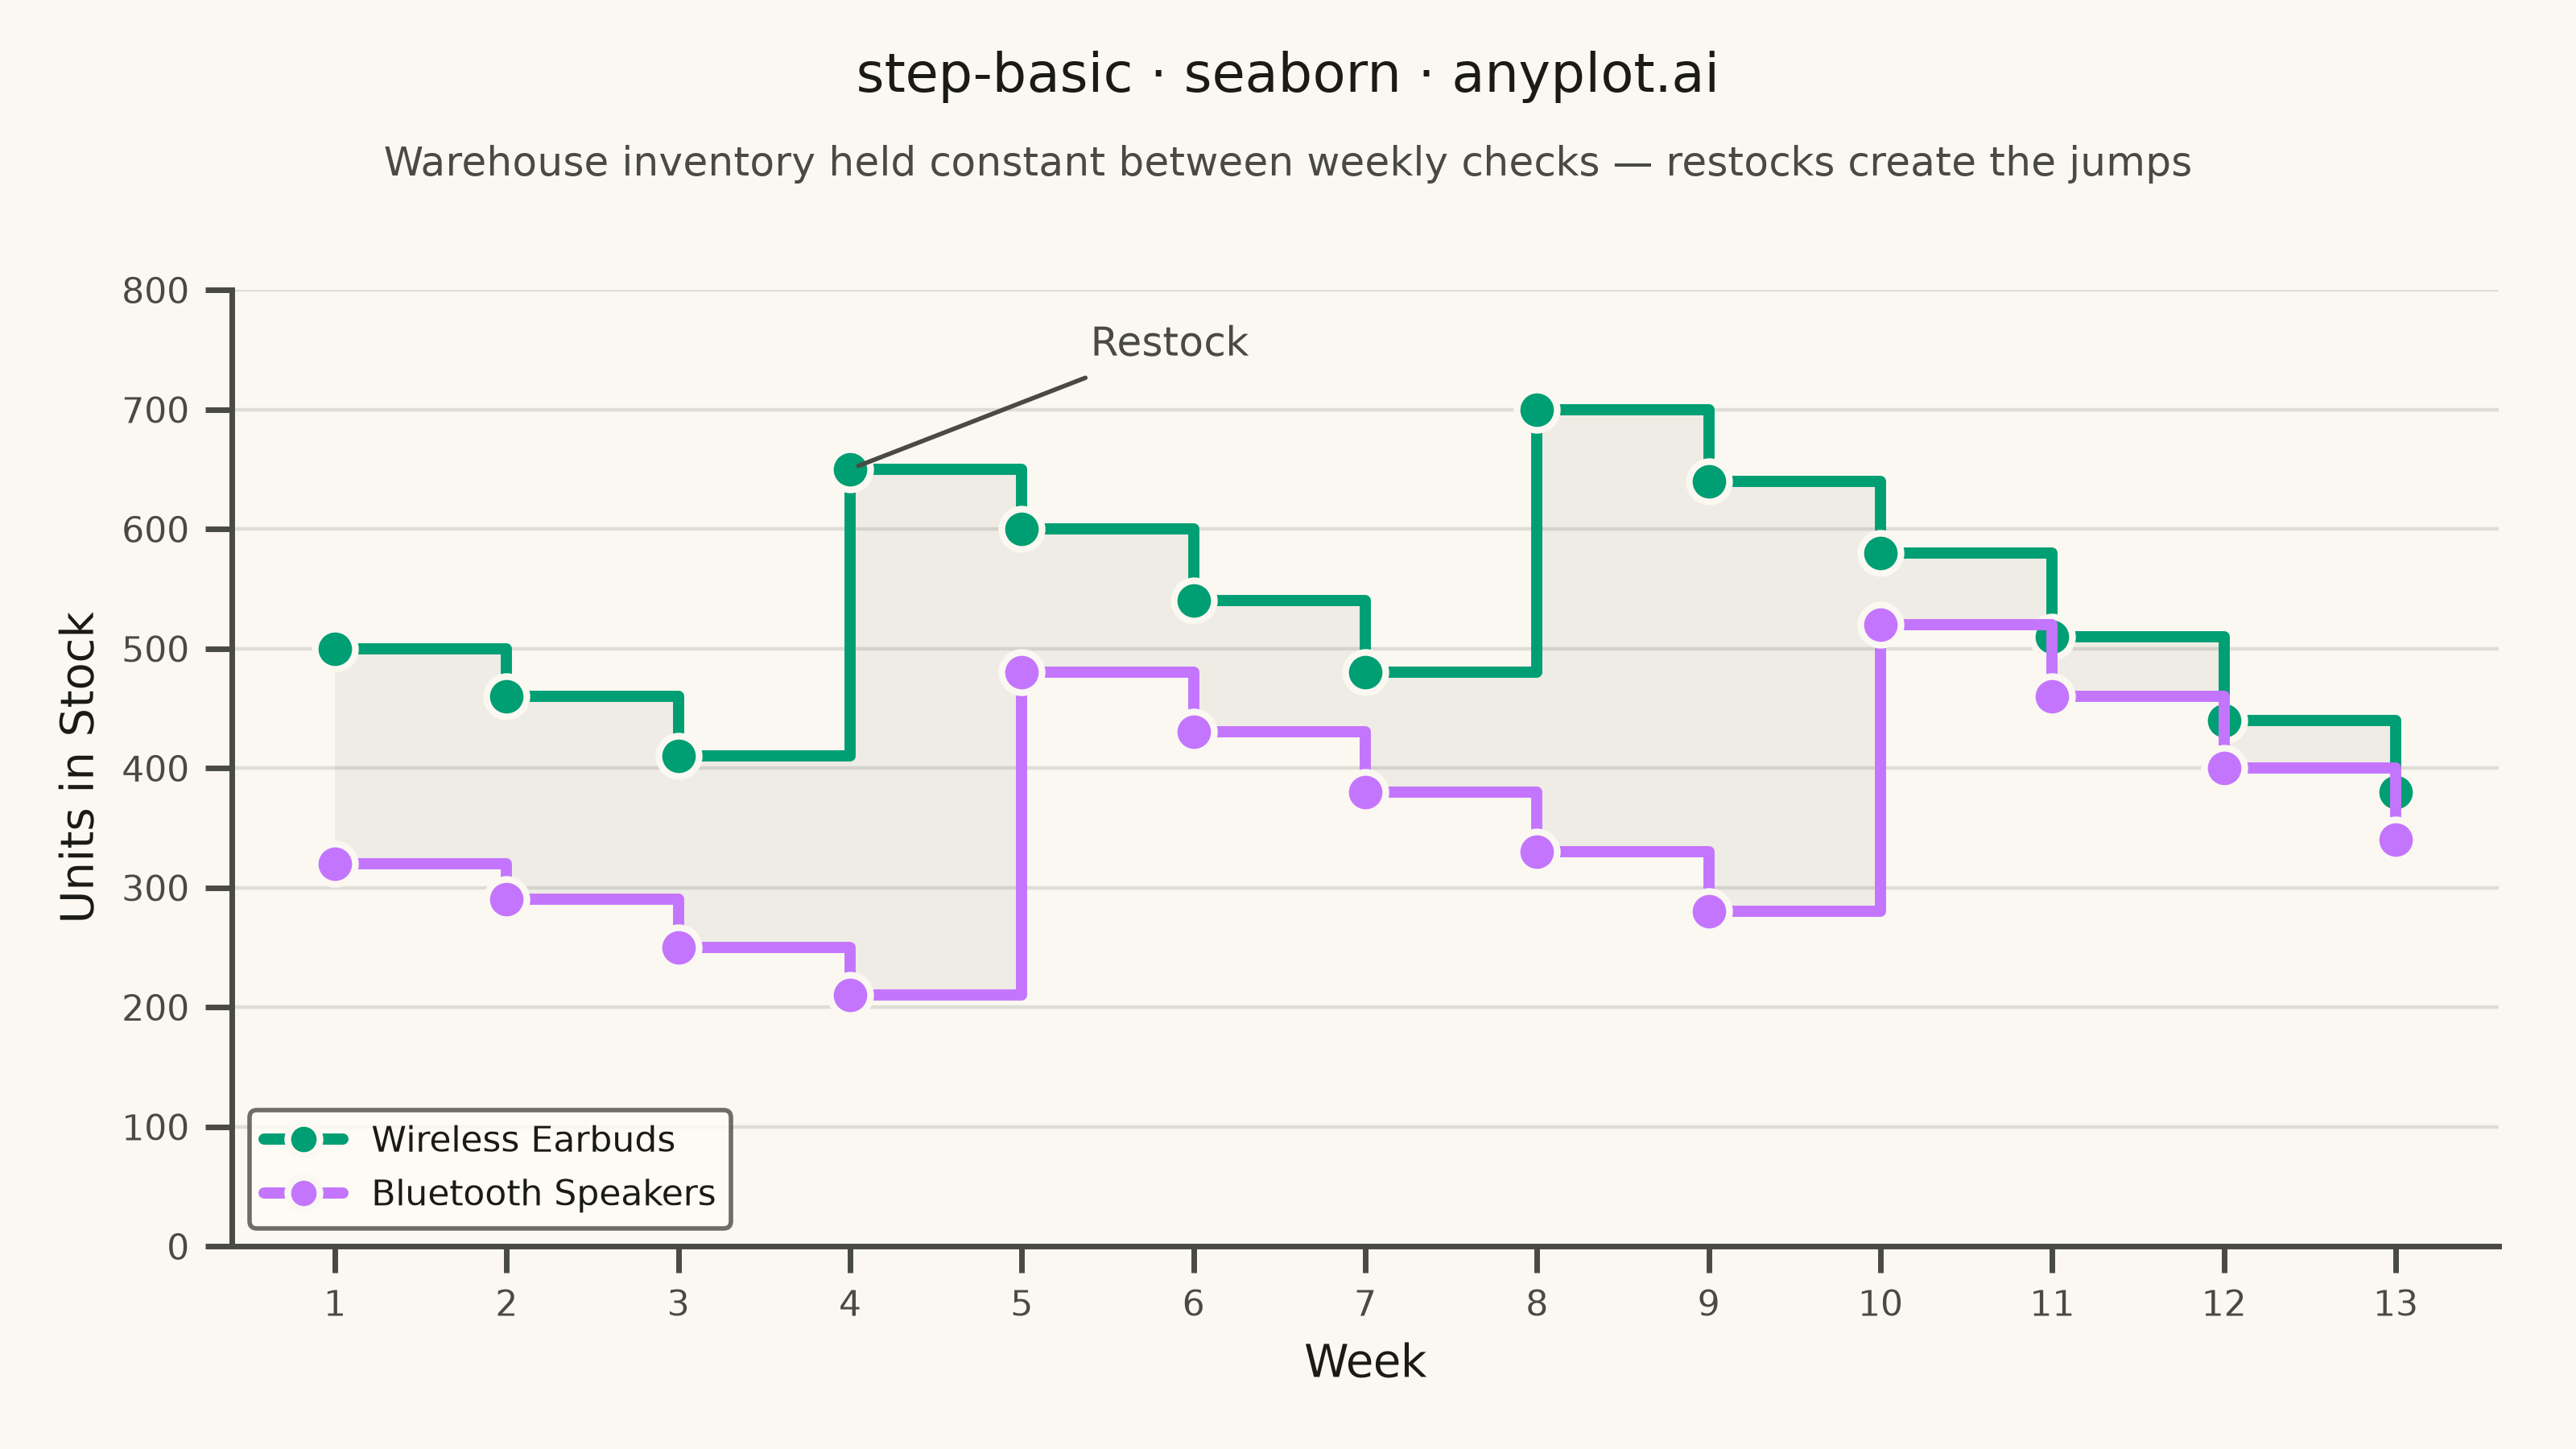
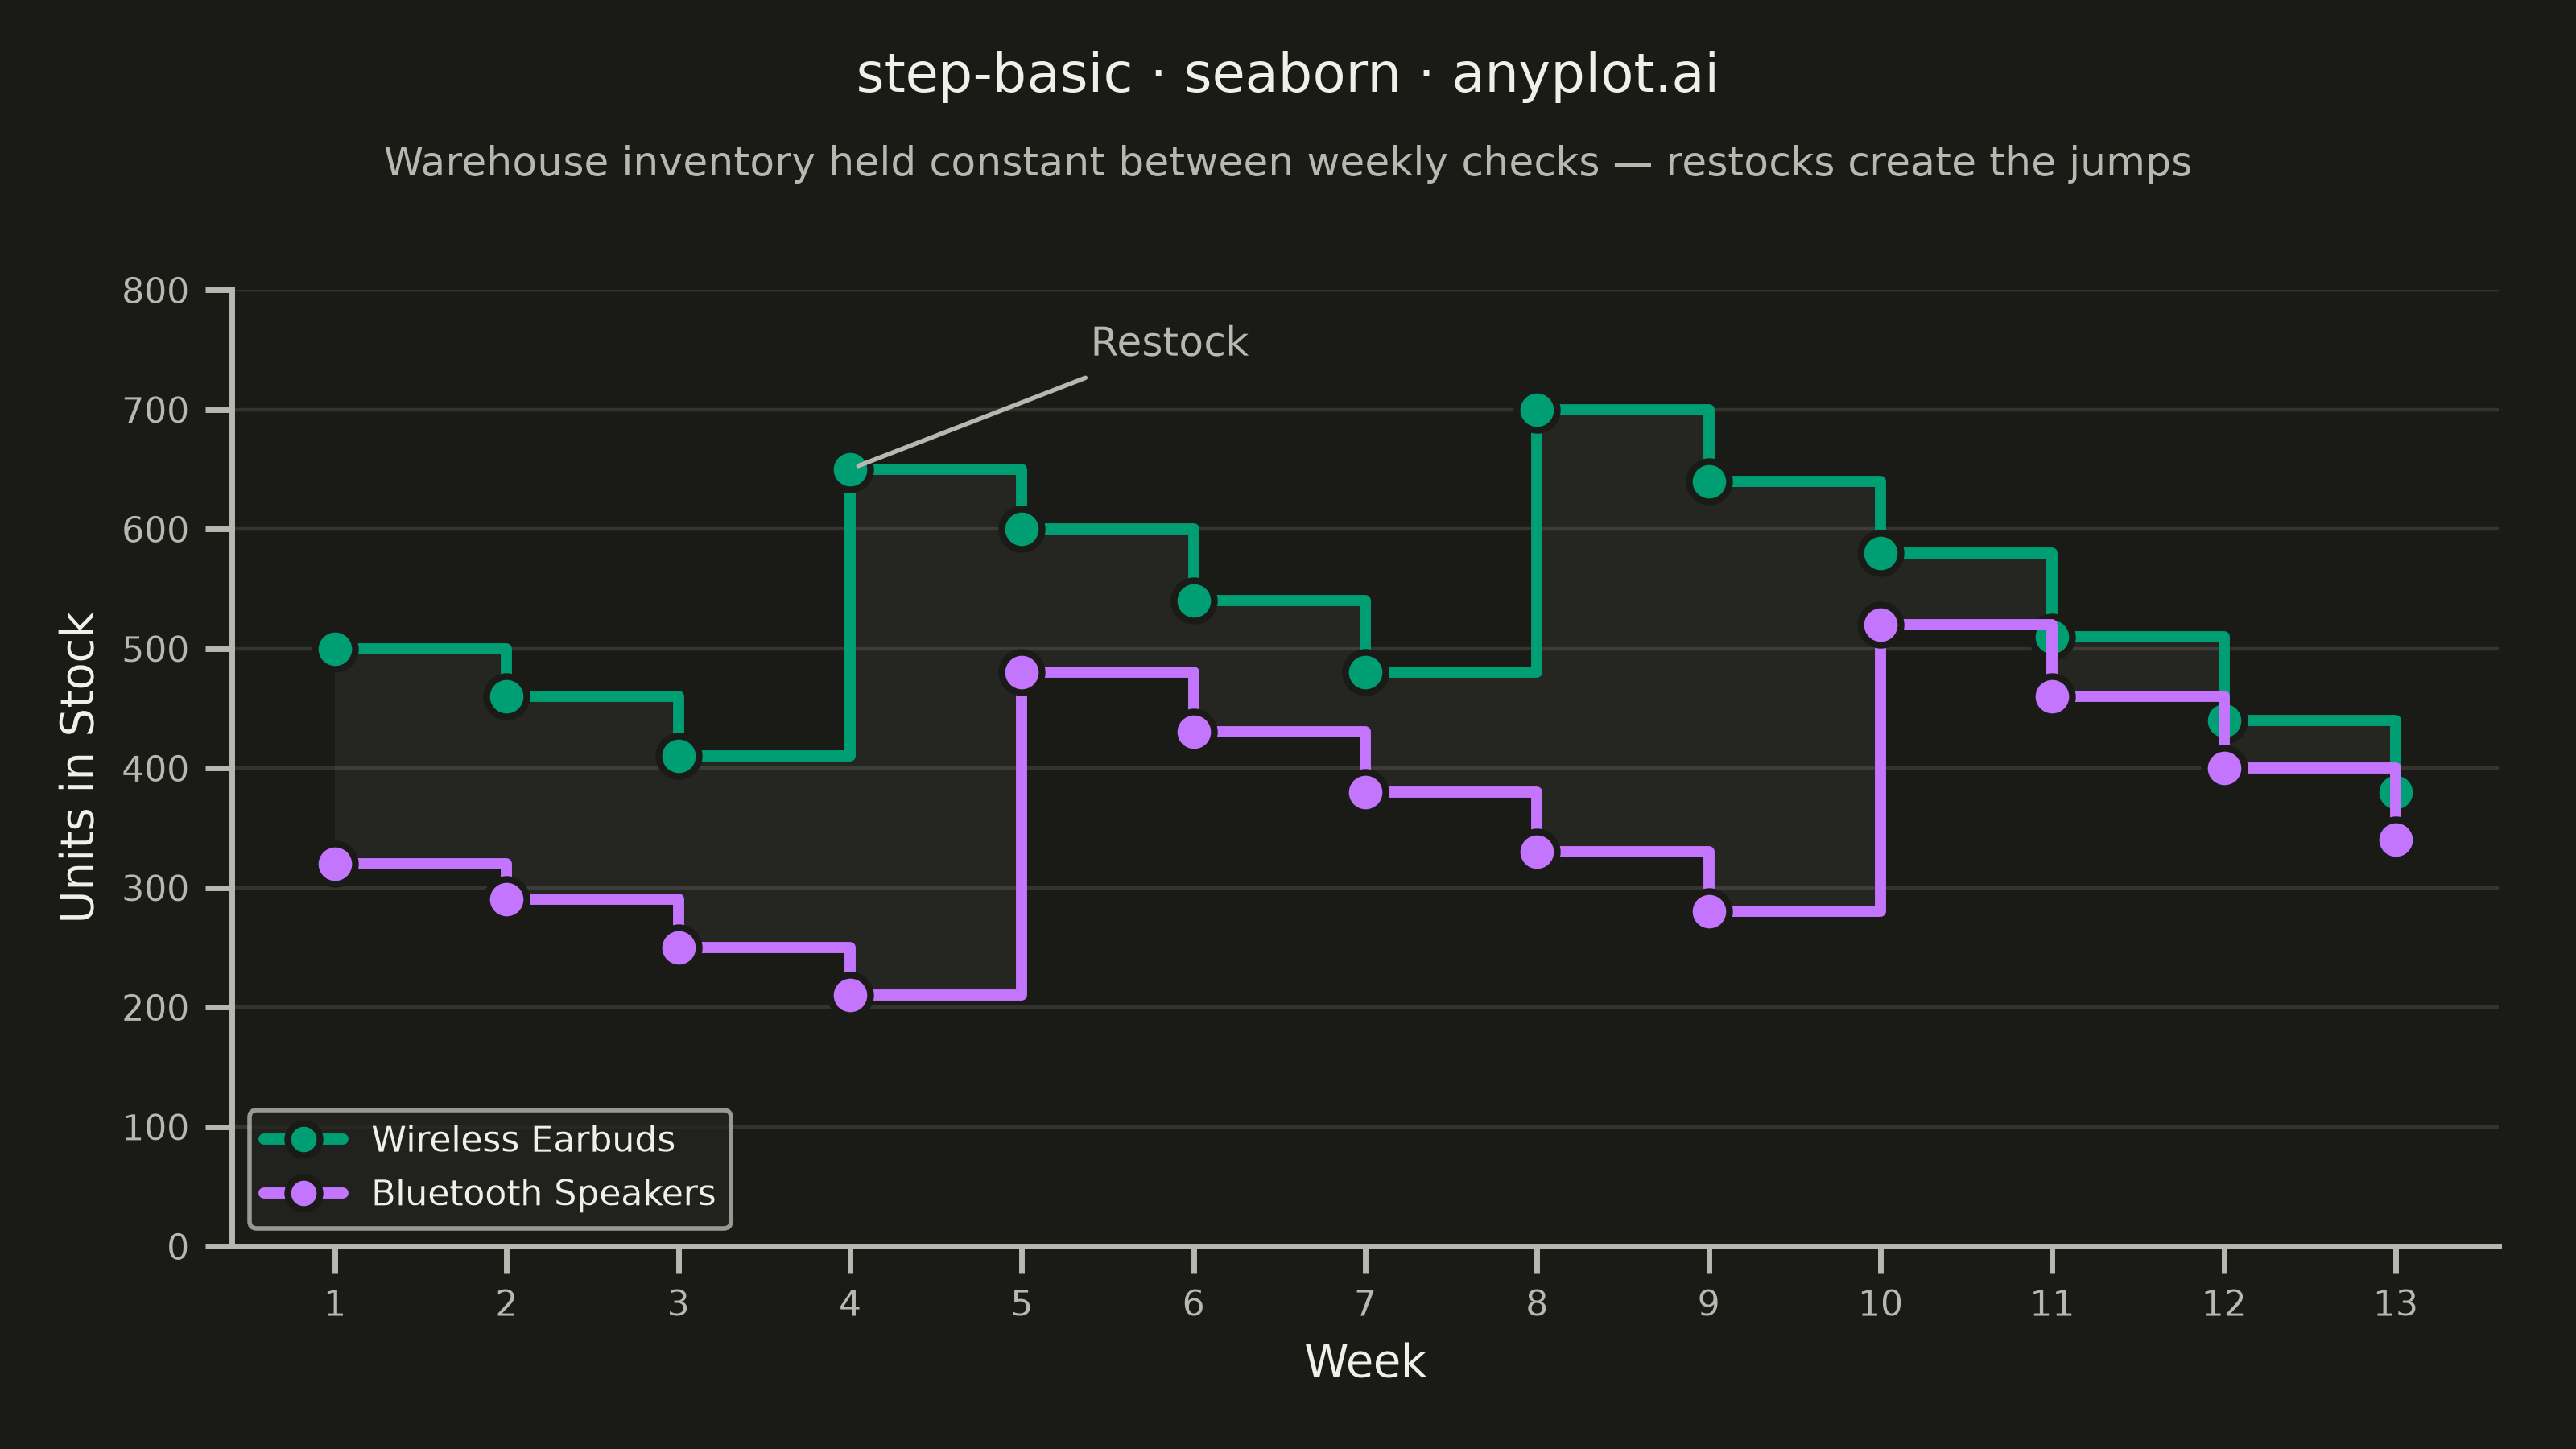
A step plot (also known as a stair plot or stepped line chart) displays data using horizontal lines connected by vertical lines, creating a stair-step pattern. Unlike line charts that interpolate between points, step plots show values as constant until the next change occurs. This makes them ideal for visualizing data that changes at discrete intervals, emphasizing the exact moments when values change.
""" anyplot.ai
step-basic: Basic Step Plot
Library: seaborn 0.13.2 | Python 3.13.14
Quality: 92/100 | Updated: 2026-07-25
"""

import os

import matplotlib.pyplot as plt
import numpy as np
import pandas as pd
import seaborn as sns


# Theme tokens (Imprint — see prompts/default-style-guide.md)
THEME = os.getenv("ANYPLOT_THEME", "light")
PAGE_BG = "#FAF8F1" if THEME == "light" else "#1A1A17"
ELEVATED_BG = "#FFFDF6" if THEME == "light" else "#242420"
INK = "#1A1A17" if THEME == "light" else "#F0EFE8"
INK_SOFT = "#4A4A44" if THEME == "light" else "#B8B7B0"
MUTED = "#6B6A63" if THEME == "light" else "#A8A79F"
IMPRINT_PALETTE = ["#009E73", "#C475FD"]  # brand green, lavender

# Data - warehouse inventory levels held between restock events (13 weekly checks)
weeks = np.arange(1, 14)
earbuds_stock = np.array([500, 460, 410, 650, 600, 540, 480, 700, 640, 580, 510, 440, 380])
speakers_stock = np.array([320, 290, 250, 210, 480, 430, 380, 330, 280, 520, 460, 400, 340])

df = pd.DataFrame(
    {
        "Week": np.concatenate([weeks, weeks]),
        "Units in Stock": np.concatenate([earbuds_stock, speakers_stock]),
        "Product": ["Wireless Earbuds"] * len(weeks) + ["Bluetooth Speakers"] * len(weeks),
    }
)

# Plot
sns.set_theme(
    style="ticks",
    rc={
        "figure.facecolor": PAGE_BG,
        "axes.facecolor": PAGE_BG,
        "axes.edgecolor": INK_SOFT,
        "axes.labelcolor": INK,
        "text.color": INK,
        "xtick.color": INK_SOFT,
        "ytick.color": INK_SOFT,
        "grid.color": INK,
        "grid.alpha": 0.12,
        "legend.facecolor": ELEVATED_BG,
        "legend.edgecolor": INK_SOFT,
    },
)

fig, ax = plt.subplots(figsize=(8, 4.5), dpi=400, facecolor=PAGE_BG)
ax.set_facecolor(PAGE_BG)

# Muted fill between the two step curves - highlights the stock differential
# without competing with the data lines (semantic "muted" anchor, not a data color)
ax.fill_between(weeks, earbuds_stock, speakers_stock, step="post", color=MUTED, alpha=0.08, linewidth=0, zorder=1)

# Single hue-mapped lineplot drives both step series and the shared legend
sns.lineplot(
    data=df,
    x="Week",
    y="Units in Stock",
    hue="Product",
    hue_order=["Wireless Earbuds", "Bluetooth Speakers"],
    palette=IMPRINT_PALETTE,
    drawstyle="steps-post",
    linewidth=2.5,
    marker="o",
    markersize=9,
    markeredgecolor=PAGE_BG,
    markeredgewidth=1.5,
    ax=ax,
    zorder=3,
)

# Restock annotation - the single largest jump (Wireless Earbuds week 3->4, +240 units)
# is the defining moment a step plot exists to show
ax.annotate(
    "Restock: +240 units",
    xy=(4, 650),
    xytext=(5.4, 745),
    fontsize=9,
    fontweight="medium",
    color=INK,
    ha="left",
    arrowprops={"arrowstyle": "-", "color": INK_SOFT, "linewidth": 1},
)

# Style - title and subtitle anchored to the figure (not the axes) to avoid overlap
fig.text(
    0.5,
    0.965,
    "step-basic · python · seaborn · anyplot.ai",
    fontsize=12,
    fontweight="medium",
    color=INK,
    ha="center",
    va="top",
)
fig.text(
    0.5,
    0.90,
    "Warehouse inventory held constant between weekly checks — restocks create the jumps",
    fontsize=9,
    color=INK_SOFT,
    ha="center",
    va="top",
)
ax.set_xlabel("Week", fontsize=10, color=INK)
ax.set_ylabel("Units in Stock", fontsize=10, color=INK)
ax.tick_params(axis="both", labelsize=8, colors=INK_SOFT)
ax.set_xticks(weeks)
ax.set_ylim(0, 800)
ax.yaxis.grid(True, alpha=0.12, linewidth=0.8, color=INK)
ax.spines["top"].set_visible(False)
ax.spines["right"].set_visible(False)
for spine in ("left", "bottom"):
    ax.spines[spine].set_color(INK_SOFT)

legend = ax.legend(fontsize=8, title=None, loc="lower left", frameon=True, handlelength=2.2, markerscale=0.8)
legend.get_frame().set_facecolor(ELEVATED_BG)
legend.get_frame().set_edgecolor("none")
legend.get_frame().set_alpha(0.85)

fig.subplots_adjust(top=0.80, bottom=0.14, left=0.09, right=0.97)
plt.savefig(f"plot-{THEME}.png", dpi=400, facecolor=PAGE_BG)
Runnable source as JSON, for any HTTP client: https://api.anyplot.ai/specs/step-basic/seaborn/code. Any spec id and library id listed in llms-full.txt fit the same URL shape; every URL below is complete and callable.
{
  "spec_id": "step-basic",
  "language": "python",
  "library": "seaborn",
  "page": "https://anyplot.ai/step-basic/python/seaborn",
  "hub": "https://anyplot.ai/step-basic",
  "code_json": "https://api.anyplot.ai/specs/step-basic/seaborn/code",
  "spec_json": "https://api.anyplot.ai/specs/step-basic",
  "render_light_png": "https://storage.googleapis.com/anyplot-images/plots/step-basic/python/seaborn/plot-light.png",
  "render_dark_png": "https://storage.googleapis.com/anyplot-images/plots/step-basic/python/seaborn/plot-dark.png",
  "quality_score": 92.0,
  "license": "MIT",
  "guide": "https://anyplot.ai/llms.txt"
}
Part of Basic Step Plot on anyplot.ai.