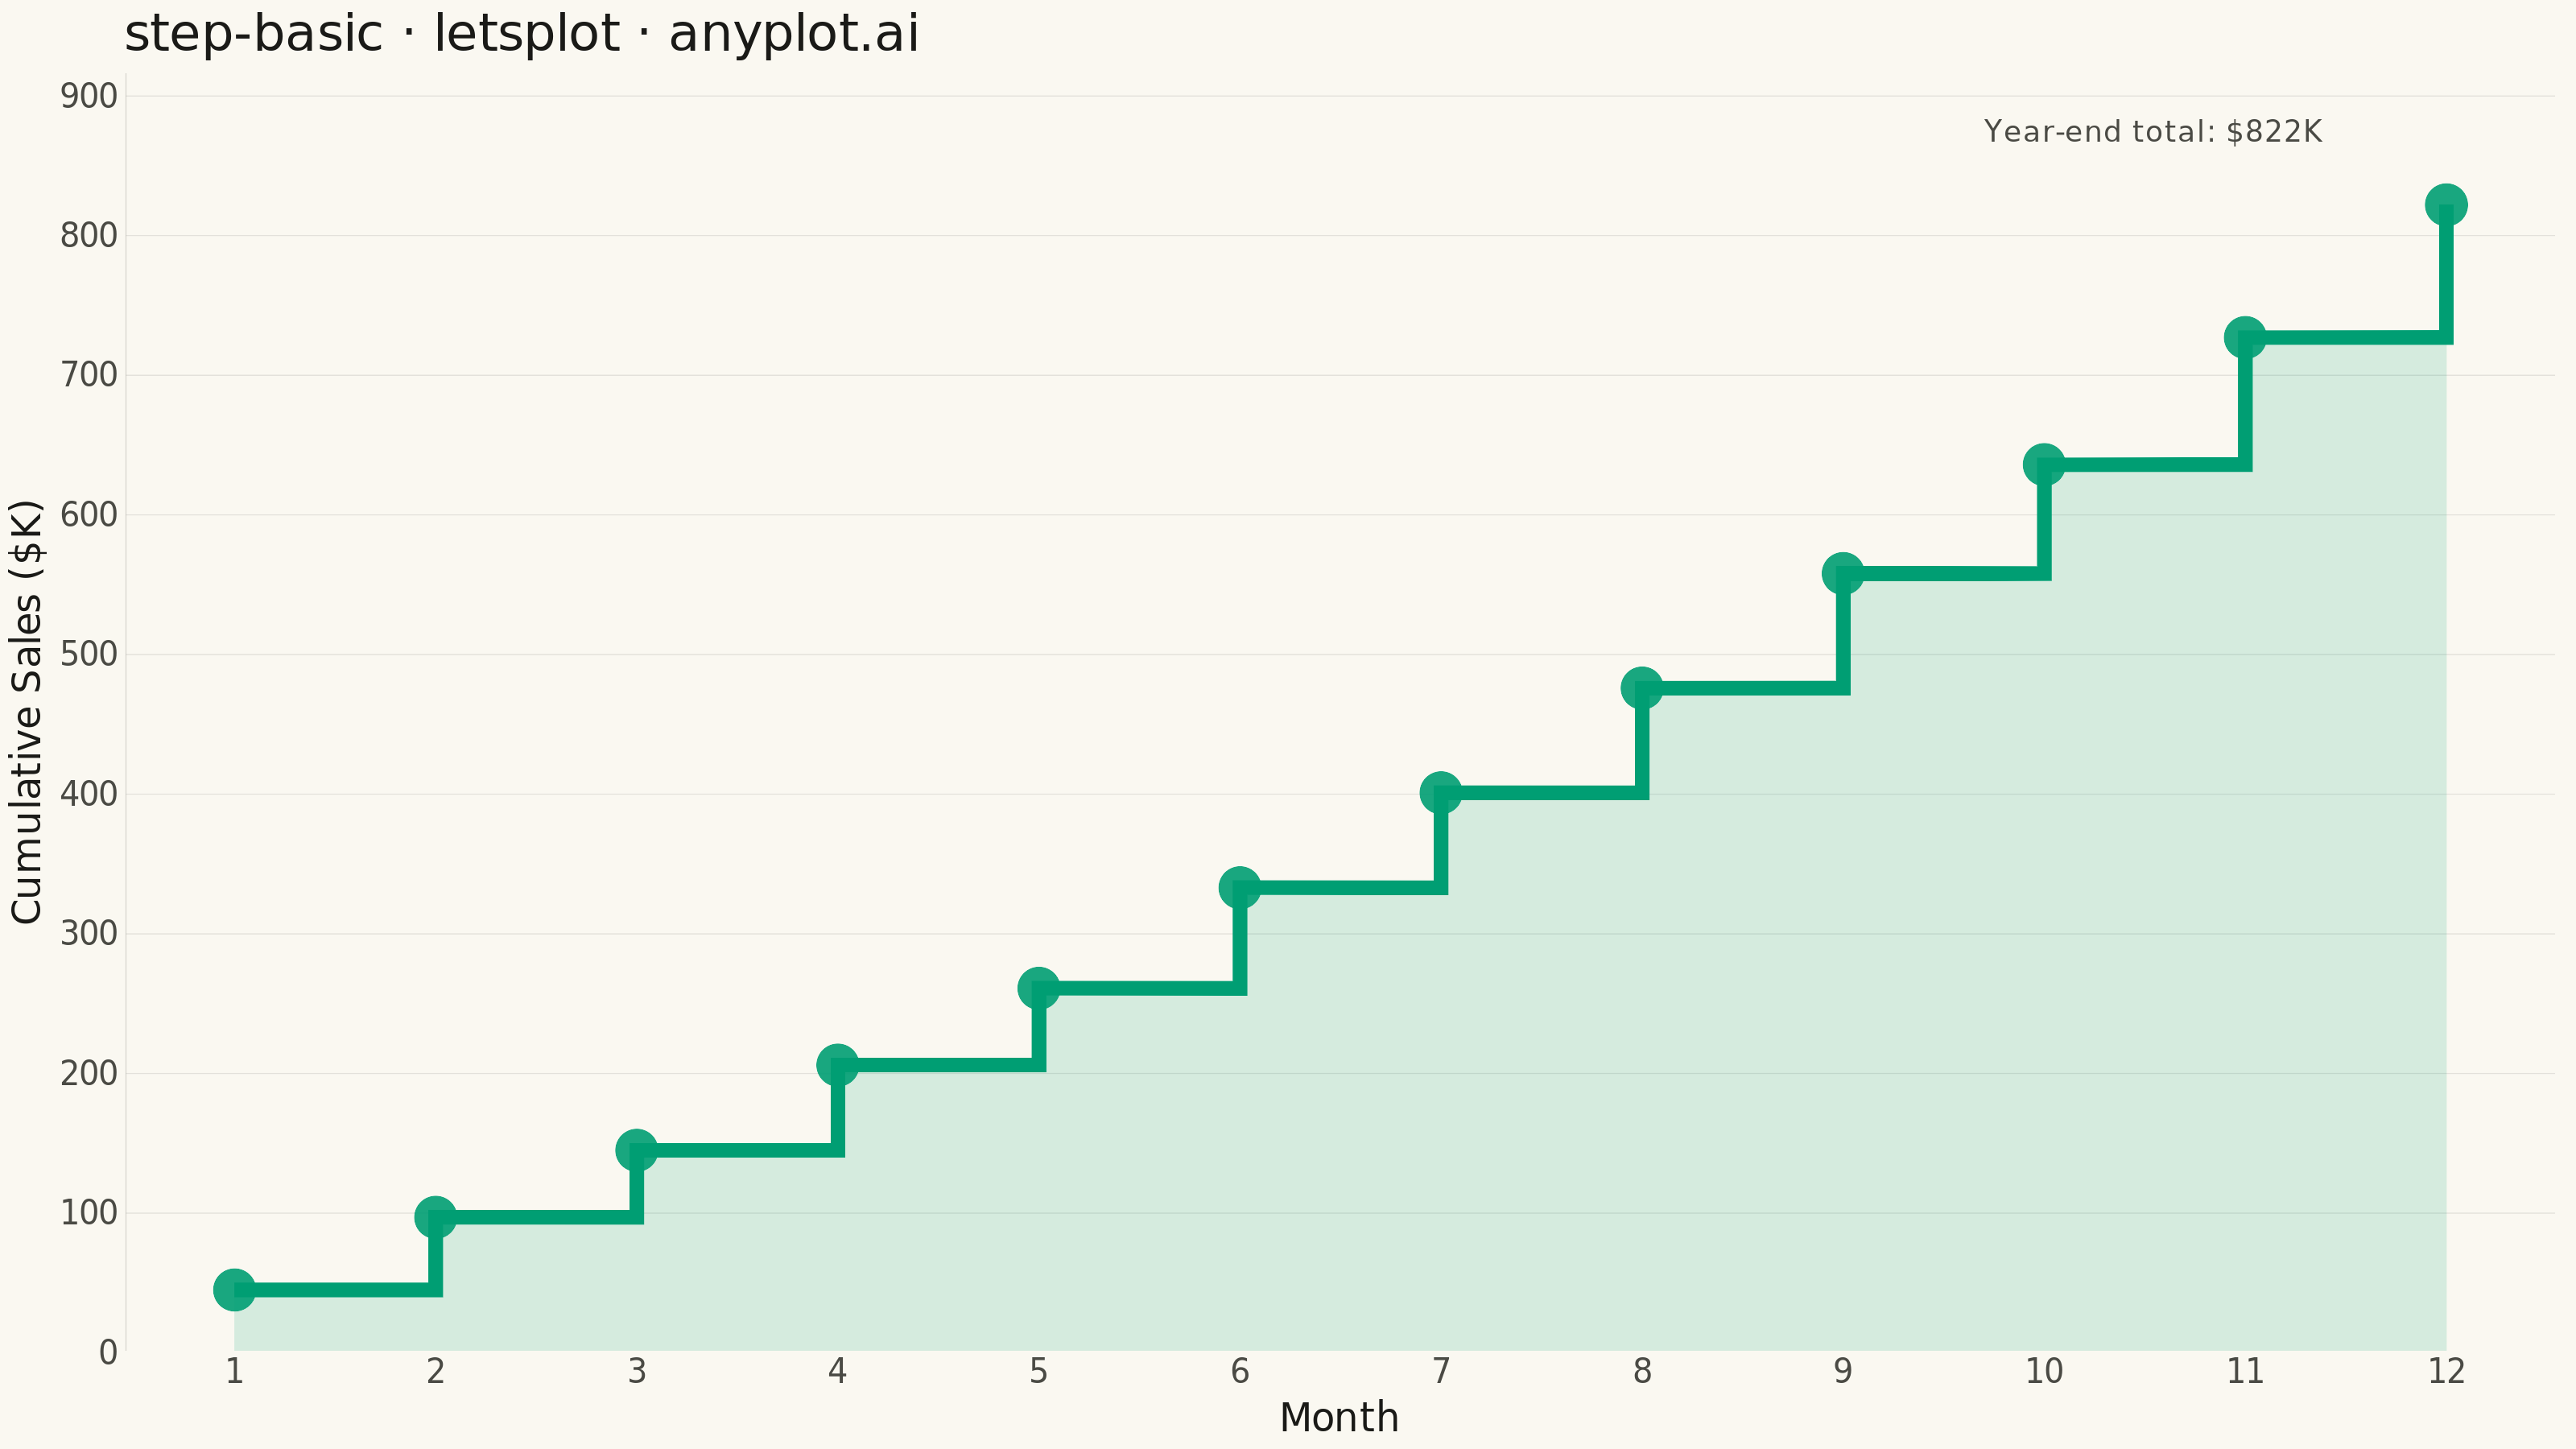
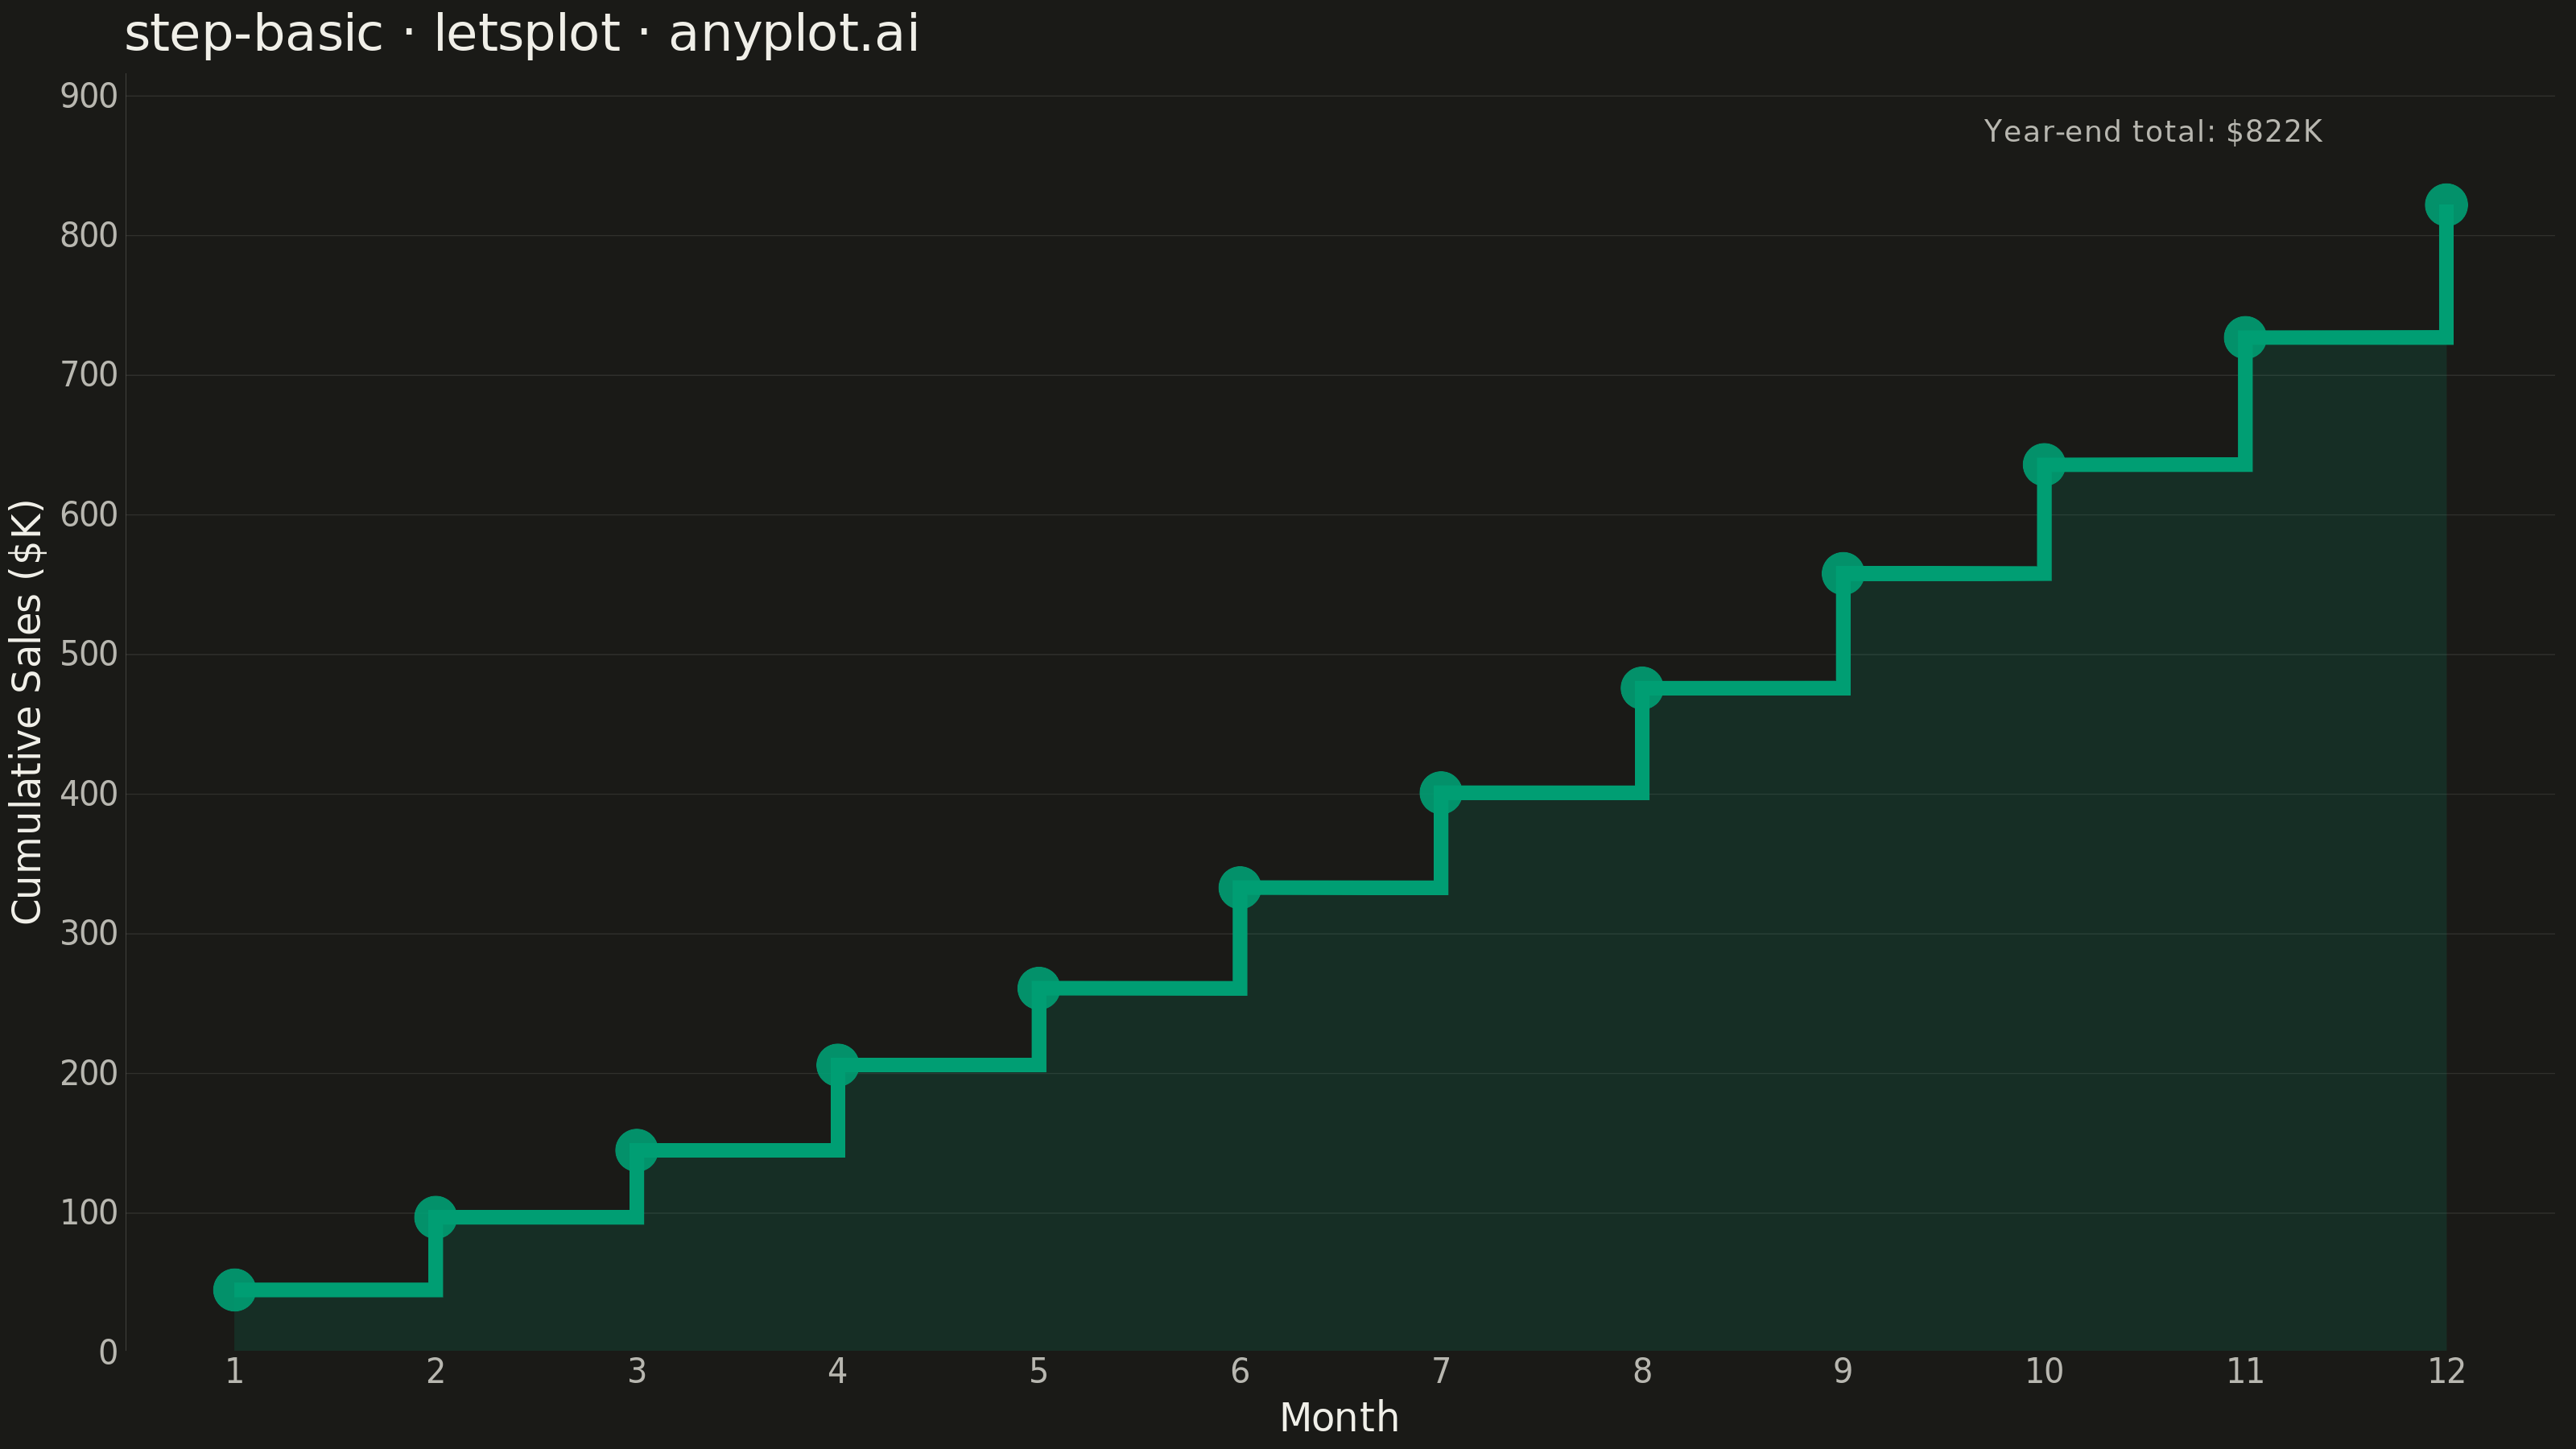
A step plot (also known as a stair plot or stepped line chart) displays data using horizontal lines connected by vertical lines, creating a stair-step pattern. Unlike line charts that interpolate between points, step plots show values as constant until the next change occurs. This makes them ideal for visualizing data that changes at discrete intervals, emphasizing the exact moments when values change.
""" anyplot.ai
step-basic: Basic Step Plot
Library: letsplot 4.11.0 | Python 3.13.14
Quality: 92/100 | Updated: 2026-07-25
"""

import os

import numpy as np
import pandas as pd
from lets_plot import (
    LetsPlot,
    aes,
    element_blank,
    element_line,
    element_rect,
    element_text,
    geom_area,
    geom_point,
    geom_step,
    geom_text,
    ggplot,
    ggsave,
    ggsize,
    labs,
    layer_tooltips,
    scale_x_continuous,
    theme,
    theme_minimal,
)


LetsPlot.setup_html()

# Theme tokens
THEME = os.getenv("ANYPLOT_THEME", "light")
PAGE_BG = "#FAF8F1" if THEME == "light" else "#1A1A17"
INK = "#1A1A17" if THEME == "light" else "#F0EFE8"
INK_SOFT = "#4A4A44" if THEME == "light" else "#B8B7B0"
RULE = "rgba(26,26,23,0.10)" if THEME == "light" else "rgba(240,239,232,0.10)"
BRAND = "#009E73"  # Okabe-Ito position 1 — always first series

# Data - Monthly cumulative sales figures (in thousands)
np.random.seed(42)
months = np.arange(1, 13)
monthly_sales = np.array([45, 52, 48, 61, 55, 72, 68, 75, 82, 78, 91, 95])
cumulative_sales = np.cumsum(monthly_sales)

df = pd.DataFrame({"month": months, "cumulative_sales": cumulative_sales})

# Step-interpolated points (matching geom_step's direction="hv") so the area
# fill hugs the stair shape instead of cutting a straight diagonal across it
step_months = [months[0]]
step_sales = [cumulative_sales[0]]
for m, s in zip(months[1:], cumulative_sales[1:], strict=True):
    step_months += [m, m]
    step_sales += [step_sales[-1], s]
area_df = pd.DataFrame({"month": step_months, "cumulative_sales": step_sales})

# Annotation: label the year-end total near the final data point
total = int(cumulative_sales[-1])
label_df = pd.DataFrame({"month": [11.4], "cumulative_sales": [total + 52], "label": [f"Year-end total: ${total}K"]})

# Tooltip shown in the interactive HTML export — a lets-plot-distinctive feature
point_tooltips = layer_tooltips().line("Month|@month").line("Cumulative sales|$@cumulative_sales K").anchor("top_right")

# Plot
plot = (
    ggplot(df, aes(x="month", y="cumulative_sales"))
    + geom_area(data=area_df, fill=BRAND, color="transparent", alpha=0.15)
    + geom_step(color=BRAND, size=2, direction="hv")
    + geom_point(color=BRAND, size=6, alpha=0.9, tooltips=point_tooltips)
    + geom_text(
        data=label_df, mapping=aes(x="month", y="cumulative_sales", label="label"), color=INK_SOFT, size=4.5, hjust=1
    )
    + labs(x="Month", y="Cumulative Sales ($K)", title="step-basic · letsplot · anyplot.ai")
    + scale_x_continuous(breaks=list(range(1, 13)))
    + ggsize(800, 450)
    + theme_minimal()
    + theme(
        plot_background=element_rect(fill=PAGE_BG, color=PAGE_BG),
        panel_background=element_rect(fill=PAGE_BG, color=PAGE_BG),
        panel_grid_major_x=element_blank(),
        panel_grid_major_y=element_line(color=RULE, size=0.3),
        panel_grid_minor=element_blank(),
        panel_border=element_blank(),
        axis_title=element_text(color=INK, size=12),
        axis_text=element_text(color=INK_SOFT, size=10),
        axis_line_x=element_line(color=INK_SOFT),
        axis_line_y=element_line(color=INK_SOFT),
        plot_title=element_text(color=INK, size=16),
    )
)

# Save PNG (scale 4x to get 3200 x 1800 px)
ggsave(plot, f"plot-{THEME}.png", path=".", scale=4)

# Save HTML for interactive version
ggsave(plot, f"plot-{THEME}.html", path=".")
Runnable source as JSON, for any HTTP client: https://api.anyplot.ai/specs/step-basic/letsplot/code. Any spec id and library id listed in llms-full.txt fit the same URL shape; every URL below is complete and callable.
{
  "spec_id": "step-basic",
  "language": "python",
  "library": "letsplot",
  "page": "https://anyplot.ai/step-basic/python/letsplot",
  "hub": "https://anyplot.ai/step-basic",
  "code_json": "https://api.anyplot.ai/specs/step-basic/letsplot/code",
  "spec_json": "https://api.anyplot.ai/specs/step-basic",
  "render_light_png": "https://storage.googleapis.com/anyplot-images/plots/step-basic/python/letsplot/plot-light.png",
  "render_dark_png": "https://storage.googleapis.com/anyplot-images/plots/step-basic/python/letsplot/plot-dark.png",
  "interactive_light_html": "https://storage.googleapis.com/anyplot-images/plots/step-basic/python/letsplot/plot-light.html",
  "interactive_dark_html": "https://storage.googleapis.com/anyplot-images/plots/step-basic/python/letsplot/plot-dark.html",
  "quality_score": 92.0,
  "license": "MIT",
  "guide": "https://anyplot.ai/llms.txt"
}
Part of Basic Step Plot on anyplot.ai.