The same plot in 14 other libraries — JavaScript: Chart.js, D3.js, Apache ECharts, MUI X Charts; Python: Altair, Bokeh, lets-plot, Matplotlib, Plotly, plotnine, Pygal, Seaborn; R: ggplot2; Julia: Makie.jl. Compare all 15 side by side: Basic Step Plot in Python, R, Julia and JavaScript.
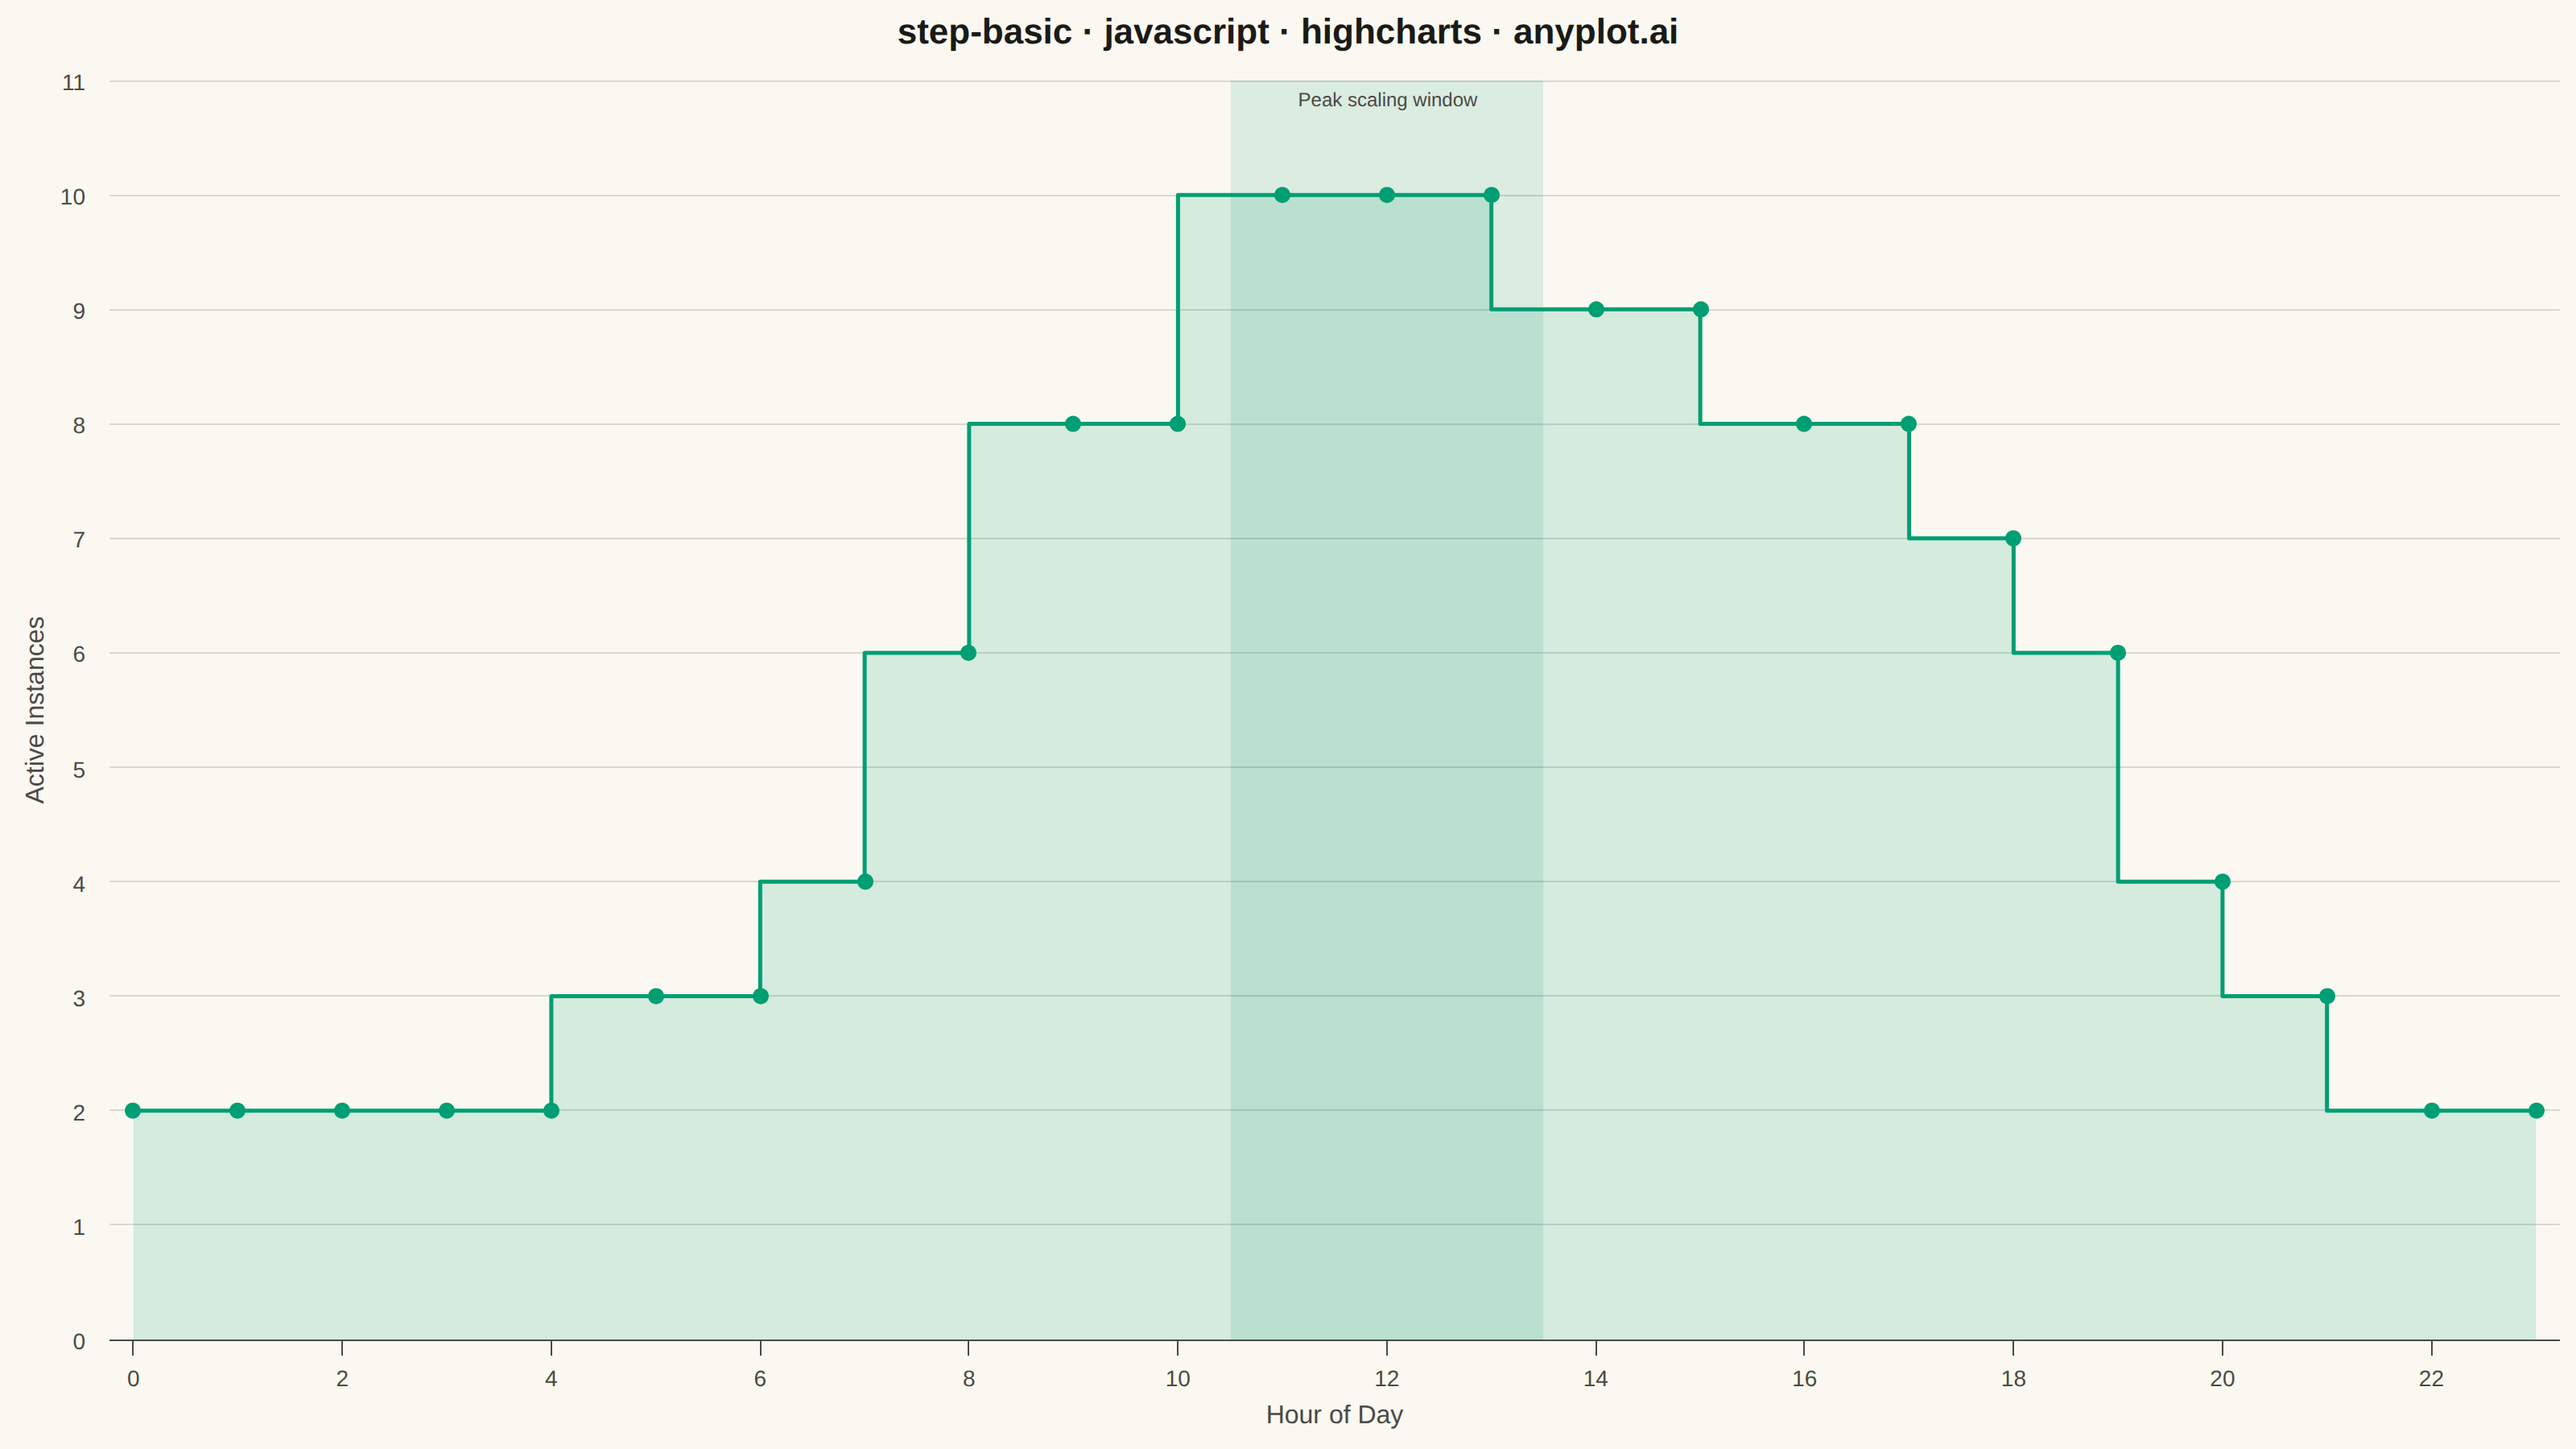
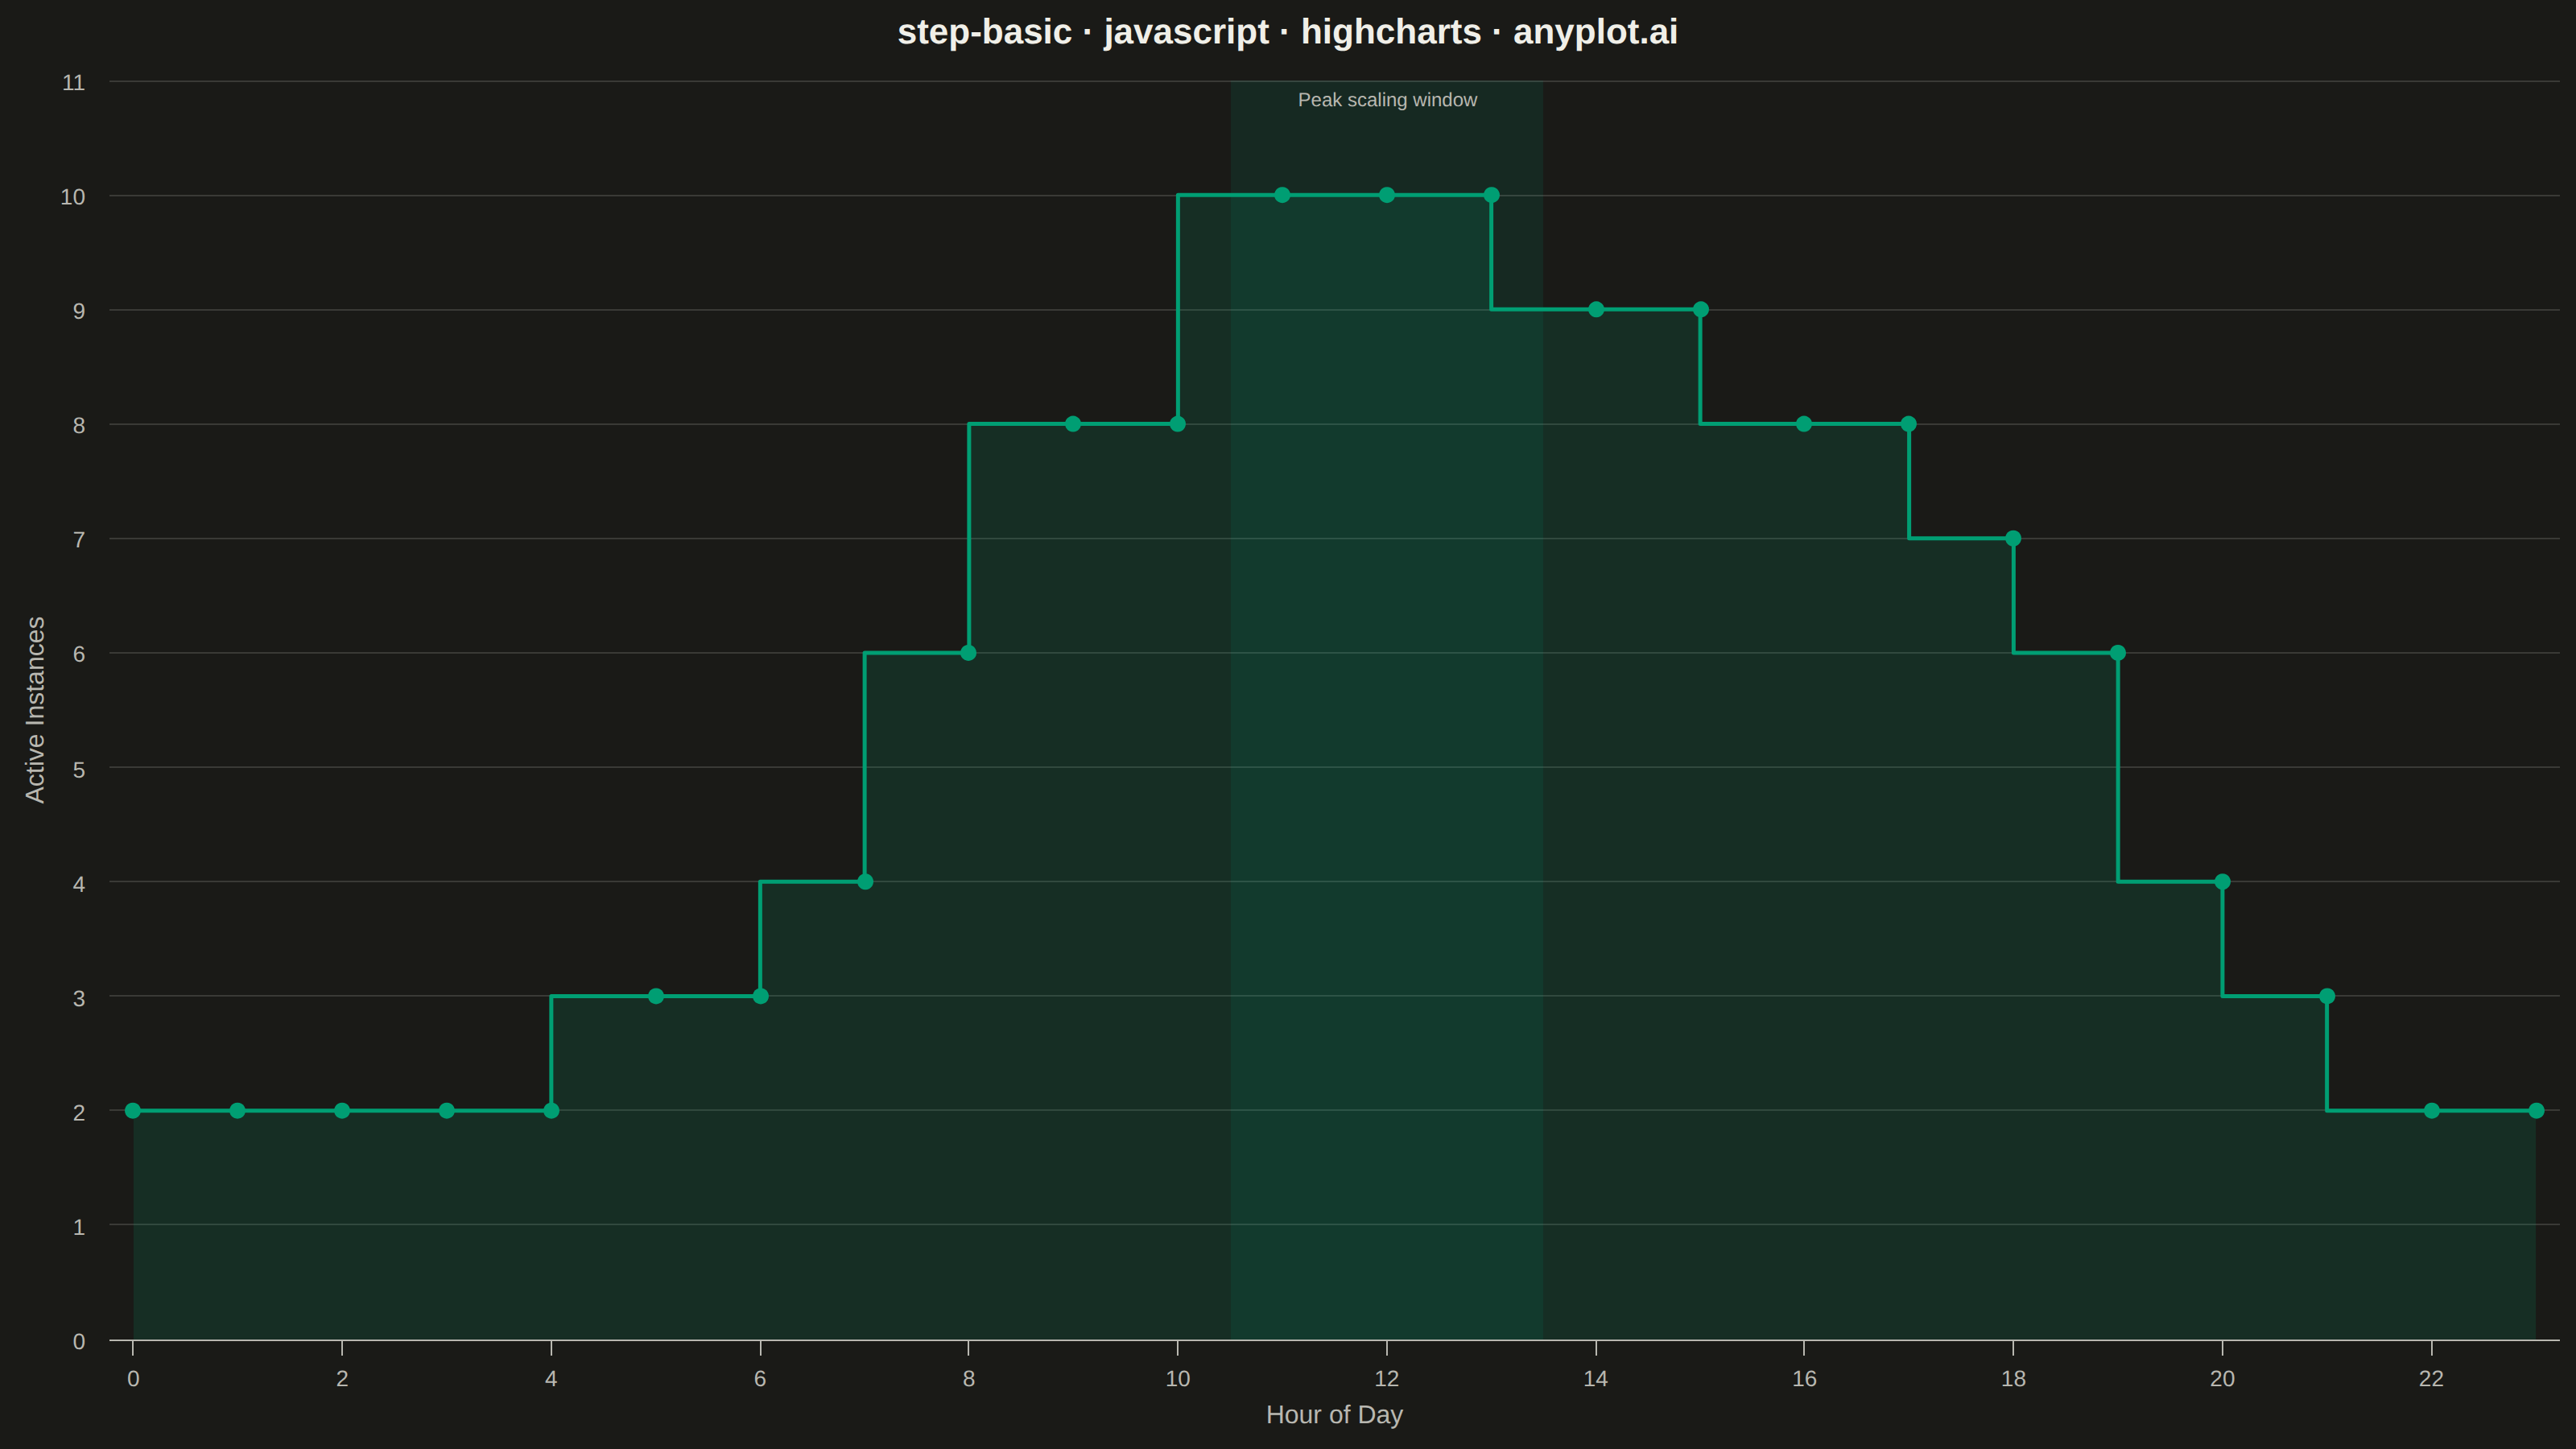
A step plot (also known as a stair plot or stepped line chart) displays data using horizontal lines connected by vertical lines, creating a stair-step pattern. Unlike line charts that interpolate between points, step plots show values as constant until the next change occurs. This makes them ideal for visualizing data that changes at discrete intervals, emphasizing the exact moments when values change.
// anyplot.ai
// step-basic: Basic Step Plot
// Library: highcharts 12.6.0 | JavaScript 22.23.1
// Quality: 89/100 | Created: 2026-07-25

const t = window.ANYPLOT_TOKENS;

// --- Data (in-memory, deterministic) ----------------------------------------
// Hourly active-instance count for an auto-scaling web service: capacity only
// changes at discrete scaling events, holding steady in between — a natural
// fit for a step plot's "post" style (value holds from this hour until the
// next scaling decision).
const hours = [
  0, 1, 2, 3, 4, 5, 6, 7, 8, 9, 10, 11, 12, 13, 14, 15, 16, 17, 18, 19, 20, 21,
  22, 23,
];
const instances = [
  2, 2, 2, 2, 2, 3, 3, 4, 6, 8, 8, 10, 10, 10, 9, 9, 8, 8, 7, 6, 4, 3, 2, 2,
];
const data = hours.map((h, i) => [h, instances[i]]);

// Peak scaling window (hours 11-13, where capacity plateaus at 10 instances) —
// called out with a plotBand so the step's flat top reads as a deliberate
// signal rather than just "the highest bar".
const peakBandColor = Highcharts.color(t.palette[0]).setOpacity(0.12).get();

// --- Chart -------------------------------------------------------------------
Highcharts.chart("container", {
  chart: {
    type: "area",
    backgroundColor: "transparent",
    animation: false,
    style: { fontFamily: "inherit" },
  },
  credits: { enabled: false },
  colors: t.palette,
  title: {
    text: "step-basic · javascript · highcharts · anyplot.ai",
    style: { color: t.ink, fontSize: "22px", fontWeight: "600" },
  },
  xAxis: {
    title: { text: "Hour of Day", style: { color: t.inkSoft, fontSize: "16px" } },
    lineColor: t.inkSoft,
    tickColor: t.inkSoft,
    tickInterval: 2,
    gridLineColor: t.grid,
    labels: { style: { color: t.inkSoft, fontSize: "14px" } },
    plotBands: [
      {
        from: 10.5,
        to: 13.5,
        color: peakBandColor,
        label: {
          text: "Peak scaling window",
          style: { color: t.inkSoft, fontSize: "12px" },
          y: 16,
        },
      },
    ],
  },
  yAxis: {
    title: {
      text: "Active Instances",
      style: { color: t.inkSoft, fontSize: "16px" },
    },
    gridLineColor: t.grid,
    labels: { style: { color: t.inkSoft, fontSize: "14px" } },
    min: 0,
  },
  legend: { enabled: false },
  plotOptions: {
    series: { animation: false },
    area: {
      step: "right",
      lineWidth: 2.5,
      fillOpacity: 0.15,
      marker: { enabled: true, radius: 5 },
    },
  },
  series: [
    {
      name: "Active instances",
      data,
    },
  ],
});
Runnable source as JSON, for any HTTP client: https://api.anyplot.ai/specs/step-basic/highcharts/code. Any spec id and library id listed in llms-full.txt fit the same URL shape; every URL below is complete and callable.
{
  "spec_id": "step-basic",
  "language": "javascript",
  "library": "highcharts",
  "page": "https://anyplot.ai/step-basic/javascript/highcharts",
  "hub": "https://anyplot.ai/step-basic",
  "code_json": "https://api.anyplot.ai/specs/step-basic/highcharts/code",
  "spec_json": "https://api.anyplot.ai/specs/step-basic",
  "render_light_png": "https://storage.googleapis.com/anyplot-images/plots/step-basic/javascript/highcharts/plot-light.png",
  "render_dark_png": "https://storage.googleapis.com/anyplot-images/plots/step-basic/javascript/highcharts/plot-dark.png",
  "interactive_light_html": "https://storage.googleapis.com/anyplot-images/plots/step-basic/javascript/highcharts/plot-light.html",
  "interactive_dark_html": "https://storage.googleapis.com/anyplot-images/plots/step-basic/javascript/highcharts/plot-dark.html",
  "quality_score": 89.0,
  "license": "MIT",
  "guide": "https://anyplot.ai/llms.txt"
}
Part of Basic Step Plot on anyplot.ai.