The same plot in 14 other libraries — JavaScript: Chart.js, Apache ECharts, Highcharts, MUI X Charts; Python: Altair, Bokeh, lets-plot, Matplotlib, Plotly, plotnine, Pygal, Seaborn; R: ggplot2; Julia: Makie.jl. Compare all 15 side by side: Basic Step Plot in Python, R, Julia and JavaScript.
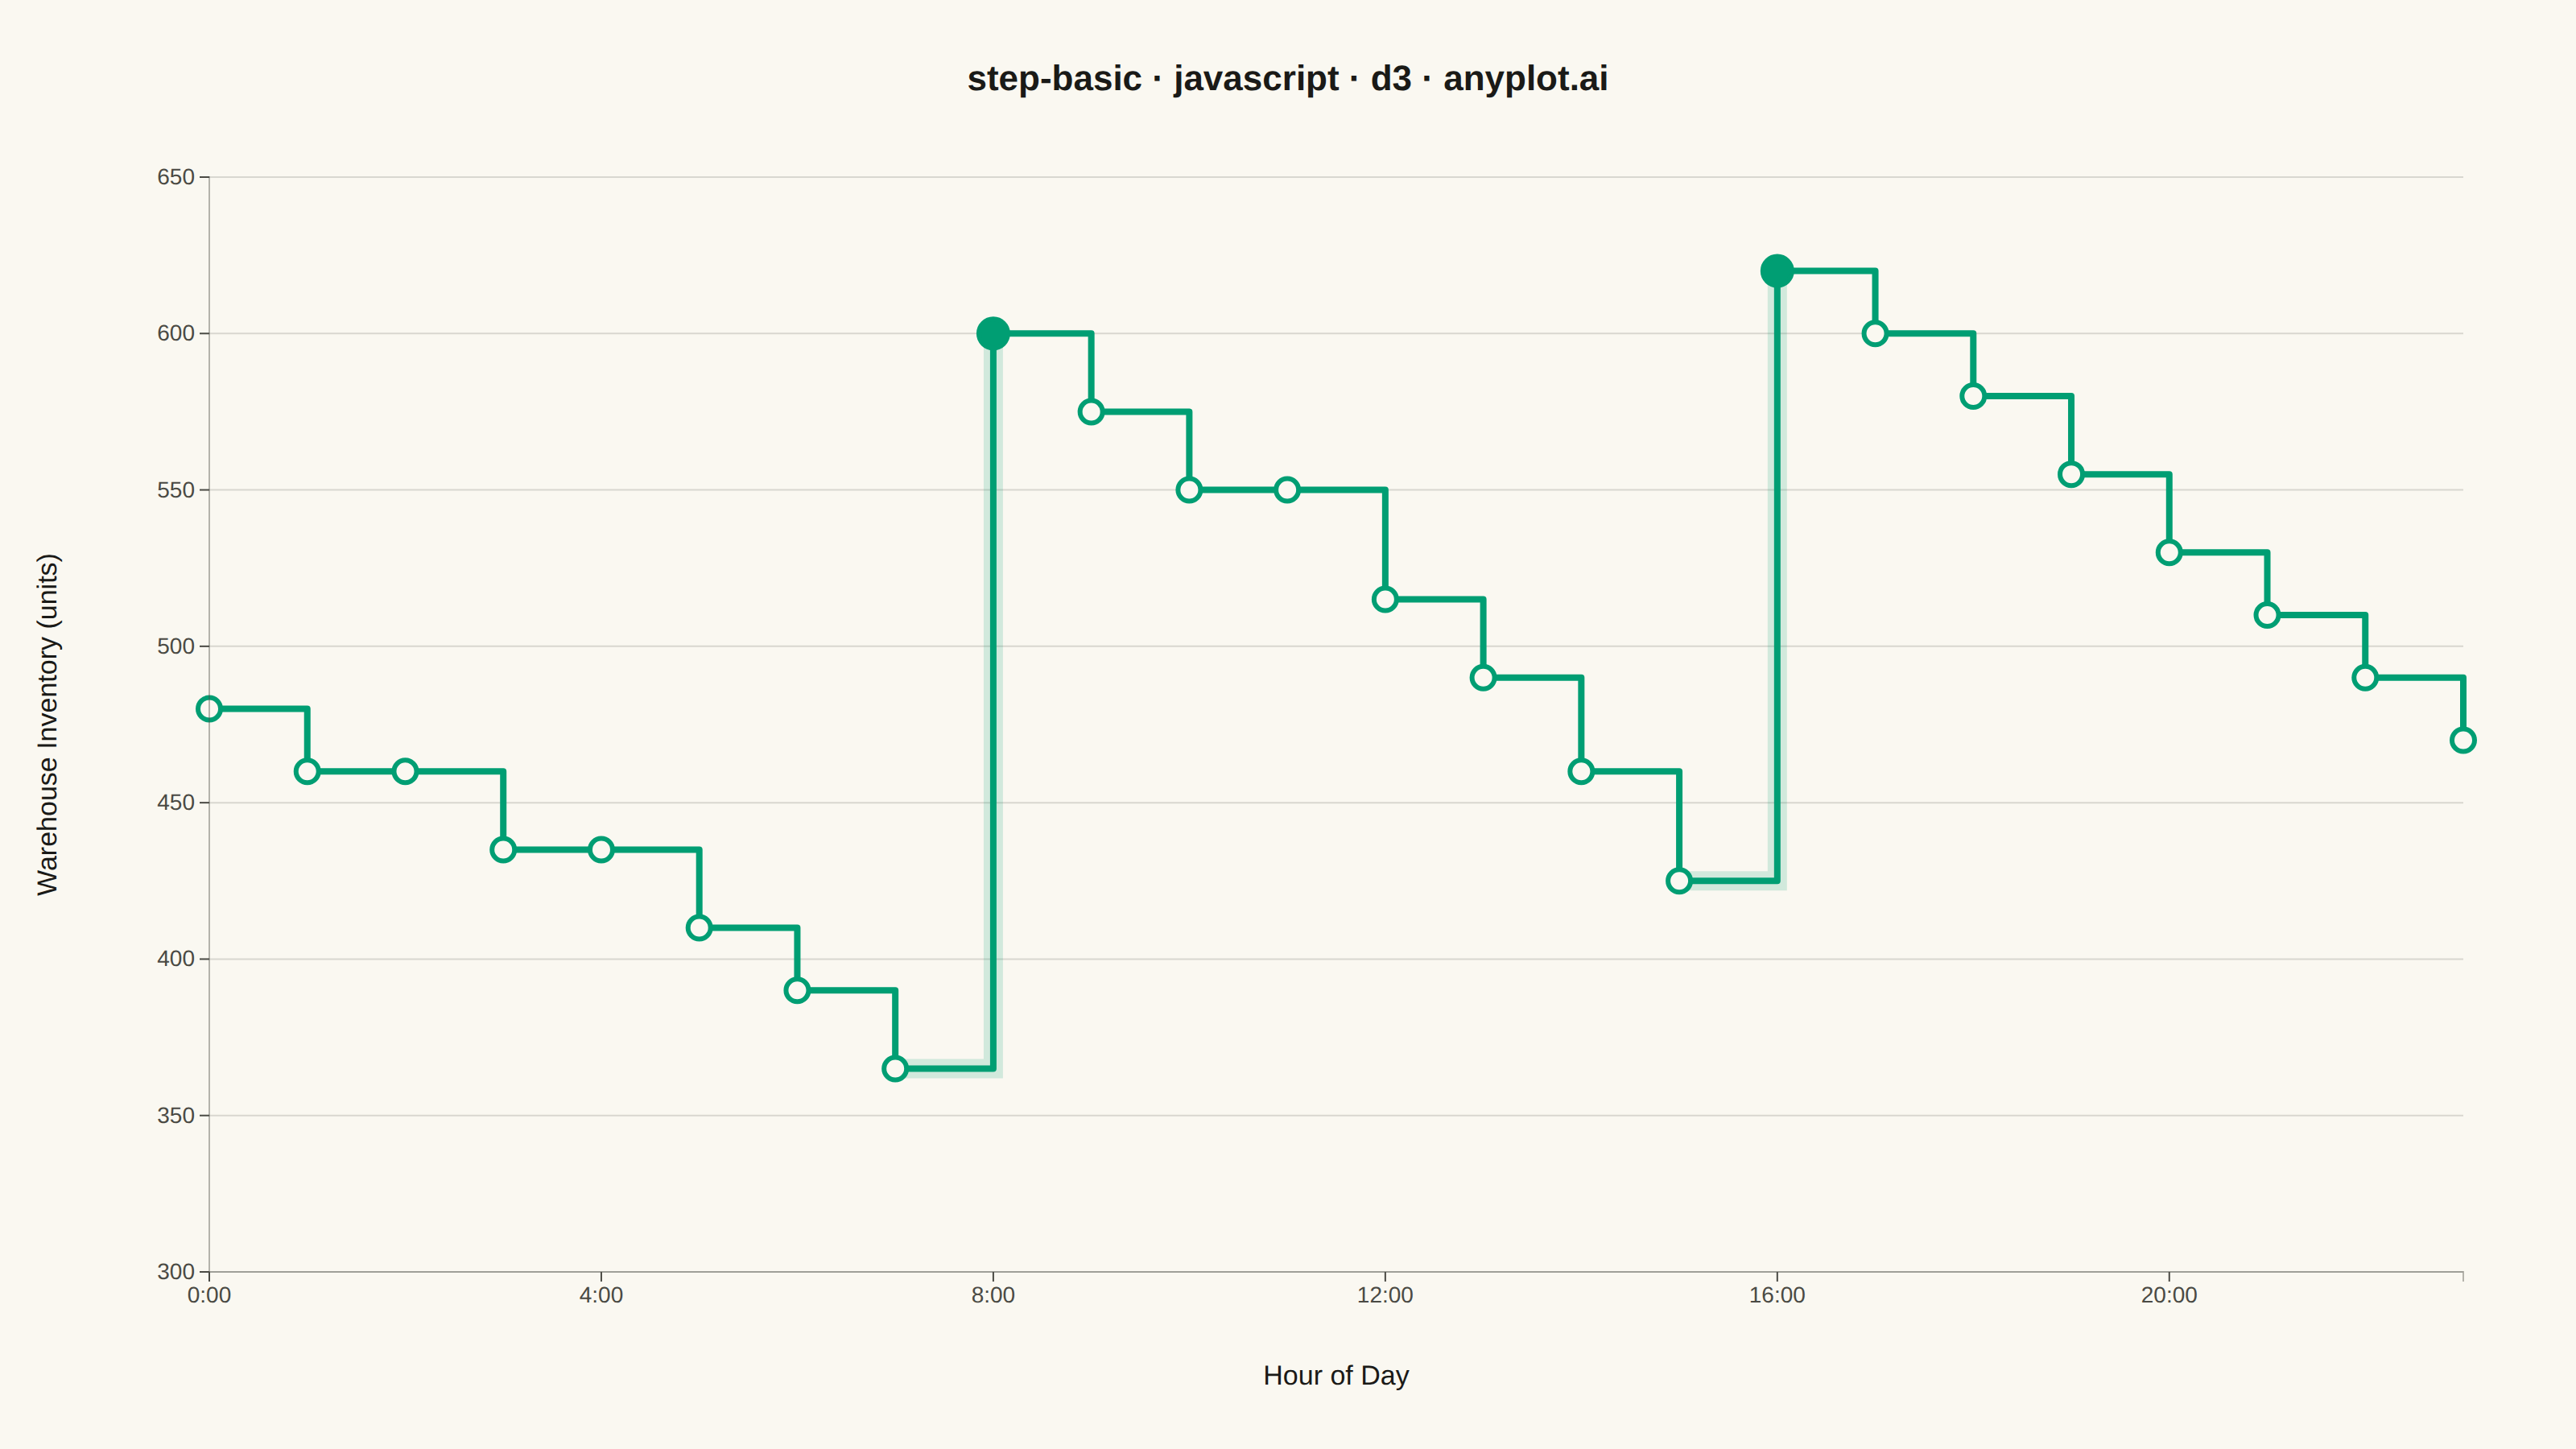
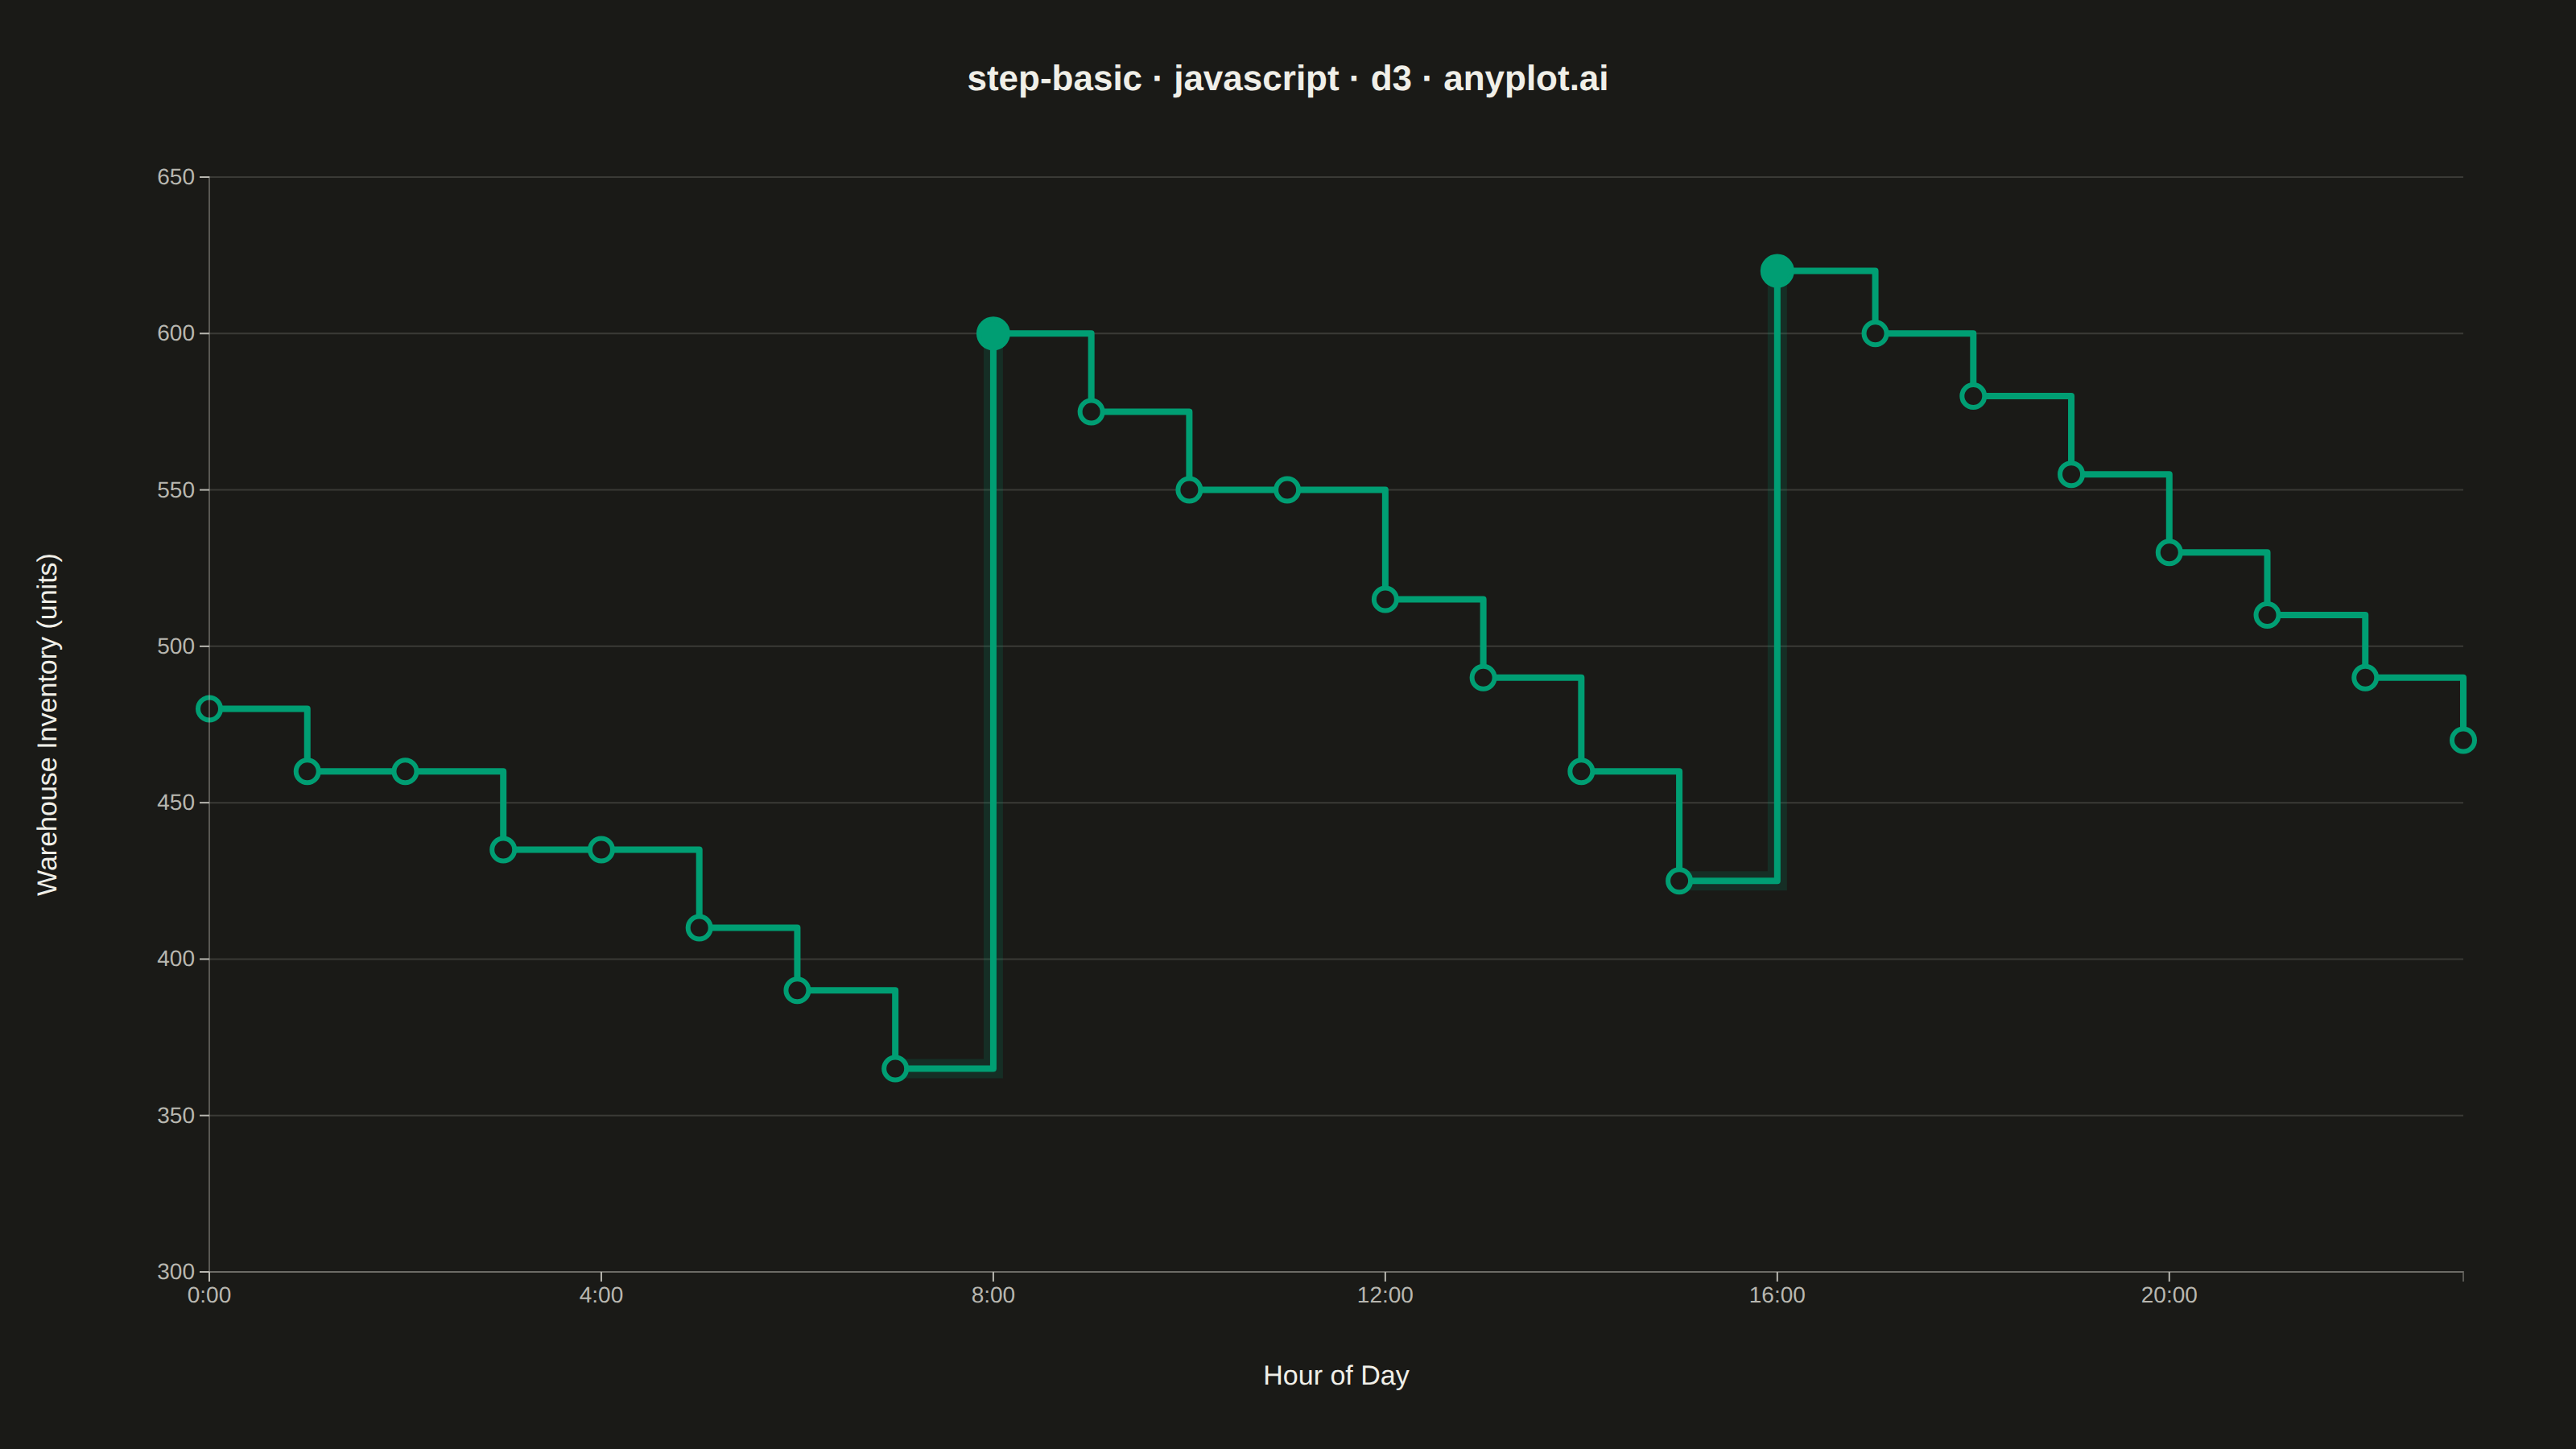
A step plot (also known as a stair plot or stepped line chart) displays data using horizontal lines connected by vertical lines, creating a stair-step pattern. Unlike line charts that interpolate between points, step plots show values as constant until the next change occurs. This makes them ideal for visualizing data that changes at discrete intervals, emphasizing the exact moments when values change.
// anyplot.ai
// step-basic: Basic Step Plot
// Library: d3 7.9.0 | JavaScript 22.23.1
// Quality: 90/100 | Created: 2026-07-25

const t = window.ANYPLOT_TOKENS;
const { width, height } = window.ANYPLOT_SIZE;
const margin = { top: 110, right: 70, bottom: 110, left: 130 };
const iw = width - margin.left - margin.right;
const ih = height - margin.top - margin.bottom;

// --- Data: hourly warehouse inventory (units), restocked at hour 8 and 16 ---
const inventory = [
  { hour: 0, units: 480 },
  { hour: 1, units: 460 },
  { hour: 2, units: 460 },
  { hour: 3, units: 435 },
  { hour: 4, units: 435 },
  { hour: 5, units: 410 },
  { hour: 6, units: 390 },
  { hour: 7, units: 365 },
  { hour: 8, units: 600 },
  { hour: 9, units: 575 },
  { hour: 10, units: 550 },
  { hour: 11, units: 550 },
  { hour: 12, units: 515 },
  { hour: 13, units: 490 },
  { hour: 14, units: 460 },
  { hour: 15, units: 425 },
  { hour: 16, units: 620 },
  { hour: 17, units: 600 },
  { hour: 18, units: 580 },
  { hour: 19, units: 555 },
  { hour: 20, units: 530 },
  { hour: 21, units: 510 },
  { hour: 22, units: 490 },
  { hour: 23, units: 470 },
];

// --- SVG mount ---------------------------------------------------------------
const svg = d3.select("#container").append("svg").attr("width", width).attr("height", height);
const g = svg.append("g").attr("transform", `translate(${margin.left},${margin.top})`);

// --- Scales -------------------------------------------------------------------
const x = d3.scaleLinear().domain(d3.extent(inventory, (d) => d.hour)).range([0, iw]);
const y = d3
  .scaleLinear()
  .domain([300, d3.max(inventory, (d) => d.units)])
  .nice()
  .range([ih, 0]);

// --- Gridlines (y-axis only, per style guide) ---------------------------------
g.append("g")
  .attr("class", "grid")
  .call(d3.axisLeft(y).tickSize(-iw).tickFormat(""))
  .call((sel) => sel.select(".domain").remove())
  .selectAll("line")
  .attr("stroke", t.grid);

// --- Step line (post style: value holds until the next reading) --------------
const stepLine = d3
  .line()
  .x((d) => x(d.hour))
  .y((d) => y(d.units))
  .curve(d3.curveStepAfter);

// Restock jumps are the story: soft halo behind the two vertical step
// transitions at hour 8 and hour 16, drawn before the main line so it reads
// as a glow rather than an outline.
const restockSegments = [
  [inventory[7], inventory[8]],
  [inventory[15], inventory[16]],
];
g.selectAll(".restock-glow")
  .data(restockSegments)
  .join("path")
  .attr("class", "restock-glow")
  .attr("fill", "none")
  .attr("stroke", t.palette[0])
  .attr("stroke-width", 12)
  .attr("stroke-linecap", "round")
  .attr("stroke-opacity", 0.16)
  .attr("d", stepLine);

g.append("path")
  .datum(inventory)
  .attr("fill", "none")
  .attr("stroke", t.palette[0])
  .attr("stroke-width", 4)
  .attr("stroke-linejoin", "round")
  .attr("d", stepLine);

// --- Markers at each recorded reading (restock readings emphasized) ----------
const restockHours = new Set([8, 16]);
const markerFill = d3.scaleOrdinal().domain([true, false]).range([t.palette[0], t.pageBg]);
const markerRadius = d3.scaleOrdinal().domain([true, false]).range([9, 7]);

g.selectAll("circle")
  .data(inventory)
  .join("circle")
  .attr("cx", (d) => x(d.hour))
  .attr("cy", (d) => y(d.units))
  .attr("r", (d) => markerRadius(restockHours.has(d.hour)))
  .attr("fill", (d) => markerFill(restockHours.has(d.hour)))
  .attr("stroke", t.palette[0])
  .attr("stroke-width", 3);

// --- Axes -----------------------------------------------------------------------
const xAxis = g
  .append("g")
  .attr("transform", `translate(0,${ih})`)
  .call(
    d3
      .axisBottom(x)
      .tickValues(d3.range(0, 24, 4))
      .tickFormat((d) => `${d}:00`),
  );
const yAxis = g.append("g").call(d3.axisLeft(y));
for (const ax of [xAxis, yAxis]) {
  ax.selectAll("text").attr("fill", t.inkSoft).style("font-size", "14px");
  ax.selectAll("line").attr("stroke", t.inkSoft);
  // Lightened, spine-free baseline: keep the L-shaped frame but de-emphasize it
  // relative to the data.
  ax.select(".domain").attr("stroke", t.inkSoft).attr("stroke-opacity", 0.4).attr("stroke-width", 1);
}

// --- Axis labels --------------------------------------------------------------
g.append("text")
  .attr("x", iw / 2)
  .attr("y", ih + 70)
  .attr("text-anchor", "middle")
  .attr("fill", t.ink)
  .style("font-size", "17px")
  .text("Hour of Day");

g.append("text")
  .attr("transform", "rotate(-90)")
  .attr("x", -ih / 2)
  .attr("y", -95)
  .attr("text-anchor", "middle")
  .attr("fill", t.ink)
  .style("font-size", "17px")
  .text("Warehouse Inventory (units)");

// --- Title ----------------------------------------------------------------------
svg
  .append("text")
  .attr("x", width / 2)
  .attr("y", 56)
  .attr("text-anchor", "middle")
  .attr("fill", t.ink)
  .style("font-size", "22px")
  .style("font-weight", "600")
  .text("step-basic · javascript · d3 · anyplot.ai");
Runnable source as JSON, for any HTTP client: https://api.anyplot.ai/specs/step-basic/d3/code. Any spec id and library id listed in llms-full.txt fit the same URL shape; every URL below is complete and callable.
{
  "spec_id": "step-basic",
  "language": "javascript",
  "library": "d3",
  "page": "https://anyplot.ai/step-basic/javascript/d3",
  "hub": "https://anyplot.ai/step-basic",
  "code_json": "https://api.anyplot.ai/specs/step-basic/d3/code",
  "spec_json": "https://api.anyplot.ai/specs/step-basic",
  "render_light_png": "https://storage.googleapis.com/anyplot-images/plots/step-basic/javascript/d3/plot-light.png",
  "render_dark_png": "https://storage.googleapis.com/anyplot-images/plots/step-basic/javascript/d3/plot-dark.png",
  "interactive_light_html": "https://storage.googleapis.com/anyplot-images/plots/step-basic/javascript/d3/plot-light.html",
  "interactive_dark_html": "https://storage.googleapis.com/anyplot-images/plots/step-basic/javascript/d3/plot-dark.html",
  "quality_score": 90.0,
  "license": "MIT",
  "guide": "https://anyplot.ai/llms.txt"
}
Part of Basic Step Plot on anyplot.ai.