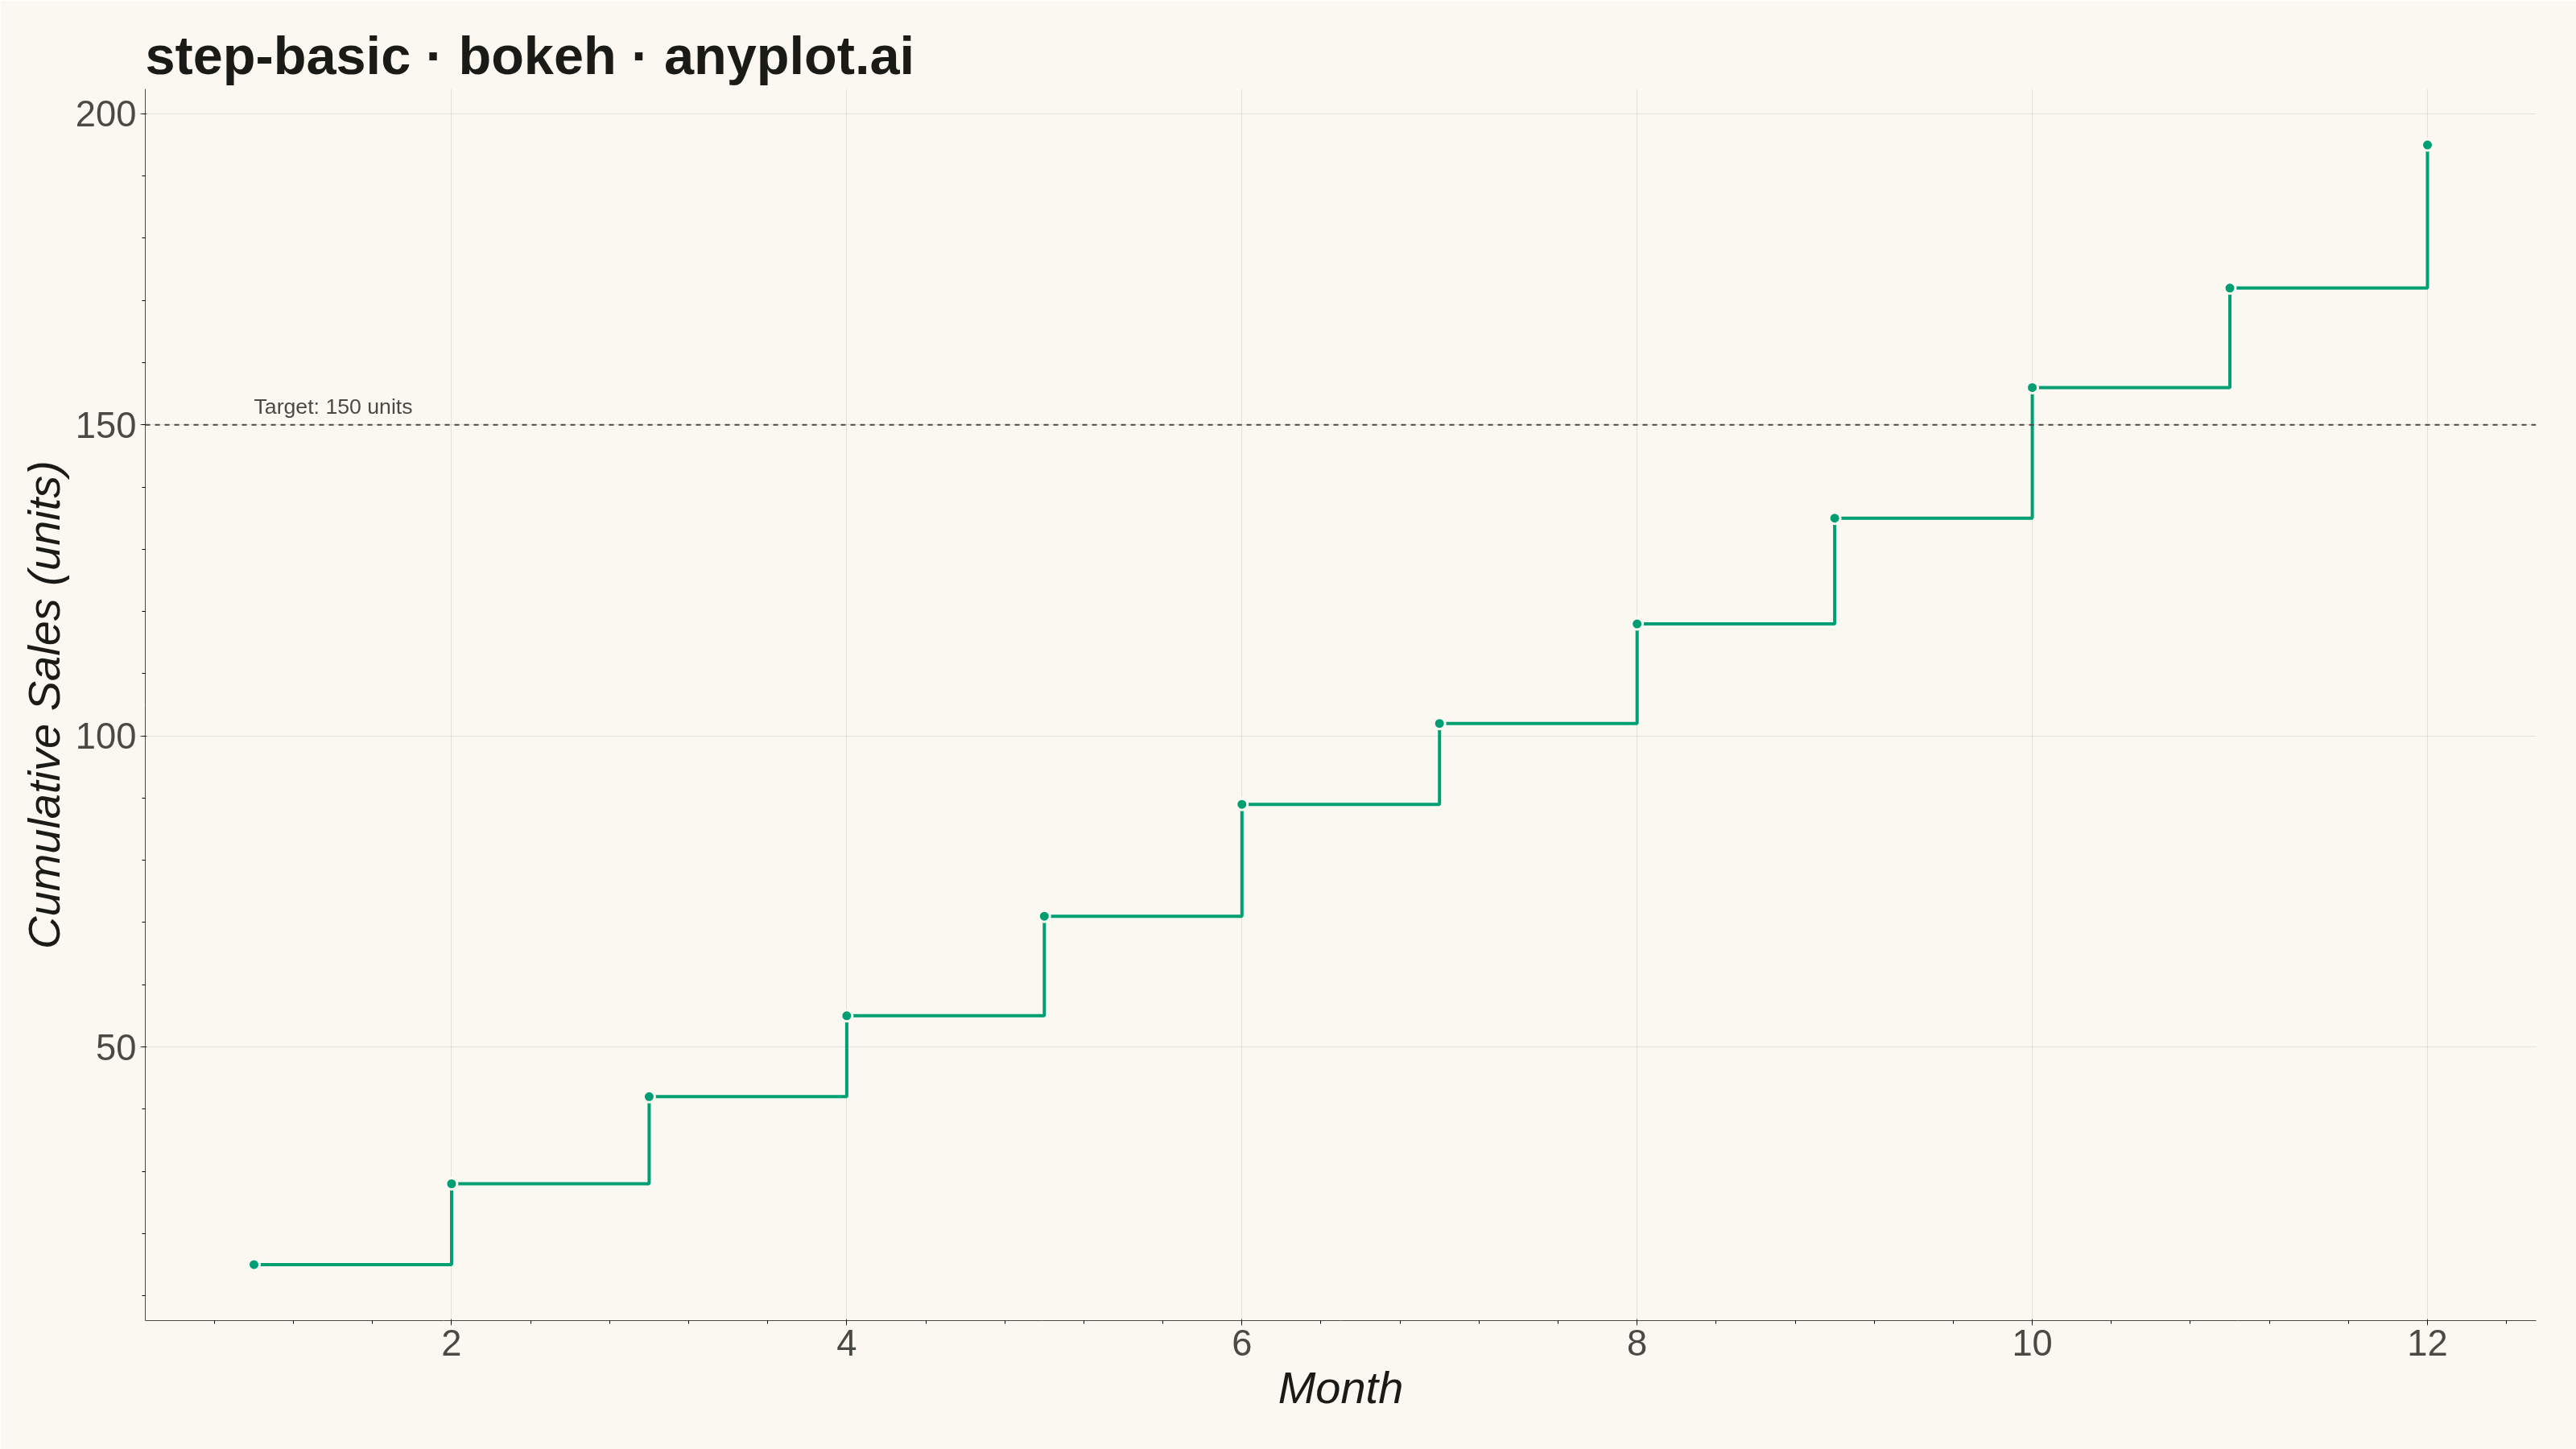
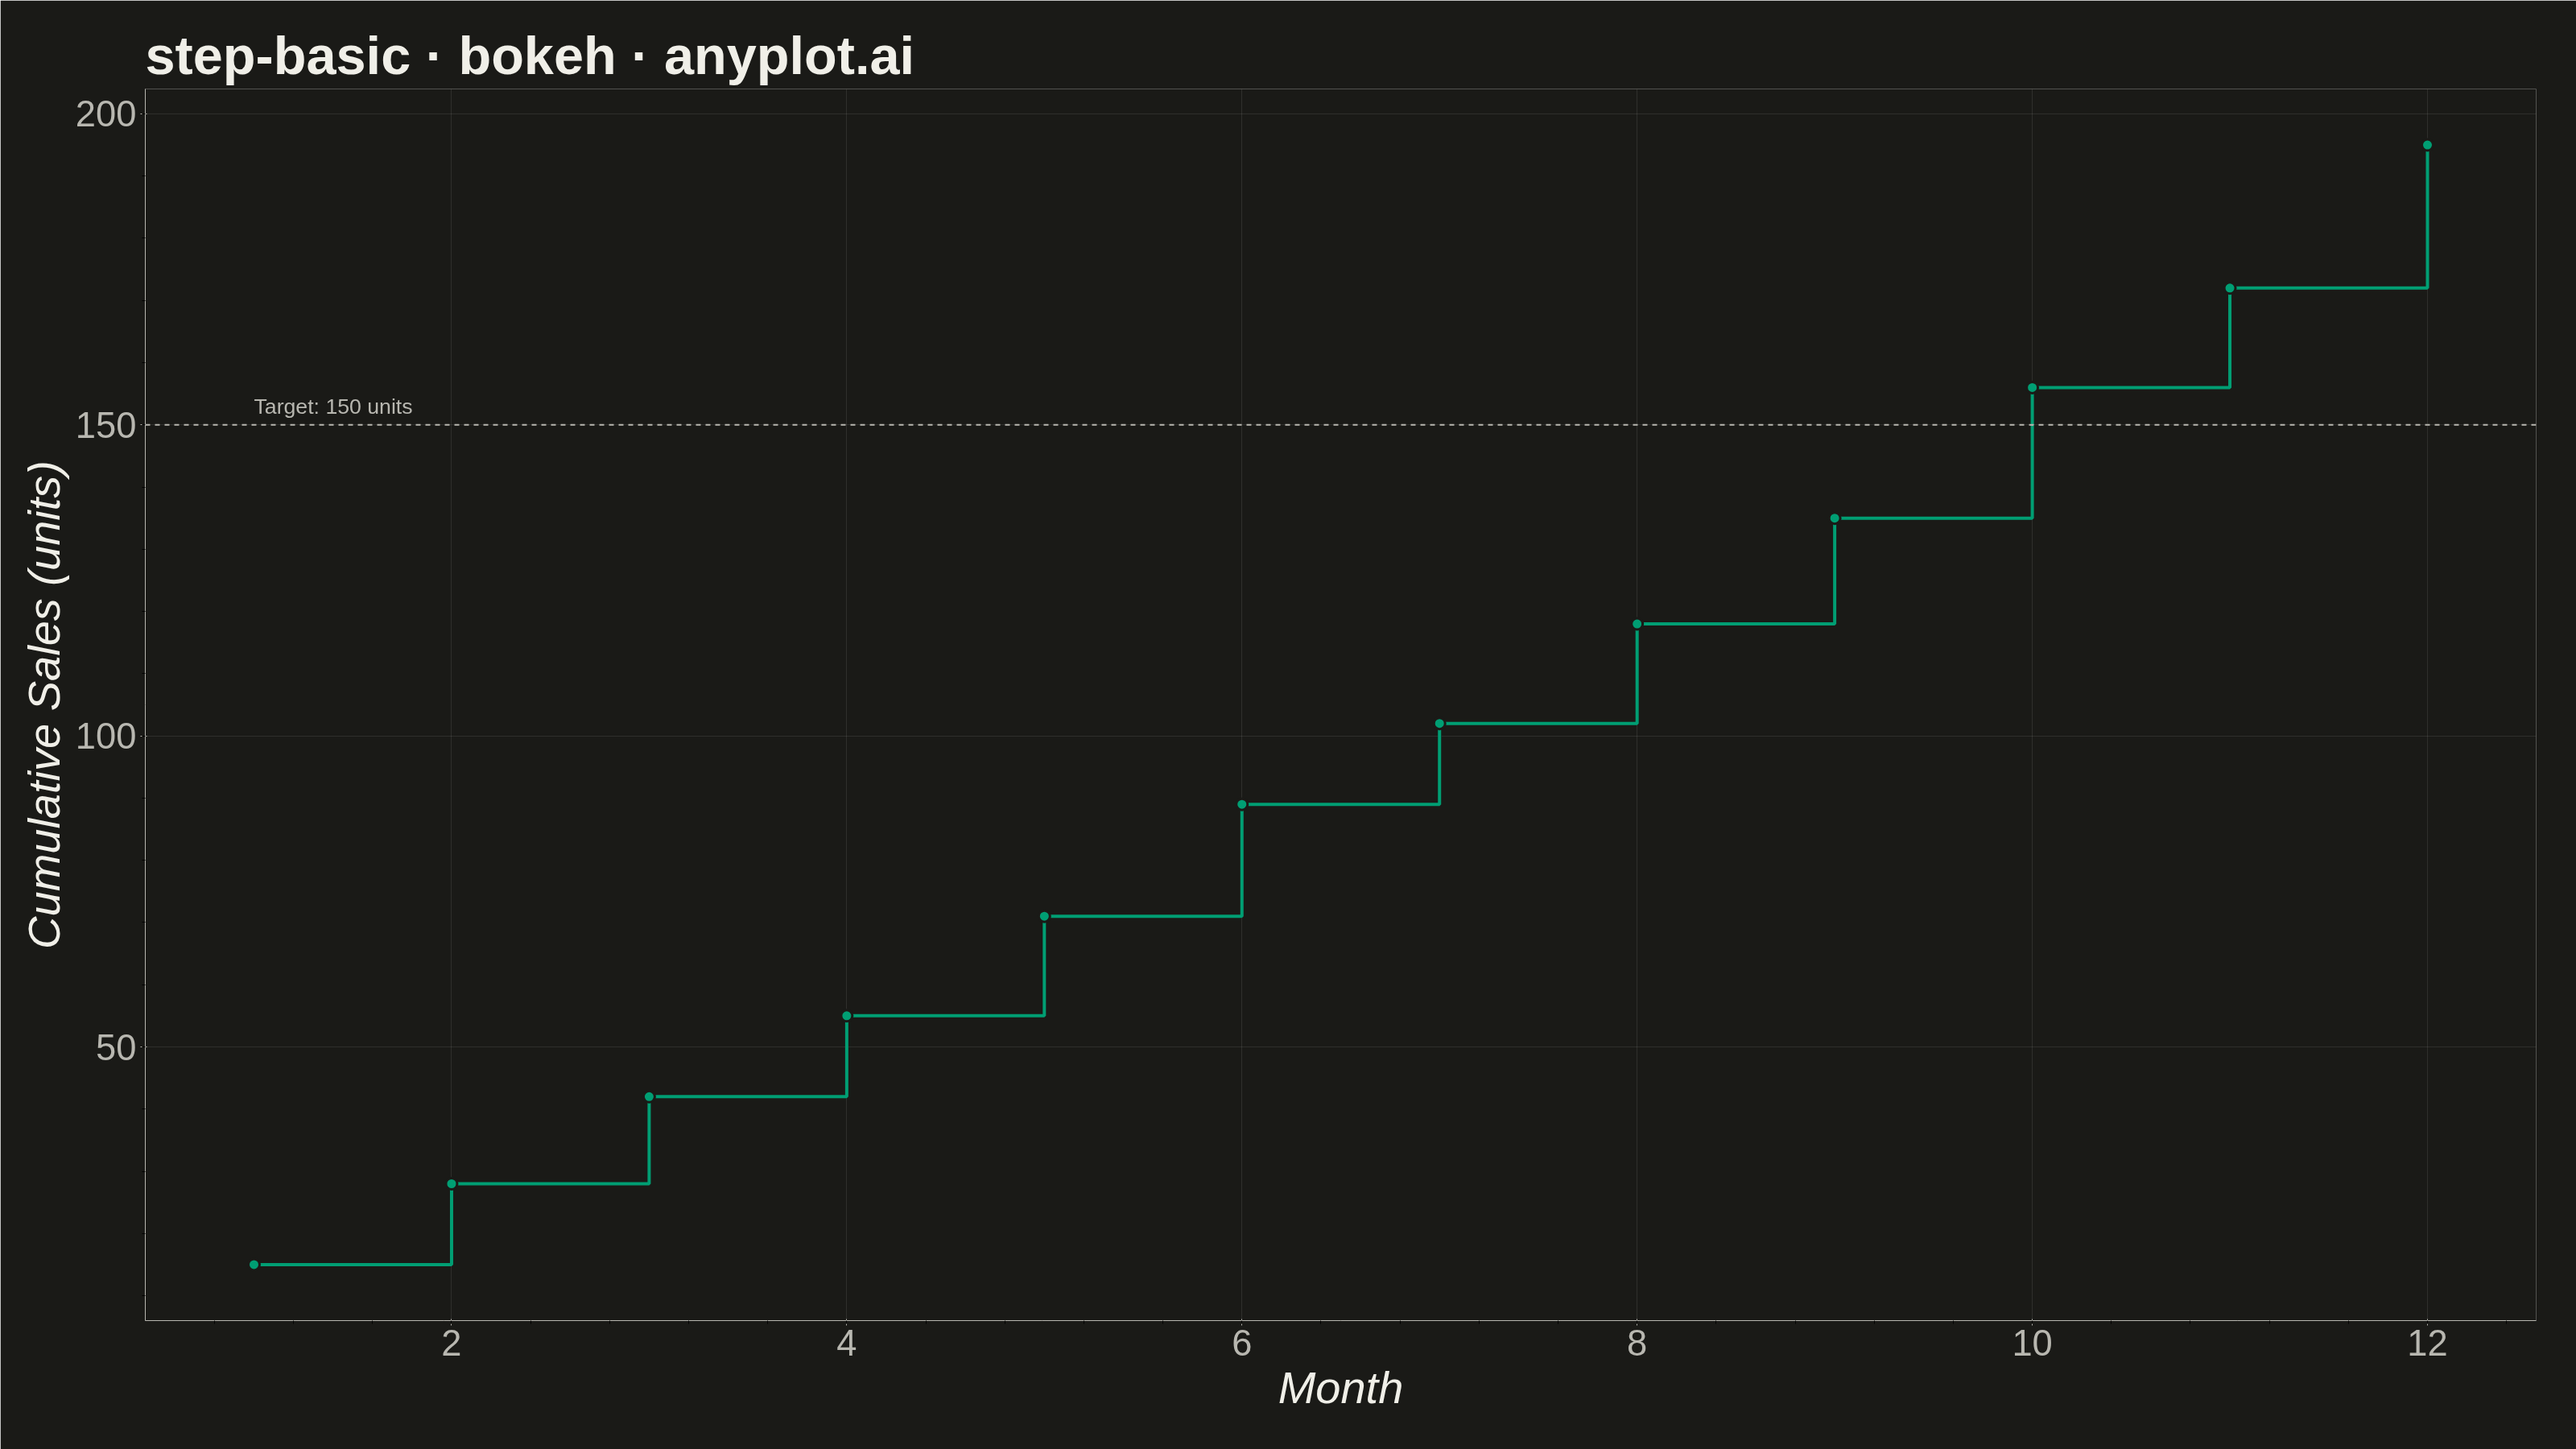
A step plot (also known as a stair plot or stepped line chart) displays data using horizontal lines connected by vertical lines, creating a stair-step pattern. Unlike line charts that interpolate between points, step plots show values as constant until the next change occurs. This makes them ideal for visualizing data that changes at discrete intervals, emphasizing the exact moments when values change.
""" anyplot.ai
step-basic: Basic Step Plot
Library: bokeh 3.9.1 | Python 3.13.14
Quality: 85/100 | Updated: 2026-07-25
"""

import os
import time
from pathlib import Path

from bokeh.io import output_file, save
from bokeh.models import BoxAnnotation, ColumnDataSource, HoverTool, Span
from bokeh.plotting import figure
from selenium import webdriver
from selenium.webdriver.chrome.options import Options


# Theme - Imprint palette theme-adaptive chrome tokens
THEME = os.getenv("ANYPLOT_THEME", "light")
PAGE_BG = "#FAF8F1" if THEME == "light" else "#1A1A17"
INK = "#1A1A17" if THEME == "light" else "#F0EFE8"
INK_SOFT = "#4A4A44" if THEME == "light" else "#B8B7B0"
BRAND = "#009E73"

# Data - monthly cumulative sales showing discrete jumps
months = [1, 2, 3, 4, 5, 6, 7, 8, 9, 10, 11, 12]
month_names = ["Jan", "Feb", "Mar", "Apr", "May", "Jun", "Jul", "Aug", "Sep", "Oct", "Nov", "Dec"]
cumulative_sales = [15, 28, 42, 55, 71, 89, 102, 118, 135, 156, 172, 195]
target = 150  # milestone: full-year sales target crossed mid-Q4

source = ColumnDataSource(data={"month": months, "month_name": month_names, "sales": cumulative_sales})

# Plot
W, H = 3200, 1800
p = figure(
    width=W,
    height=H,
    title="step-basic · python · bokeh · anyplot.ai",
    x_axis_label="Month",
    y_axis_label="Cumulative Sales (units)",
    tools="",
    toolbar_location=None,
    min_border_bottom=160,
    min_border_left=180,
    min_border_top=110,
    min_border_right=50,
)

# Above-target shading - a distinctive bokeh BoxAnnotation that highlights the
# region where cumulative sales have cleared the full-year milestone.
above_target = BoxAnnotation(bottom=target, fill_color=BRAND, fill_alpha=0.06)
p.add_layout(above_target)

# Reference line - annotates the milestone where cumulative sales crossed the
# full-year target, giving the step pattern a storytelling focal point.
target_line = Span(location=target, dimension="width", line_color=INK_SOFT, line_dash="dashed", line_width=2)
p.add_layout(target_line)
p.text(
    x=[1],
    y=[target],
    text=["Target: 150 units"],
    text_font_size="20pt",
    text_color=INK_SOFT,
    text_baseline="bottom",
    text_align="left",
    y_offset=-8,
)

# Step line (after/post mode - value holds until the next change occurs)
p.step(x="month", y="sales", source=source, line_width=4, color=BRAND, mode="after")

# Markers at data points to highlight where changes occur
marker_glyph = p.scatter(x="month", y="sales", source=source, size=14, color=BRAND, line_color=PAGE_BG, line_width=3)

# Hover - Bokeh's signature interactive feature, surfaces exact month/value pairs
hover = HoverTool(
    renderers=[marker_glyph], tooltips=[("Month", "@month_name"), ("Cumulative sales", "@sales units")], mode="mouse"
)
p.add_tools(hover)

# Style - text sizes for 3200x1800 px canvas
p.title.text_font_size = "50pt"
p.title.text_font_style = "bold"
p.title.text_color = INK
p.xaxis.axis_label_text_font_size = "42pt"
p.yaxis.axis_label_text_font_size = "42pt"
p.xaxis.axis_label_text_color = INK
p.yaxis.axis_label_text_color = INK
p.xaxis.major_label_text_font_size = "34pt"
p.yaxis.major_label_text_font_size = "34pt"
p.xaxis.major_label_text_color = INK_SOFT
p.yaxis.major_label_text_color = INK_SOFT

# Chrome - axes and ticks
p.xaxis.axis_line_color = INK_SOFT
p.yaxis.axis_line_color = INK_SOFT
p.xaxis.major_tick_line_color = INK_SOFT
p.yaxis.major_tick_line_color = INK_SOFT

# Grid - subtle solid lines
p.xgrid.grid_line_color = INK
p.xgrid.grid_line_alpha = 0.10
p.ygrid.grid_line_color = INK
p.ygrid.grid_line_alpha = 0.10

# Background - no outline frame, keeps the composition clean
p.background_fill_color = PAGE_BG
p.border_fill_color = PAGE_BG
p.outline_line_color = None

# Save - write the interactive HTML, then screenshot it with headless Chrome
# (bokeh.io.export_png probes a chromedriver snap shim that fails on this box)
output_file(f"plot-{THEME}.html")
save(p)

opts = Options()
for arg in (
    "--headless=new",
    "--no-sandbox",
    "--disable-dev-shm-usage",
    "--disable-gpu",
    f"--window-size={W},{H}",
    "--hide-scrollbars",
):
    opts.add_argument(arg)
driver = webdriver.Chrome(options=opts)
driver.set_window_size(W, H)
driver.get(f"file://{Path(f'plot-{THEME}.html').resolve()}")
# Pin the viewport exactly via CDP - headless Chrome's --window-size sets the
# OUTER window, which still reserves a phantom title-bar height even headless.
driver.execute_cdp_cmd(
    "Emulation.setDeviceMetricsOverride", {"width": W, "height": H, "deviceScaleFactor": 1, "mobile": False}
)
time.sleep(3)  # let bokeh's JS render the canvas
driver.save_screenshot(f"plot-{THEME}.png")
driver.quit()
Runnable source as JSON, for any HTTP client: https://api.anyplot.ai/specs/step-basic/bokeh/code. Any spec id and library id listed in llms-full.txt fit the same URL shape; every URL below is complete and callable.
{
  "spec_id": "step-basic",
  "language": "python",
  "library": "bokeh",
  "page": "https://anyplot.ai/step-basic/python/bokeh",
  "hub": "https://anyplot.ai/step-basic",
  "code_json": "https://api.anyplot.ai/specs/step-basic/bokeh/code",
  "spec_json": "https://api.anyplot.ai/specs/step-basic",
  "render_light_png": "https://storage.googleapis.com/anyplot-images/plots/step-basic/python/bokeh/plot-light.png",
  "render_dark_png": "https://storage.googleapis.com/anyplot-images/plots/step-basic/python/bokeh/plot-dark.png",
  "interactive_light_html": "https://storage.googleapis.com/anyplot-images/plots/step-basic/python/bokeh/plot-light.html",
  "interactive_dark_html": "https://storage.googleapis.com/anyplot-images/plots/step-basic/python/bokeh/plot-dark.html",
  "quality_score": 85.0,
  "license": "MIT",
  "guide": "https://anyplot.ai/llms.txt"
}
Part of Basic Step Plot on anyplot.ai.