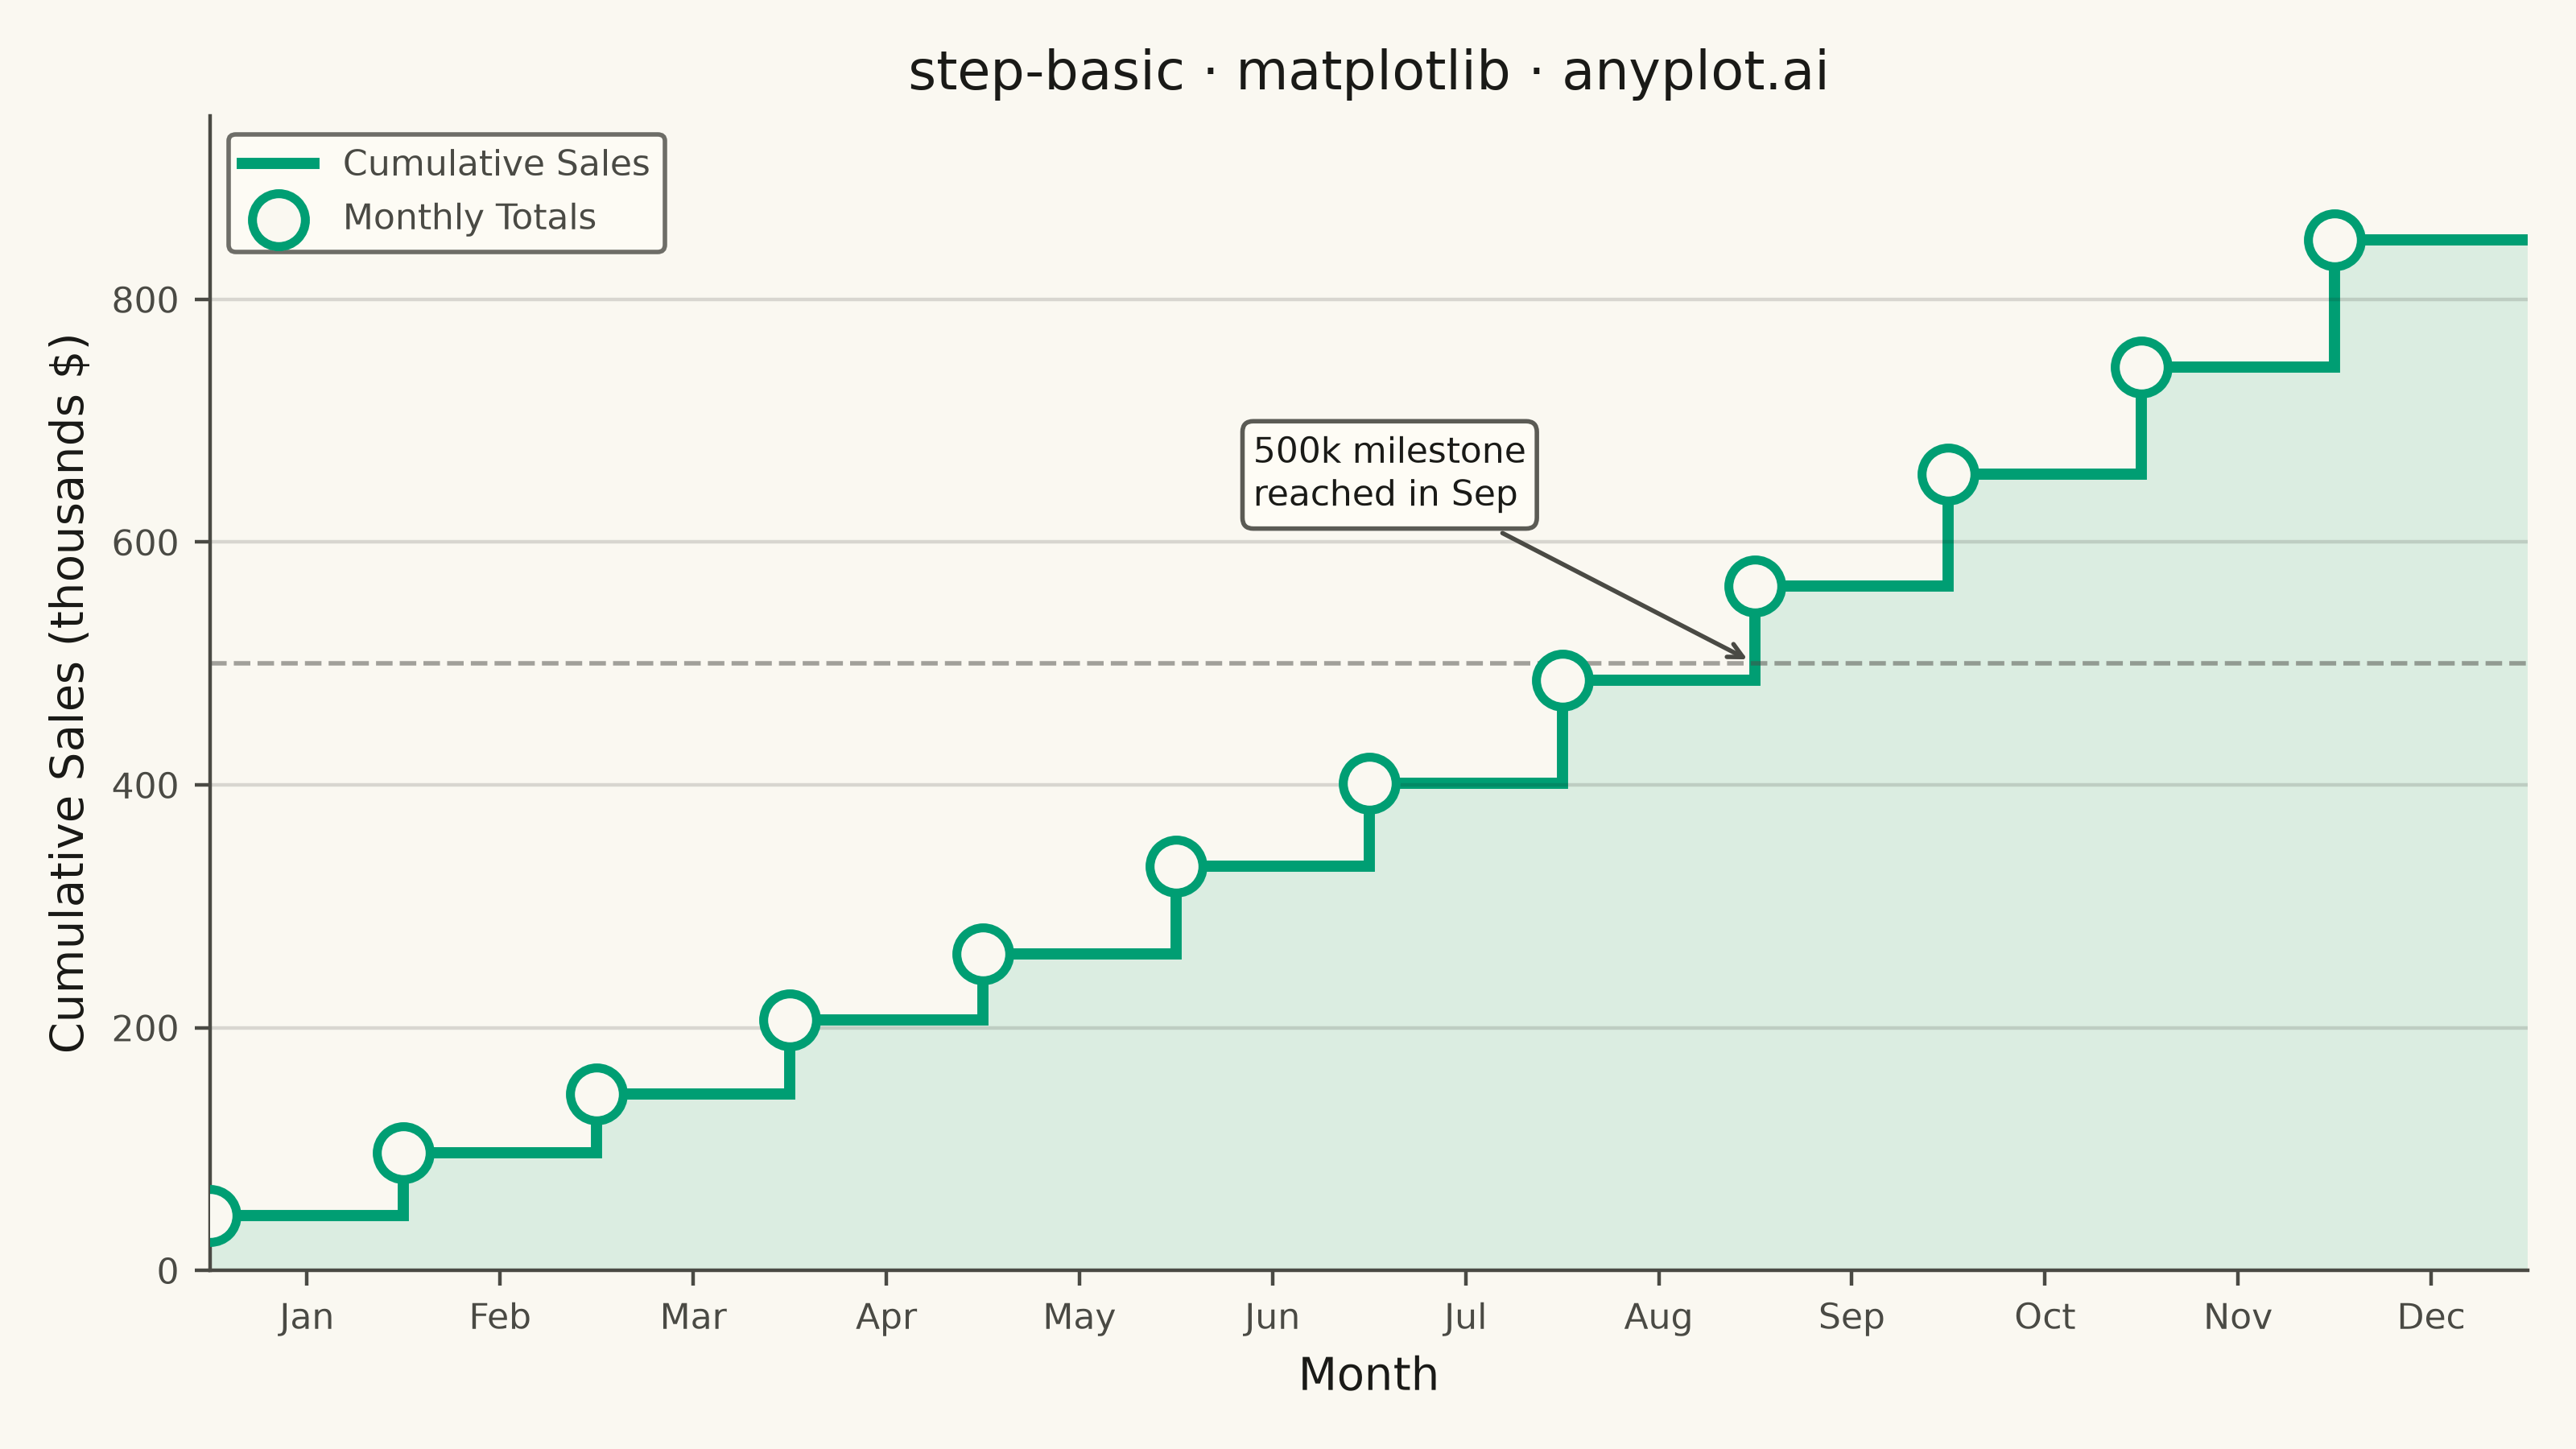
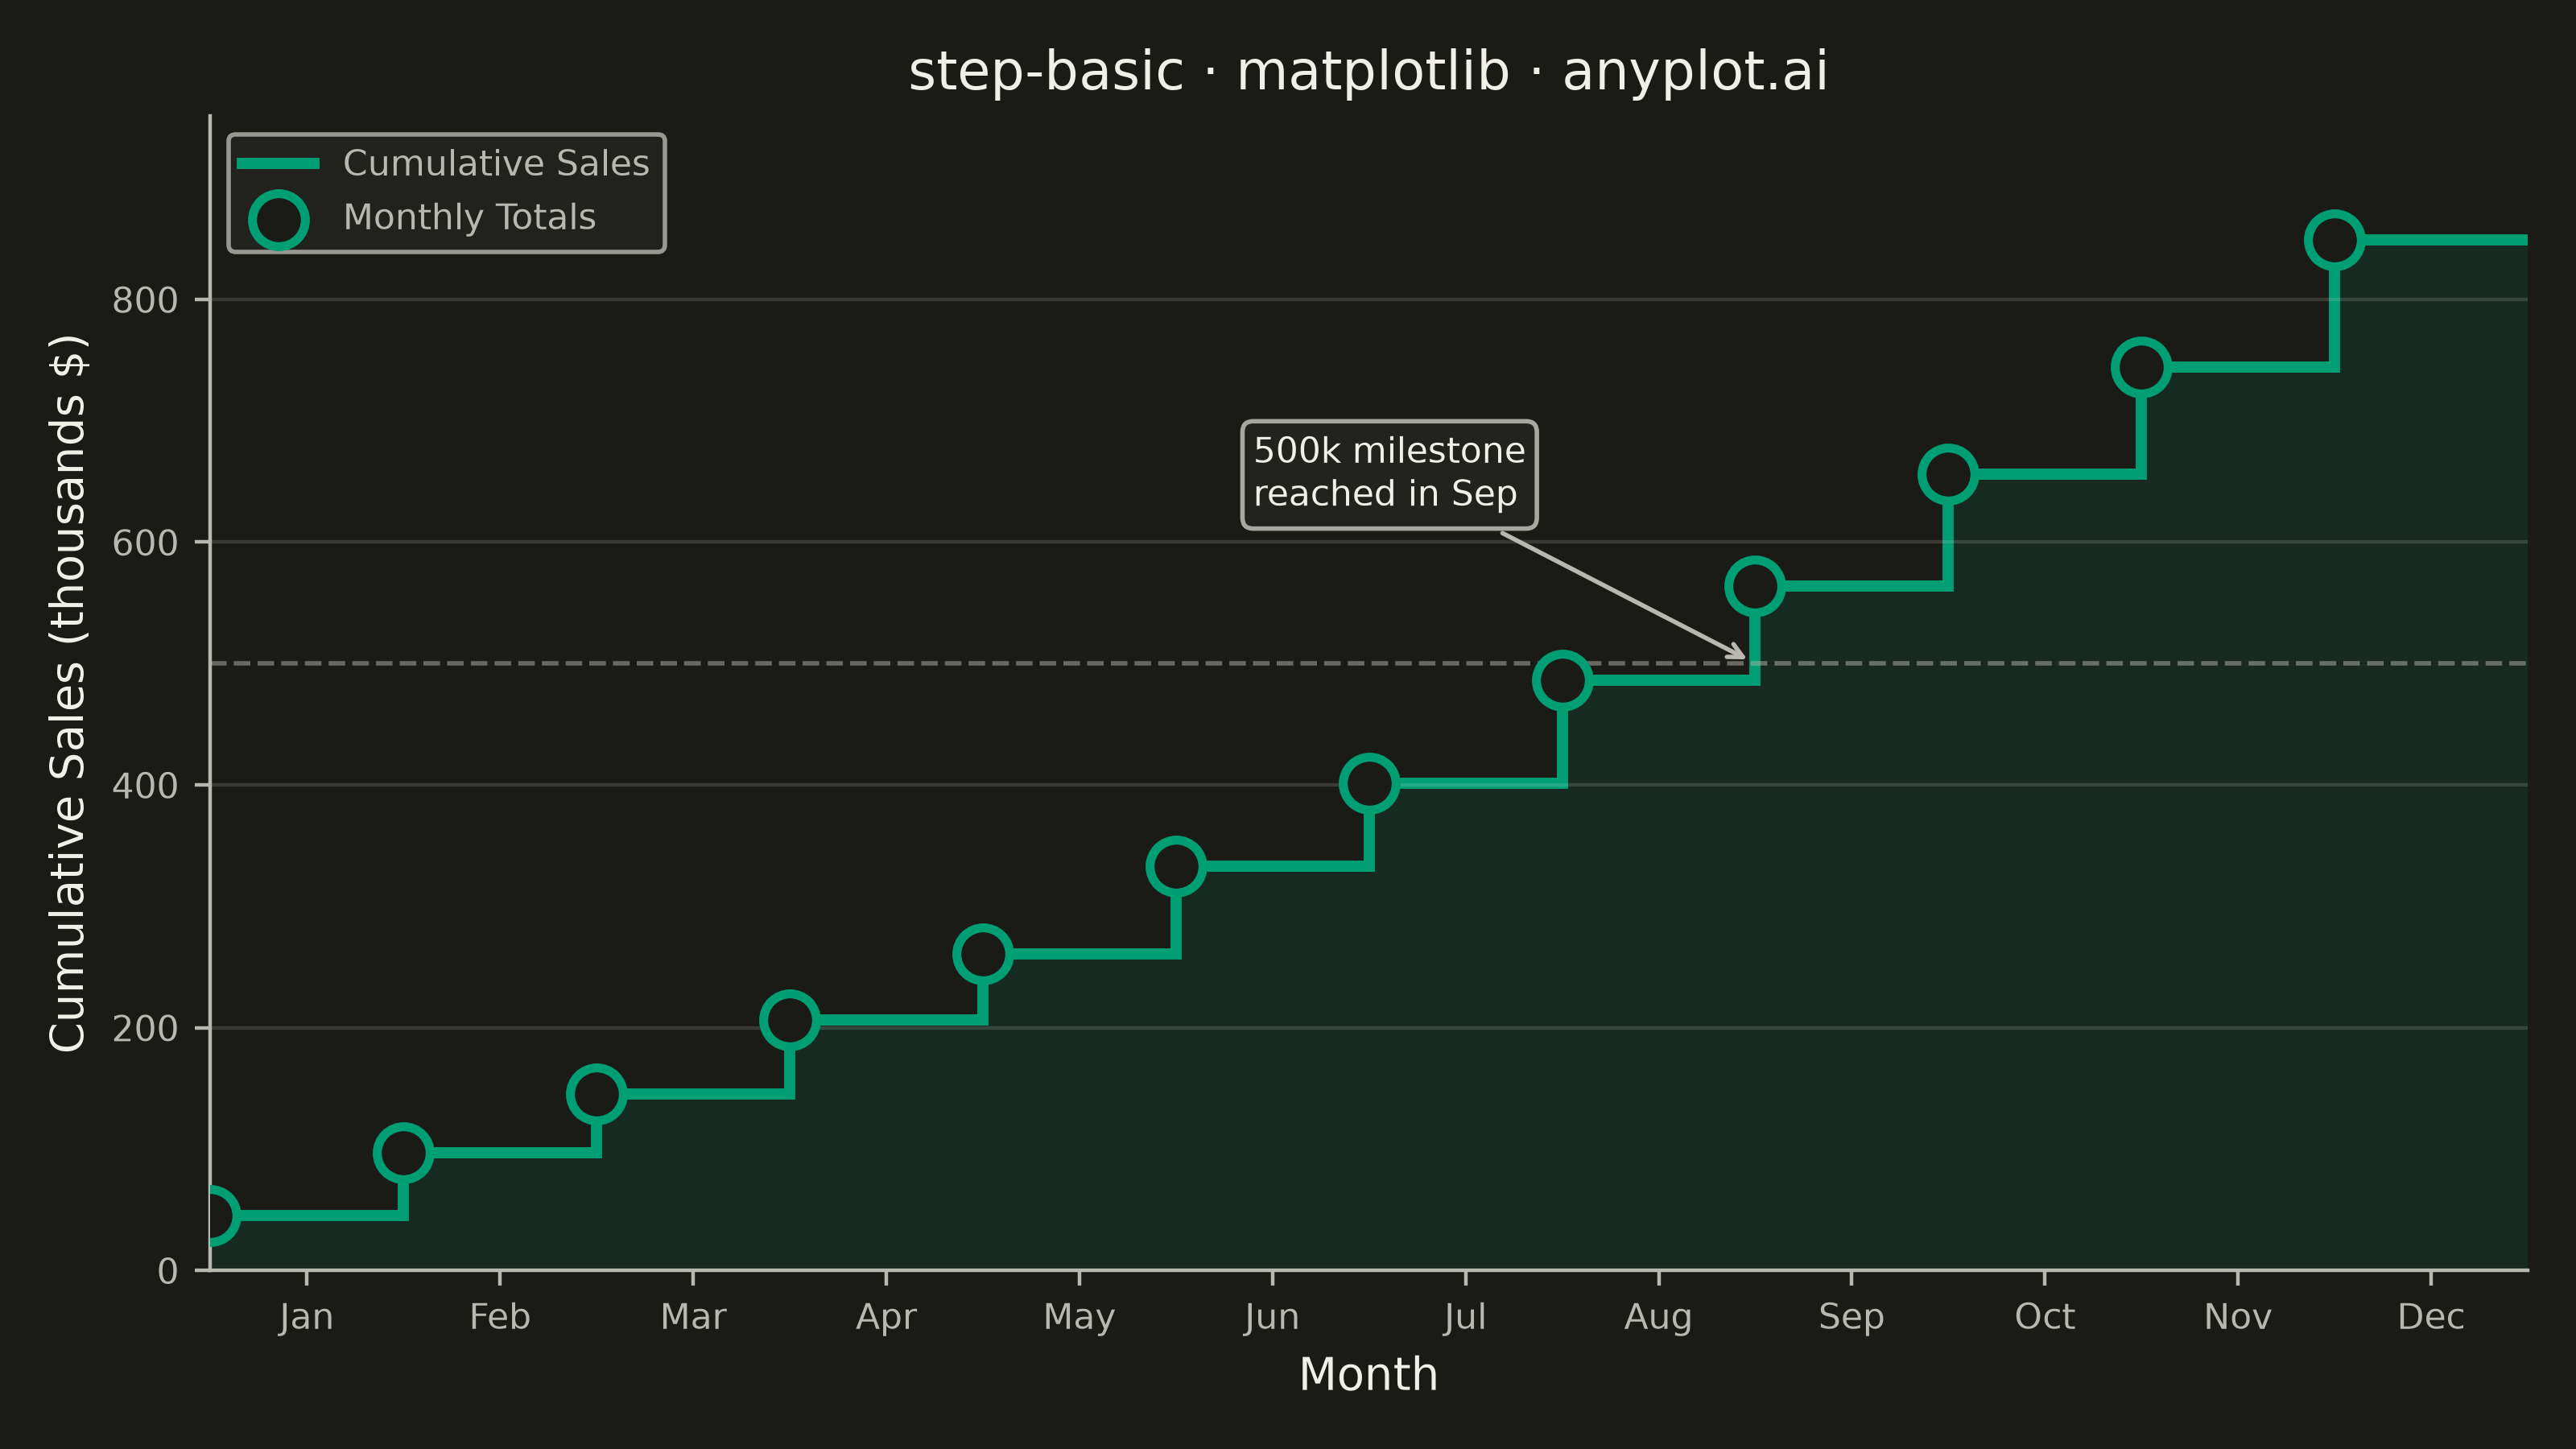
A step plot (also known as a stair plot or stepped line chart) displays data using horizontal lines connected by vertical lines, creating a stair-step pattern. Unlike line charts that interpolate between points, step plots show values as constant until the next change occurs. This makes them ideal for visualizing data that changes at discrete intervals, emphasizing the exact moments when values change.
""" anyplot.ai
step-basic: Basic Step Plot
Library: matplotlib 3.11.1 | Python 3.13.14
Quality: 90/100 | Updated: 2026-07-25
"""

import os

import matplotlib.pyplot as plt
import numpy as np
from matplotlib.colors import to_rgba


# Theme tokens
THEME = os.getenv("ANYPLOT_THEME", "light")
PAGE_BG = "#FAF8F1" if THEME == "light" else "#1A1A17"
ELEVATED_BG = "#FFFDF6" if THEME == "light" else "#242420"
INK = "#1A1A17" if THEME == "light" else "#F0EFE8"
INK_SOFT = "#4A4A44" if THEME == "light" else "#B8B7B0"
BRAND = "#009E73"  # Imprint palette position 1

# Data - monthly cumulative sales figures
month_labels = ["Jan", "Feb", "Mar", "Apr", "May", "Jun", "Jul", "Aug", "Sep", "Oct", "Nov", "Dec"]

monthly_sales = np.array([45, 52, 48, 61, 55, 72, 68, 85, 78, 92, 88, 105])
cumulative_sales = np.cumsum(monthly_sales)
edges = np.arange(0, 13)  # 12 month-wide steps: edges[i] -> edges[i+1] holds cumulative_sales[i]

# Milestone the running total crosses mid-year, for a data-storytelling callout
milestone = 500
milestone_idx = int(np.argmax(cumulative_sales >= milestone))

# Plot
fig, ax = plt.subplots(figsize=(8, 4.5), dpi=400, facecolor=PAGE_BG)
ax.set_facecolor(PAGE_BG)

# ax.stairs is the distinctive step-plot API (matplotlib >=3.4): a single
# StepPatch driven by bin-style edges, used once filled (baseline=0) for the
# area and once outline-only (baseline=None, no bottom edge) for the line.
ax.stairs(cumulative_sales, edges, baseline=0, fill=True, color=BRAND, alpha=0.12)
ax.stairs(cumulative_sales, edges, baseline=None, color=BRAND, linewidth=2.5, label="Cumulative Sales")

# Markers at the start of each step ('post' style: value holds from this point until the next)
# Semi-opaque brand fill (rather than a raw page-background cutout) keeps markers
# prominent against the filled area at small/thumbnail scale in both themes.
ax.scatter(
    edges[:-1],
    cumulative_sales,
    s=140,
    facecolors=to_rgba(BRAND, 0.35),
    edgecolors=BRAND,
    linewidth=2,
    zorder=5,
    label="Monthly Totals",
)

# Milestone callout
ax.axhline(milestone, color=INK_SOFT, linewidth=1, linestyle="--", alpha=0.5)
ax.annotate(
    f"{milestone}k milestone\nreached in {month_labels[milestone_idx]}",
    xy=(edges[milestone_idx], milestone),
    xytext=(edges[milestone_idx] - 2.6, milestone + 130),
    fontsize=8,
    color=INK,
    arrowprops={"arrowstyle": "->", "color": INK_SOFT, "linewidth": 1},
    bbox={"facecolor": ELEVATED_BG, "edgecolor": INK_SOFT, "boxstyle": "round,pad=0.3", "alpha": 0.9},
)

# Style
ax.set_xlabel("Month", fontsize=10, color=INK)
ax.set_ylabel("Cumulative Sales (thousands $)", fontsize=10, color=INK)
ax.set_title("step-basic · matplotlib · anyplot.ai", fontsize=12, fontweight="medium", color=INK)

ax.set_xlim(0, 12)
ax.set_ylim(0, cumulative_sales.max() * 1.12)
ax.set_xticks(edges[:-1] + 0.5)
ax.set_xticklabels(month_labels)
ax.tick_params(axis="both", labelsize=8, colors=INK_SOFT)

ax.spines["top"].set_visible(False)
ax.spines["right"].set_visible(False)
for s in ("left", "bottom"):
    ax.spines[s].set_color(INK_SOFT)

ax.yaxis.grid(True, alpha=0.15, linewidth=0.8, color=INK)

leg = ax.legend(fontsize=8, loc="upper left")
leg.get_frame().set_facecolor(ELEVATED_BG)
leg.get_frame().set_edgecolor(INK_SOFT)
plt.setp(leg.get_texts(), color=INK_SOFT)

plt.tight_layout()
plt.savefig(f"plot-{THEME}.png", dpi=400, facecolor=PAGE_BG)  # bbox_inches stays default (None)
Runnable source as JSON, for any HTTP client: https://api.anyplot.ai/specs/step-basic/matplotlib/code. Any spec id and library id listed in llms-full.txt fit the same URL shape; every URL below is complete and callable.
{
  "spec_id": "step-basic",
  "language": "python",
  "library": "matplotlib",
  "page": "https://anyplot.ai/step-basic/python/matplotlib",
  "hub": "https://anyplot.ai/step-basic",
  "code_json": "https://api.anyplot.ai/specs/step-basic/matplotlib/code",
  "spec_json": "https://api.anyplot.ai/specs/step-basic",
  "render_light_png": "https://storage.googleapis.com/anyplot-images/plots/step-basic/python/matplotlib/plot-light.png",
  "render_dark_png": "https://storage.googleapis.com/anyplot-images/plots/step-basic/python/matplotlib/plot-dark.png",
  "quality_score": 90.0,
  "license": "MIT",
  "guide": "https://anyplot.ai/llms.txt"
}
Part of Basic Step Plot on anyplot.ai.